. 2021 Jul 28;13(15):3803.
doi: 10.3390/cancers13153803.

ENDOG Impacts on Tumor Cell Proliferation and Tumor Prognosis in the Context of PI3K/PTEN Pathway Status

Affiliations

ENDOG Impacts on Tumor Cell Proliferation and Tumor Prognosis in the Context of PI3K/PTEN Pathway Status

Gisel Barés et al. Cancers (Basel). .

Abstract

EndoG influences mitochondrial DNA replication and is involved in somatic cell proliferation. Here, we investigated the effect of ENDOG/Endog expression on proliferation in different tumor models. Noteworthy, ENDOG deficiency reduced proliferation of endometrial tumor cells expressing low PTEN/high p-AKT levels, and Endog deletion blunted the growth of PTEN-deficient 3D endometrial cultures. Furthermore, ENDOG silencing reduced proliferation of follicular thyroid carcinoma and glioblastoma cell lines with high p-AKT expression. High ENDOG expression was associated with a short time to treatment in a cohort of patients with chronic lymphocytic leukemia (CLL), a B-cell lymphoid neoplasm with activation of PI3K/AKT. This clinical impact was observed in the less aggressive CLL subtype with mutated IGHV in which high ENDOG and low PTEN levels were associated with worse outcome. In summary, our results show that reducing ENDOG expression hinders growth of some tumors characterized by low PTEN activity and high p-AKT expression and that ENDOG has prognostic value for some cancer types.

Keywords: AKT; ENDOG; PTEN; chronic lymphocytic leukemia; endometrial carcinoma; glioblastoma.


Conflict of interest statement

The authors declare no conflict of interest.

Figures

Figure 1
Figure 1
ENDOG silencing reduces proliferation in the Ishikawa endometrial carcinoma cell line in association with increased ROS production and reduced AKT-GSK-3 activation, hindering tumor growth. (a) IK cells were transduced with scrambled (Scr) or ENDOG-specific shRNA lentivirus or left to stand (Not transduced, NT). Equal numbers of cells were seeded in 2 plates/treatment and counted after 72 h. Data are expressed as the number of cell cycles completed in 72 h. Cells in replicate plates were counted at time zero to confirm equal initial cell numbers. All values from 4 independent experiments are plotted plus median ± interquartile range. Kruskal–Wallis test followed by Dunn’s test were performed. ***, p < 0.001 vs. Scr. (b) Percentage of dead cells (Trypan blue positive) counted in the experiments shown in (a). Medians ± interquartile range of n = 4 experiments are shown. Kruskal–Wallis test followed by Dunn’s test were performed. (c) Cells cultured in the same conditions as in (a) were detached at the end of the experiment, washed, fixed and stained with propidium iodide. The percentage of cells in each cell cycle phase was determined by flow cytometry. Data depicted on stacked bar graphs are mean ± SD. Statistical analysis was performed by 2-way ANOVA followed by Tukey’s test; n = 4 independent experiments in duplicates. *, p < 0.05; **, p < 0.001; ***, p < 0.001 vs. Scr. (d) Expression analysis of relevant genes was performed in total protein extracts of not transduced (NT), Scrambled-transduced (Scr) and ENDOG shRNA-transduced (shRNA) IK cell cultures. Mitochondria: COXIV subunit 4; DLD: Dihydrolipoamide dehydrogenase; Signaling: phosphorylated and total AKT and its substrate GSK3; Cell cycle regulators: CYCD: Cyclin D1; CDK1: Cyclin-dependent kinase 1; CYCB: Cyclin B. Epithelial–mesenchymal transition (EMT) markers: CATENINB, E-cadherin (molecular weight marks are added in kDa), Vimentin. Loading controls: GAPDH: Glyceraldehyde 3-phosphate dehydrogenase; NB: Naphthol blue staining of the membrane. Representative images of 3 independent experiments are shown. (e) ROS were detected using MitoSOX™ fluorescence quantified by flow cytometry in preparations of IK cells cultured under the same treatments as in (a) in the presence or absence of 0.2 mmol/L N-Acetyl-Cysteine (NAC; n = 4). All values from 4 independent experiments are plotted plus mean ± SD. 2-Way ANOVA followed by Tukey’s test; *, p < 0.05; ****, p < 0.0001. (f) Cell proliferation of cultures as in (d) was measured; n = 4 in duplicates. All values from 4 independent experiments are plotted plus mean ± SD. 2-Way ANOVA followed by Tukey’s test ****, p < 0.0001. (g) Eight 12-week-old SCID female mice were subcutaneously injected with 106 cells/condition (scrambled, Scr; ENDOG shRNA) in their hind limbs (1 condition per limb). Tumor growth was measured with a digital vernier caliper. Animals were sacrificed before tumors reached a volume of 2.5 cm3. Tumor size: d2xD/2 (d and D: minor and major diameters). n = 5 mice. Data represent mean ± SD. Student t-test was performed to compare Scr and ENDOG shRNA tumors each day. (h) IK cells were transduced with scrambled (Scr) or ENDOG-specific shRNA lentiviruses and after 48 h, and equal numbers of cells were seeded. The next day, DMSO (no drug, ND), 10 µmol/L SAHA or 100 µmol/L Etoposide were added to cultures. Cell counting was performed 24 h after drug addition. Data are expressed as fold vs. Scr ND. Statistical analysis was performed by 2-way ANOVA followed by Tukey’s test; n = 3 independent experiments in duplicate. *, p < 0.05; ****, p < 0.0001.
Figure 2
Figure 2
Study of ENDOG expression and its association with PTEN expression and mutations in cell lines and samples of endometrial cancer. (a) Expression analysis of relevant genes was performed in total protein extracts of IK, HEC-1A and MFE-296 endometrial adenocarcinoma cell lines. COXIV subunit 4; DLD: Dihydrolipoyl dehydrogenase. For E-cadherin, molecular weight marks are added in kDa, and the arrow on the right indicates the band of full-length protein. (b) Correlation of ENDOG expression with the histologic grade of endometrial cancer (carcinoma vs. adenocarcinoma) samples from cBioPortal datasets (https://www.cbioportal.org/). Sample size is indicated on the graph. Individual samples were plotted plus median ± interquartile range. (c) Whole genome search for association of ENDOG expression with somatic mutations on the Cancer Regulome Explorer in the UCEC dataset finds only a significant association with PTEN mutations (circular layout). (d) Tumor samples bearing mutations in PTEN have a higher level of ENDOG expression. Sample size is indicated on the graph. Individual samples were plotted plus median ± interquartile range. Mann–Whitney test: p < 0.0001. (e) Boxplots of ENDOG expression levels among normal endometrial tissues and the different histological subtypes of endometrial cancer (UCEC; TCGA project from UALCAN portal). ENDOG expression is significantly higher in the endometrioid than in the serous subtypes (p < 0.00001) or even normal endometrial tissues (p < 0.00001). ****, p < 0.0001.
Figure 3
Figure 3
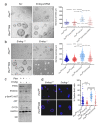
ENDOG deficiency prevents tumor growth induced by PTEN deletion in polarized endometrial epithelial 3D cell cultures. (a) Representative phase contrast microscopy images of Pten-expressing Ptenfl/fl or Pten-deficient Ptenfl/fl + tamoxifen (TAM) endometrial epithelial 3D cultures transduced with scrambled (Scr) or Endog shRNA lentiviral particles. Scale bar: 200 µm. Dot plot graph shows all individual measurements of the glandular perimeter obtained in an experiment performed in triplicate plates. Bars show median ± interquartile range. Kruskal–Wallis test followed by Dunn’s test was performed. ****, p < 0.0001. (b) Representative phase contrast microscopy images of endometrial epithelial 3D cultures obtained from Ptenfl/fl/Endog+/+ or Ptenfl/fl/Endog−/− ± tamoxifen (TAM). Images are obtained at the same magnification as in (a). Dot plot graph shows all individual measurements of the glandular perimeter obtained in three independent experiments performed in duplicate plates. Bars show median ± interquartile range. Kruskal–Wallis test followed by Dunn’s test was performed. ****, p < 0.0001; ***, p < 0.001; **, p < 0.01. (c) Expression analysis of relevant genes was performed in total protein extracts of the cultures described in (b). NB: Naphthol blue staining of the membrane. (d) Representative fluorescence microscopy images of BrdU incorporation in endometrial epithelial 3D cultures obtained from Ptenfl/fl/Endog+/+ or Ptenfl/fl/Endog−/− ± tamoxifen (TAM). Pink: BrdU, blue: Hoechst nuclear staining. Dot plot graph shows the percentage of BrdU-positive cells obtained in three independent experiments performed in duplicate plates. Bars show median ± interquartile range. Kruskal–Wallis test followed by Dunn’s test was performed. ****, p < 0.0001.
Figure 4
Figure 4
The efficiency of ENDOG expression silencing for reducing proliferation associates with the highest p-AKT and low PTEN expression in the thyroid, colorectal and glioblastoma tumor cell lines assessed. (a) Expression analysis of relevant proteins was performed in total extracts of CAL-62 thyroid anaplastic carcinoma, FTC-133 follicular thyroid carcinoma, CACO2 colorectal adenocarcinoma, HT29 colorectal adenocarcinoma and U87 and U251 glioblastoma cells. Representative blots of four independent sets of plates are shown. NB: Naphthol blue staining of the membrane. Graphs show densitometric analysis of Western blot images (relative individual values, median ± interquartile range). *, p < 0.05; ** p < 0.01 (b) The cancer cell lines in (a) were transduced with scrambled (Scr) or ENDOG-specific shRNA lentivirus or left to stand (not transduced, NT). Equal numbers of cells were seeded in 2 plates/treatment and counted after 72 h. Data are expressed as the number of cell cycles completed in 72 h. Cells in replicate plates were counted at time zero to confirm equal initial cell number. All values from 2 to 4 independent experiments performed in duplicate are plotted. Kruskal–Wallis test followed by Dunn’s test were performed. *, p < 0.05 vs. Scr. (c) U251 glioma cells cultured under the same conditions as in (b) were detached at the end of the experiment, washed, fixed and stained with propidium iodide. The percentage of cells in each cell cycle phase was determined by flow cytometry. Data depicted on stacked bar graphs are mean ± SD. Statistical analysis was performed by 2-way ANOVA followed by Tukey’s test; n = 4 independent experiments in duplicate. **, p < 0.01 vs. Scr.
Figure 5
Figure 5
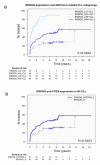
Time to first treatment (TTT) cumulative curves according to ENDOG expression in subgroups of CLL patients and their dependency on PTEN expression levels. (a) CLL patients with high (H) ENDOG expression levels showed a significantly shorter TTT compared to those with low (L) ENDOG expression levels, but only in the M-CLL subgroups between the categories defined by IGHV mutational status. (b) ENDOG expression association with a significantly shorter TTT in the M-CLL subgroup was only detected in cases with concomitant low PTEN expression levels compared to the other combinations of ENDOG and PTEN expression categories (O).

References

    1. Rozenblatt-Rosen O., Regev A., Oberdoerffer P., Nawy T., Hupalowska A., Rood J.E., Ashenberg O., Cerami E., Coffey R.J., Demir E., et al. The Human Tumor Atlas Network: Charting Tumor Transitions across Space and Time at Single-Cell Resolution. Cell. 2020;181:236–249. doi: 10.1016/j.cell.2020.03.053. - DOI - PMC - PubMed
    1. Cossío F.P., Esteller M., Berdasco M. Towards a more precise therapy in cancer: Exploring epigenetic complexity. Curr. Opin. Chem. Biol. 2020;57:41–49. doi: 10.1016/j.cbpa.2020.04.008. - DOI - PubMed
    1. Brand M., Caparica R., Eiger D., Azambuja E. De Biomarkers of response and resistance to PI3K inhibitors in estrogen receptor-positive breast cancer patients and combination therapies involving PI3K inhibitors. Ann. Oncol. 2019;30:x27–x42. doi: 10.1093/annonc/mdz280. - DOI - PMC - PubMed
    1. Côté J., Ruiz-Carrillo A. Primers for mitochondrial DNA replication generated by endonuclease G. Science. 1993;261:765–769. doi: 10.1126/science.7688144. - DOI - PubMed
    1. Blasco N., Cámara Y., Núñez E., Beà A., Barés G., Forné C., Ruíz-Meana M., Girón C., Barba I., García-Arumí E., et al. Cardiomyocyte hypertrophy induced by Endonuclease G deficiency requires reactive oxygen radicals accumulation and is inhibitable by the micropeptide humanin. Redox Biol. 2018;16:146–156. doi: 10.1016/j.redox.2018.02.021. - DOI - PMC - PubMed

LinkOut - more resources