. 2021 Jul 30;13(15):3854.
doi: 10.3390/cancers13153854.

Quantitative Assessment and Prognostic Associations of the Immune Landscape in Ovarian Clear Cell Carcinoma

Affiliations

Quantitative Assessment and Prognostic Associations of the Immune Landscape in Ovarian Clear Cell Carcinoma

Saira Khalique et al. Cancers (Basel). .

Abstract

Ovarian clear cell carcinoma (OCCC) is a rare subtype of epithelial ovarian cancer characterised by a high frequency of loss-of-function ARID1A mutations and a poor response to chemotherapy. Despite their generally low mutational burden, an intratumoural T cell response has been reported in a subset of OCCC, with ARID1A purported to be a biomarker for the response to the immune checkpoint blockade independent of micro-satellite instability (MSI). However, assessment of the different immune cell types and spatial distribution specifically within OCCC patients has not been described to date. Here, we characterised the immune landscape of OCCC by profiling a cohort of 33 microsatellite stable OCCCs at the genomic, gene expression and histological level using targeted sequencing, gene expression profiling using the NanoString targeted immune panel, and multiplex immunofluorescence to assess the spatial distribution and abundance of immune cell populations at the protein level. Analysis of these tumours and subsequent independent validation identified an immune-related gene expression signature associated with risk of recurrence of OCCC. Whilst histological quantification of tumour-infiltrating lymphocytes (TIL, Salgado scoring) showed no association with the risk of recurrence or ARID1A mutational status, the characterisation of TILs via multiplexed immunofluorescence identified spatial differences in immunosuppressive cell populations in OCCC. Tumour-associated macrophages (TAM) and regulatory T cells were excluded from the vicinity of tumour cells in low-risk patients, suggesting that high-risk patients have a more immunosuppressive microenvironment. We also found that TAMs and cytotoxic T cells were also excluded from the vicinity of tumour cells in ARID1A-mutated OCCCs compared to ARID1A wild-type tumours, suggesting that the exclusion of these immune effectors could determine the host response of ARID1A-mutant OCCCs to therapy. Overall, our study has provided new insights into the immune landscape and prognostic associations in OCCC and suggest that tailored immunotherapeutic approaches may be warranted for different subgroups of OCCC patients.

Keywords: ARID1A; biomarker; clear cell ovarian cancer; immune microenvironment; next generation sequencing.


Conflict of interest statement

C.J.L. reports grants from CRUK and Breast Cancer Now during the conduct of the study, is a named inventor on patents describing the use of DNA repair inhibitors and stands to gain from their use as part of the Institute of Cancer Research “Rewards to Inventor” scheme, has received research funding from AstraZeneca, Merck KGaA, Artios, Pfizer, and consultancy and/or advisory fees from Artios, AstraZeneca, MerckKGaA, Tango, and GLG and is a shareholder of OviBio and Tango outside the submitted work. S.B. has worked in an advisory role for Amgen, AstraZeneca, Clovis Oncology, Epsilogen, Genmab, GlaxoSmithKline, Immunogen, Mersana, Merck Sharp & Dohme, Merck Sereno, Oncxerna, Pfizer, Tesaro and Roche, has received institution research funding from AstraZeneca and has received funding support from NIHR RM/ICR Biomedical Research Centre for Cancer. The remining authors declare no conflicts of interest.

Figures

Figure 1
Figure 1
Study workflow. CONSORT diagram showing 34 ovarian clear cell carcinoma (OCCC) cases identified from the Royal Marsden biomarker study (CCR 3705). The same FFPE block was used for extracting DNA for next generation sequencing (NGS), RNA for gene expression analysis, immunohistochemistry (IHC) and multiplexed immunofluorescence (IF). * Case 3705–0573 failed NGS quality control and was not included in further analysis. ** Two of the 34 cases were not included in histological, NanoString and IF analysis: Case 3705–0573 was omitted having failed sequencing and case 3705–0611 failed IHC due to absence of tumour on tissue section and no further tissue blocks available. *** 3705–0435 had matched primary and metastatic samples and only the primary sample was analysed for TIL infiltrate. **** Three further cases had inadequate material for NanoString analysis (3705–0082, 3705–0181, 3705–0713). Three cases failed QC metrics (3705–0625, 3705–0719, 3705–0459). The cohort of 25 OCCCs was supplemented with a cohort of endometrioid carcinomas (endometrioid adenocarcinoma of the ovary (EAO) n = 8 and endometrioid adenocarcinoma of the endometrium (EAE) n = 4, total = 37 cases) for NanoString analysis. ***** Cases 3705–0719 and 3705–0464 had insufficient tissue for MIF analysis.
Figure 2
Figure 2
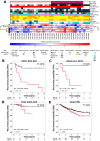
Gene Expression Profiling shows differential gene expression in low- vs. high-risk patient samples. (A) Heatmap demonstrating results from NanoString PanCancer Immune Panel gene expression profiling (n = 37, OCCC n = 25 and endometrioid-EAE and EAO n = 12). (BE) Kaplan–Meier curves depicting the associations with prognosis of the differential gene expression signature in (B) our discovery cohort (all OCCC, EAE and EAO samples (n = 37) and independent validation cohorts), (C) Uehara et al. OCCC samples (n = 25), (D) TCGA UCEC endometrioid endometrial adenocarcinoma samples (n = 107), and (E) TCGA KIRC (kidney renal cell carcinoma) samples (n = 533). OS/DFS event 1 = is event and 0 = censored. Prognostic association (expressed as Hazard ratio ‘HR’) was estimated by fitting Cox proportional hazards model.
Figure 3
Figure 3
OCCC is characterized by low immune infiltrates. (A) Bar chart showing that the greatest proportion of cases (87.1%, 27/31) fall within the lowest Salgado score category, whilst lower proportions fall within the intermediate (3.23%, 1/31) and high Salgado score groups (9.68%, 3/31). (B) From left to right: (i) low (1%), (ii) intermediate (12.5%) and (iii) high (77.5%) Salgado scores represented in H&E sections (arrows indicate TILs, magnification = × 20). (C) Representative micrographs of ARID1A protein expression in OCCC tumours: (i) H&E and (ii) matched ARID1A IHC for ARID1A wild-type case 3705–0207, and (iii) H&E and (iv) matched ARID1A IHC for ARID1A mutant case 3705–0346 showing loss of ARID1A expression. (D) Scatter plot showing Salgado scores in the cohort according to ARID1A mutational status.
Figure 4
Figure 4
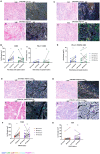
Spatial distribution of immune subpopulations is associated with risk status and ARID1A mutational status in OCCC. (A) Representative H&Es and Vectra images in low- and high-risk patients demonstrating differential spatial locations of PD-L1 + CD68 cells: (i) H&E and (ii) corresponding Vectra IF image in low-risk case 3705–0468 showing stromal PD-L1 + CD68 + cells; (iii) H&E and (iv) corresponding Vectra IF image for high-risk case 3705–0435 demonstrating PD-L1 + CD68 + cells located in a tumour area. (B) Immune cell quantifications subdivided into tumour and stromal locations according to patient risk status (n = 21). Scatter graphs depicting individual data points for each patient for cell density counts of (i) CD68 and (ii) PD-L1 + CD68. (C) Representative H&Es and Vectra images in low- and high-risk patients demonstrating differential spatial locations of PD-L1 + FOXP3 + CD4 + cells; (i) H&E and (ii) corresponding Vectra IF image in low-risk case 3705–0385 showing a stromal PD-L1 + FOXP3 + CD4 + cells; (iii) H&E and (iv) corresponding Vectra IF image for high-risk case 3705–0559 demonstrating PD-L1 + FOXP3 + CD4 cells located in tumour and stroma compartments. These cells are highlighted by red annotations. (D) Immune cell quantifications subdivided into tumour and stromal locations according to patient risk status (n = 21). Scatter graph depicting individual data points for each patient for cell density counts of PD-L1 + FOXP3 + CD4 + cells showing significantly higher numbers of this immune cell-type in the stroma relative to tumour in low-risk patients (n = 9). (E) Representative H&E and corresponding Vectra IF images in ARID1A mutant and wild-type tumours demonstrating CD68 cell findings: (i) H&E for mutant case 3705–0459 and (ii) corresponding Vectra IF image demonstrating CD68 cells located within the stroma and excluded from the tumour cells; (iii) H&E for wild-type case 3705–0379 and (iv) corresponding Vectra IF image demonstrating CD68 cells located in both the stroma and the tumour. (F) Scatter graph depicting individual data points depicting CD68 cell density counts in the tumour and stroma for each patient (n = 30). (G) Representative H&E and corresponding Vectra IF images in ARID1A mutant and wild-type cases demonstrating CD8 + cell findings: (i) H&E of mutant case 3705–0669 and (ii) corresponding Vectra IF image demonstrating CD8 + cells located within the stroma and excluded from the tumour cells; (iii) H&E for wild-type case 3705–0514 and (iv) corresponding Vectra IF image demonstrating CD8 + cells located in both the stroma and the tumour. (H) Scatter graph depicting individual data points for cell density counts of CD8 + cells in the tumour and stroma for each individual patient (n = 30), (** p < 0.01, *** p < 0.001, Wilcoxon matched pairs-signed rank test).

References

    1. Jones S., Li M., Parsons D.W., Zhang X., Wesseling J., Kristel P., Schmidt M.K., Markowitz S., Yan H., Bigner D., et al. Somatic mutations in the chromatin remodeling gene ARID1A occur in several tumor types. Hum. Mutat. 2012;33:100–103. doi: 10.1002/humu.21633. - DOI - PMC - PubMed
    1. Tan D.S., Iravani M., McCluggage W.G., Lambros M.B., Milanezi F., Mackay A., Gourley C., Geyer F.C., Vatcheva R., Millar J., et al. Genomic analysis reveals the molecular heterogeneity of ovarian clear cell carcinomas. Clin. Cancer Res. 2011;17:1521–1534. doi: 10.1158/1078-0432.CCR-10-1688. - DOI - PubMed
    1. Wiegand K.C., Shah S.P., Al-Agha O.M., Zhao Y., Tse K., Zeng T., Senz J., McConechy M.K., Anglesio M.S., Kalloger S.E., et al. ARID1A mutations in endometriosis-associated ovarian carcinomas. N. Engl. J. Med. 2010;359:1532–1543. doi: 10.1056/NEJMoa1008433. - DOI - PMC - PubMed
    1. Goff B.A., de la Cuesta R.S., Muntz H.G., Fleischhacker D., Ek M., Rice L.W., Nikrui N., Tamimi H.K., Cain J.M., Greer B.E., et al. Clear cell carcinoma of the ovary: A distinct histologic type with poor prognosis and resistance to platinum-based chemotherapy in stage III disease. Gynecol. Oncol. 1996;60:412–417. doi: 10.1006/gyno.1996.0065. - DOI - PubMed
    1. Chan J.K., Teoh D., Hu J.M., Shin J.Y., Osann K., Kapp D.S. Do clear cell ovarian carcinomas have poorer prognosis compared to other epithelial cell types? A study of 1411 clear cell ovarian cancers. Gynecol. Oncol. 2008;109:370–376. doi: 10.1016/j.ygyno.2008.02.006. - DOI - PubMed

LinkOut - more resources