. 2021 Jul 5;10(7):1694.
doi: 10.3390/cells10071694.

Alpha-Synuclein Preformed Fibrils Induce Cellular Senescence in Parkinson's Disease Models

Affiliations

Alpha-Synuclein Preformed Fibrils Induce Cellular Senescence in Parkinson's Disease Models

Dinesh Kumar Verma et al. Cells. .

Abstract

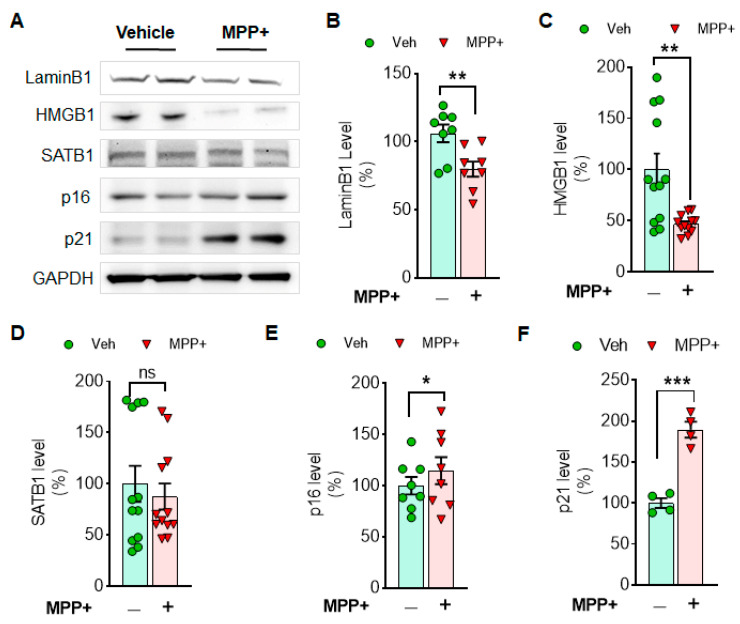
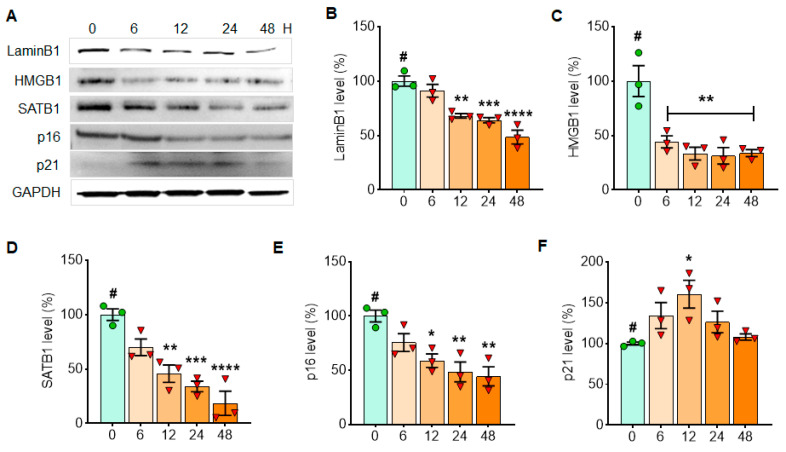
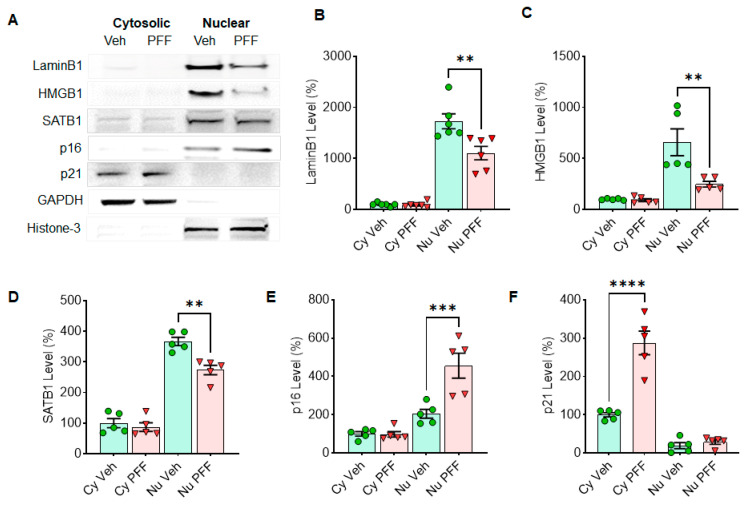
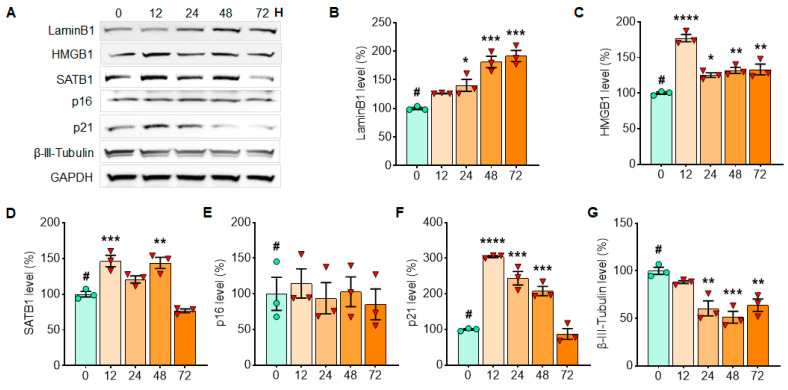
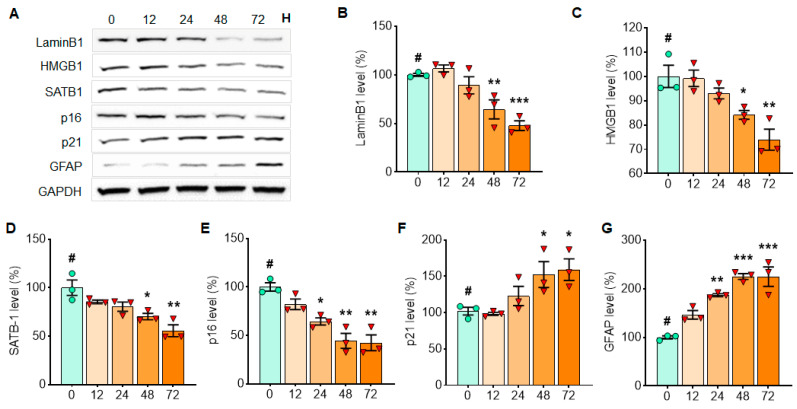
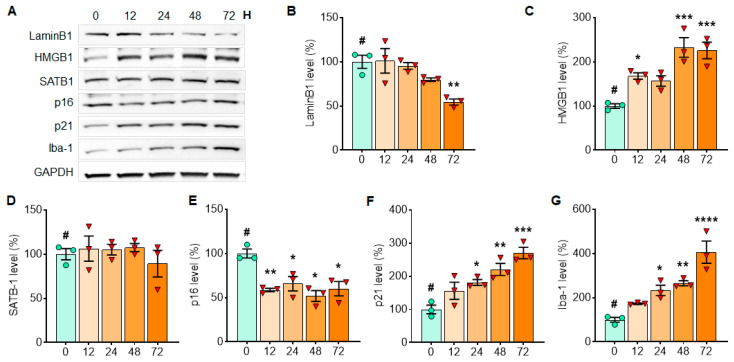
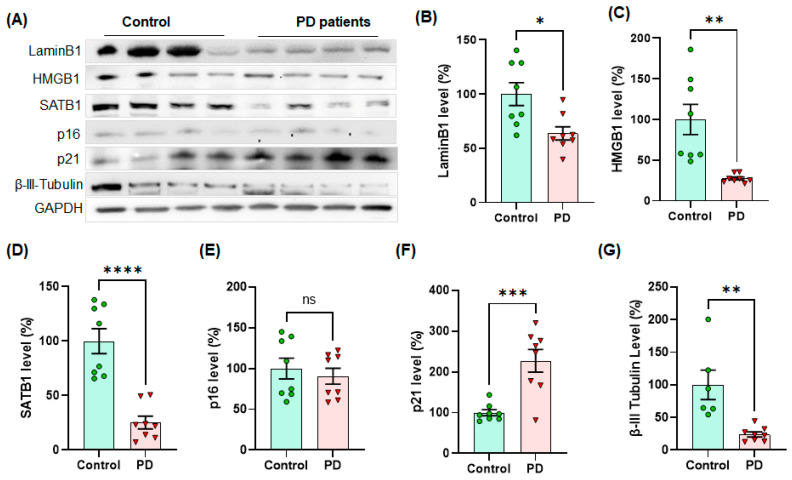
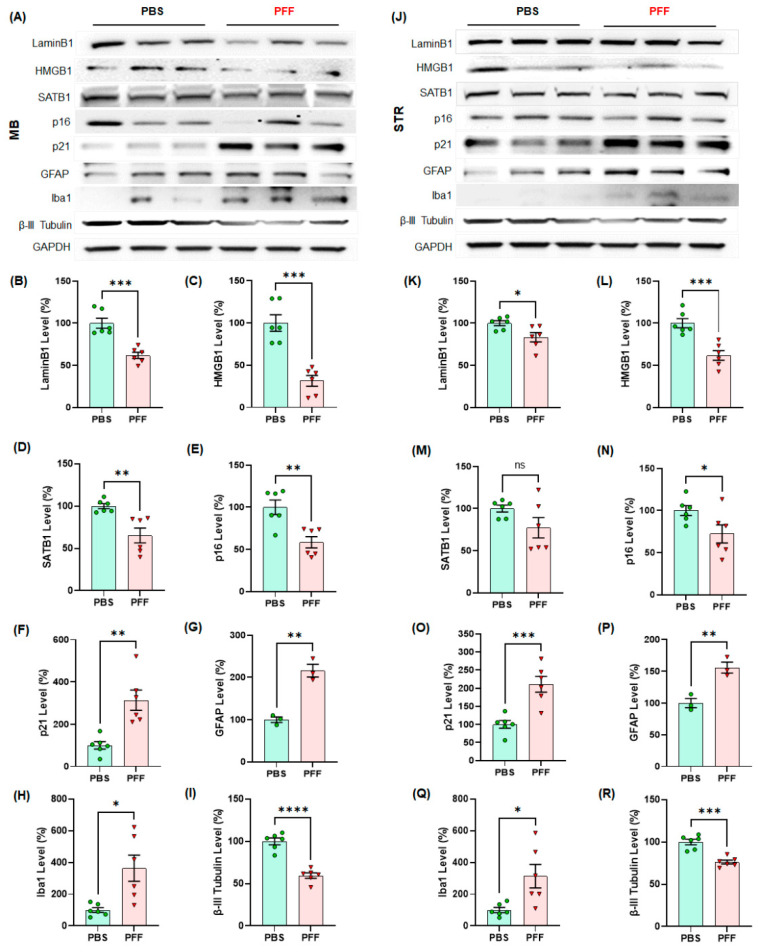
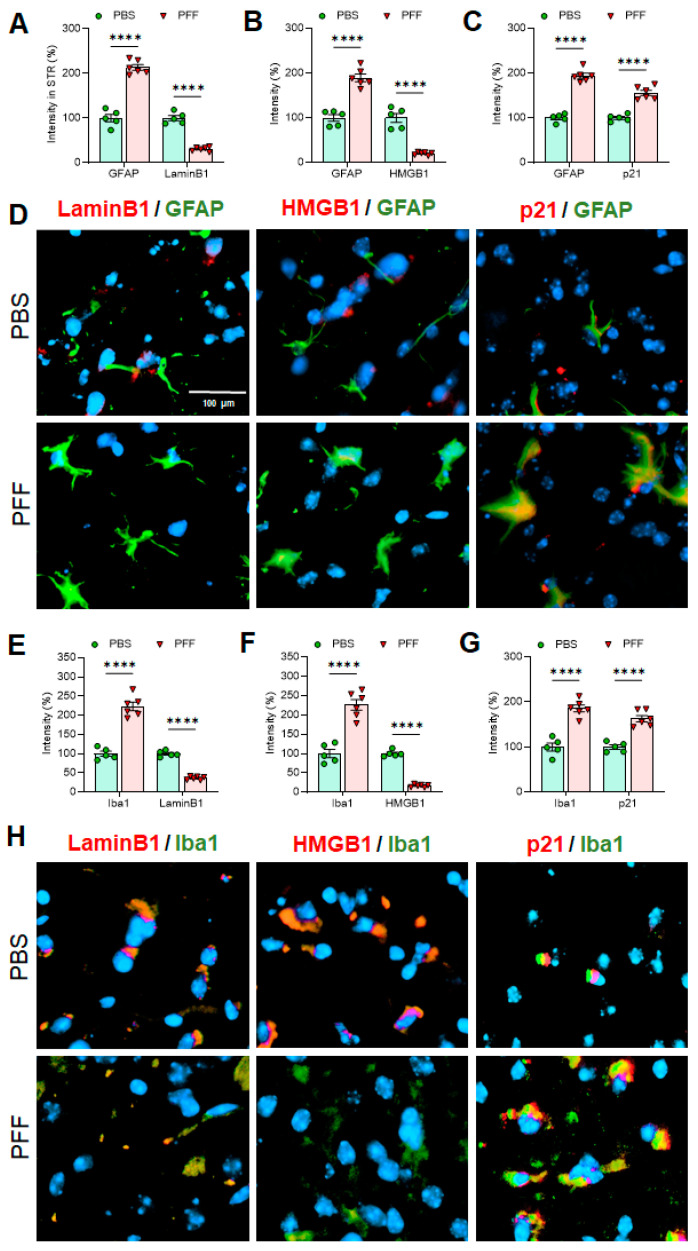
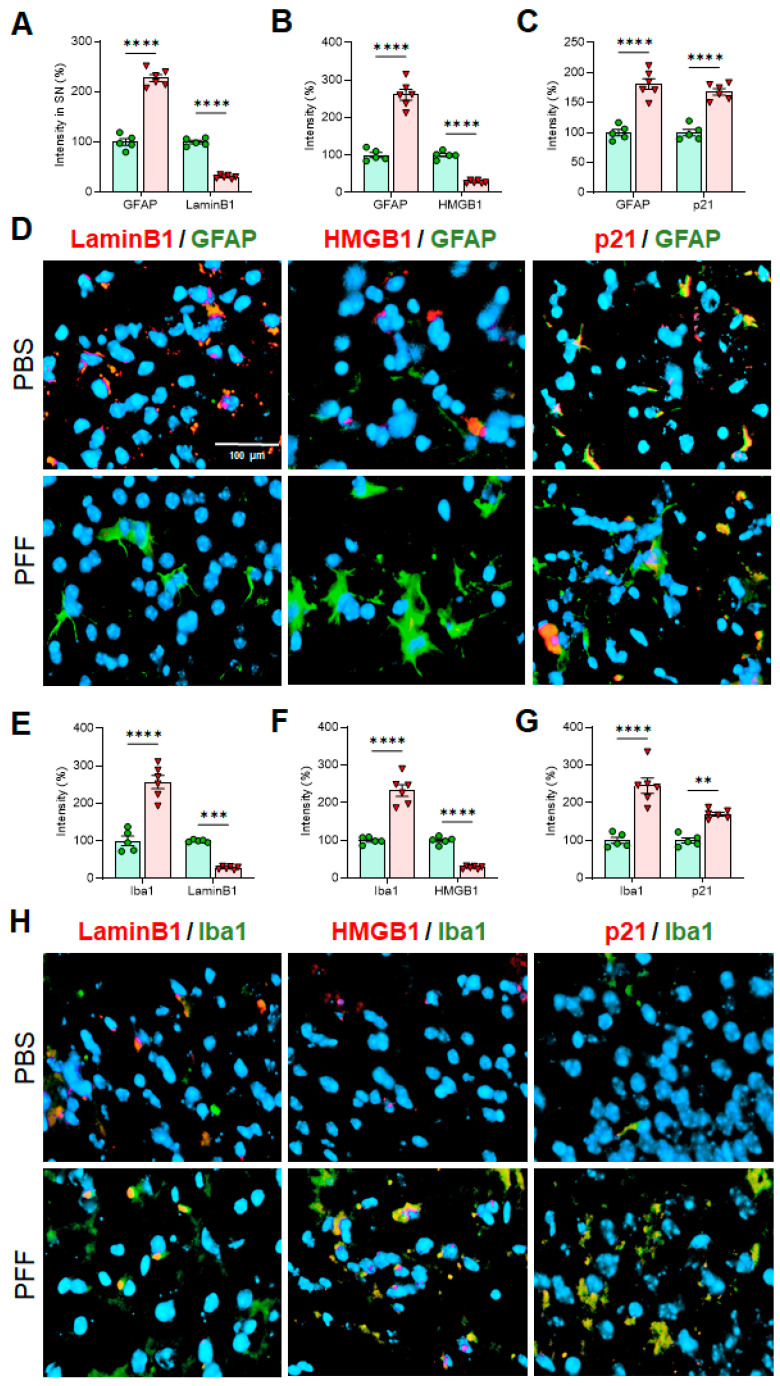
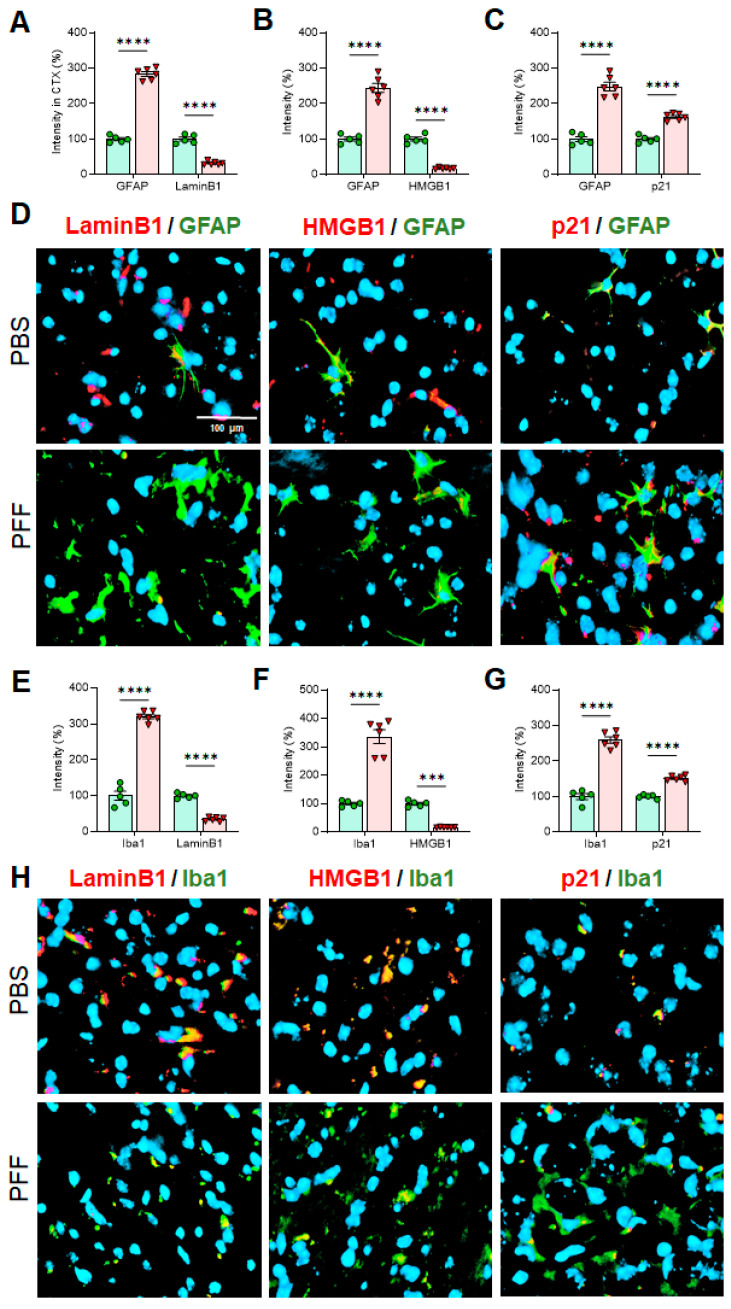
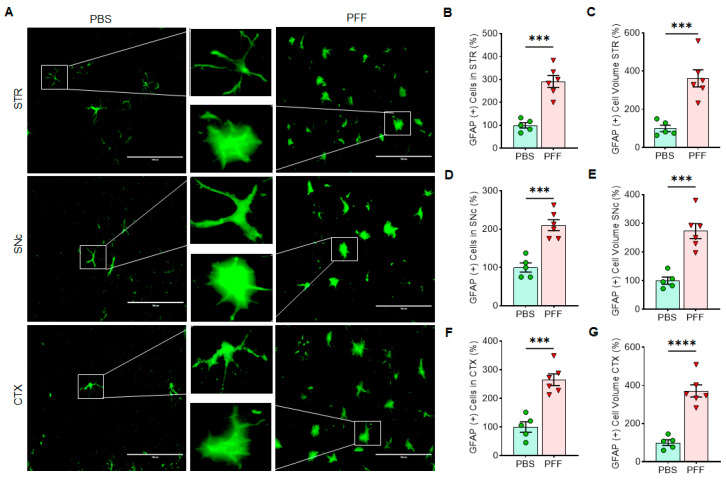
Emerging evidence indicates that cellular senescence could be a critical inducing factor for aging-associated neurodegenerative disorders. However, the involvement of cellular senescence remains unclear in Parkinson's disease (PD). To determine this, we assessed the effects of α-synuclein preformed fibrils (α-syn PFF) or 1-methyl-4-phenylpyridinium (MPP+) on changes in cellular senescence markers, employing α-syn PFF treated-dopaminergic N27 cells, primary cortical neurons, astrocytes and microglia and α-syn PFF-injected mouse brain tissues, as well as human PD patient brains. Our results demonstrate that α-syn PFF-induced toxicity reduces the levels of Lamin B1 and HMGB1, both established markers of cellular senescence, in correlation with an increase in the levels of p21, a cell cycle-arrester and senescence marker, in both reactive astrocytes and microglia in mouse brains. Using Western blot and immunohistochemistry, we found these cellular senescence markers in reactive astrocytes as indicated by enlarged cell bodies within GFAP-positive cells and Iba1-positive activated microglia in α-syn PFF injected mouse brains. These results indicate that PFF-induced pathology could lead to astrocyte and/or microglia senescence in PD brains, which may contribute to neuropathology in this model. Targeting senescent cells using senolytics could therefore constitute a viable therapeutic option for the treatment of PD.

Keywords: HMGB1; Lamin B1; SATB1; alpha-synuclein preformed fibrils; cellular senescence; microglia activation; p21; reactive astrocytes.


Conflict of interest statement

The listed authors declare that we have no conflict of interest with the contents of this article.

Figures

Figure 1
Figure 1
MPP+ toxicity reduces the levels of Lamin B1 and HMGB1, while it increases a cell arrester, p21 in N27 cells. The examples of cellular senescence markers are displayed in Western blots (A). The levels of LaminB1 (B), HMGB1 (C), SATB1 (D), p16 (E) and p21 (F) are displayed in comparison between MPP+ and vehicle treatment. Cellular senescence markers such as LaminB1 and HMGB1 were reduced, but p16 and p21 were enhanced by MPP+ treatment. GAPDH was adopted as a loading control. ImageJ was used for the analyses of band intensities, and relative levels (100% for vehicle) are displayed in mean ± SEM and applied to unpaired Student’s t-test for statistical significance. *: p < 0.05, **: p < 0.01 and ***: p < 0.001. ns: not significant.
Figure 2
Figure 2
α-Syn PFF treatment reduces the expressions of Lamin B1, HMGB1 and SATB1 in N27 cells, whereas it increases p21 expression in a short period of time. The examples of cellular senescence markers over 48 h are displayed in Western blots (A). The levels of LaminB1 (B), HMGB1 (C), SATB1 (D), p16 (E) and p21 (F) with α-syn PFF treatment are displayed in comparison with initial time point (T = 0). GAPDH was adopted as a loading control, and ImageJ was used for the analyses of band intensities. The relative levels (100% for no PFF treated vehicle) are displayed in mean ± SEM and applied to one-way ANOVA, Dunnett’s post-hoc test (#: compared with T = 0 point) for statistical significance. *: p < 0.05, **: p < 0.01, ***: p < 0.001 and ****: p < 0.0001.
Figure 3
Figure 3
Senescence markers in N27 cells are regulated in nuclear (Nu) or cytosolic (Cy) fraction by α-syn PFF treatment. The α-syn PFF treatment reduces the levels of Lamin B1, HMGB1 and SATB1 in nuclear fractions, whereas it increases the levels of p16 in nuclear and p21 in cytosolic fractions after 48 h of exposure. The examples of cellular senescence markers are displayed in Western blots (A). The band intensities of Lamin B1 (B), HMGB1 (C), SATB1 (D), p16 (E) and p21 (F) were quantified using ImageJ. GAPDH and histone-3 were used as a cytosolic- and a nuclear-loading control, respectively. The relative levels (100% for vehicle treatment) are displayed in mean ± SEM and applied to unpaired Student’s t-test for statistical significance. **: p < 0.01, ***: p < 0.001 and ****: p < 0.0001.
Figure 4
Figure 4
The level of p21 was enhanced by α-syn PFF exposure in primary cortical neuronal culture for the first 48 h and then it declined gradually. In Western blots, the levels of senescence markers were quantified in the primary cortical neuron at 12, 24, 48 and 72 h after α-syn PFF exposure to detect the expression patterns over time (A). In the analyses of the expression patterns over 3 days of α-syn PFF exposure, the levels of Lamin B1 (B), HMGB1 (C), SATB1 (D) and p21 (F) increased but β-III-tubulin (G) declined over time; however, p16 (E) was not changed significantly. GAPDH was adopted as a loading control, and ImageJ was used for the analyses of band intensities. The relative levels (100% for no PFF treatment) are displayed in mean ± SEM and applied to one-way ANOVA, Dunnett’s post-hoc test (#: compared with T = 0 point) for statistical significance. *: p < 0.05, **: p < 0.01, ***: p < 0.001 and ****: p < 0.0001.
Figure 5
Figure 5
The levels of cellular senescence markers, such as LaminB1, HMGB1, SATB1 and p16, gradually decrease with α-syn PFF exposure, while the levels of p21 and GFAP increase in the isolated astrocyte culture over 3 days with α-syn PFF. In Western blots, cellular senescence markers were quantified in primary astrocytes culture at 12, 24, 48 and 72 h after α-syn PFF treatment to detect expression patterns over time (A). For assessing the expression patterns over 3 days of α-syn PFF exposure, we quantified the levels of Lamin B1 (B), HMGB1 (C), SATB1 (D), p16 (E), p21 (F) and GFAP (G). GAPDH was used as a loading control. The relative band intensities (100% for no PFF treatment) are displayed in mean ± SEM and applied to one-way ANOVA, Dunnett’s post-hoc test (#: compared with T = 0 point) for statistical significance. *: p <0.05, **: p < 0.01 and ***: p < 0.001.
Figure 6
Figure 6
The levels of LaminB1 and p16 gradually decrease with α-syn PFF treatment, while the levels of HMGB1, p21 and Iba-1 increase in the isolated microglial culture over 3 days of α-syn PFF exposure. In Western blots, senescence markers were quantified in primary microglia culture at 12, 24, 48 and 72 h after α-syn PFF exposure to detect expression patterns over time (A). For assessing the expression levels over 3 days of α-syn PFF exposure, we quantified the levels of Lamin B1 (B), HMGB1 (C), SATB1 (D), p16 (E), p21 (F) and Iba-1 (G). GAPDH was also used as a loading control. The relative band intensities (100% for no PFF treatment) are displayed in mean ± SEM and applied to one-way ANOVA, Dunnett’s post-hoc test (#: compared with T = 0 point) for statistical significance. *: p < 0.05, **: p < 0.01, ***: p < 0.001 and ****: p < 0.0001.
Figure 7
Figure 7
The levels of cellular senescence markers, such as Lamin B1, HMGB1 and SATB1, were significantly lower in human PD SNpc than age- and gender-matched control tissues, whereas the level of p21 was higher in human PD post-mortem SNpc (n = 8/group). In Western blots, the examples of senescence markers are displayed in quadruplets per group (A). The quantified levels of Lamin B1 (B), HMGB1 (C), SATB1 (D), p16 (E), p21 (F) and β-III-tubulin (G) were statistically analyzed in unpaired Student’s t-test for significance. The band intensity of GAPDH was normalized and displayed as relative band intensities (100% for age-matched controls, n = 8/group) in mean ± SEM. *: p < 0.05, **: p < 0.01, ***: p < 0.001 and ****: p < 0.0001. ns: not significant.
Figure 8
Figure 8
The levels of cellular senescence markers such as LaminB1 and HMGB1 were significantly lower in α-syn PFF-injected mouse midbrain (MB) and striatum (STR) than PBS-treated brains, whereas the levels of p21, GFAP and Iba-1 were enhanced by 5–6 months after PFF treatment (n = 6/group). In Western blots, the examples of cellular senescence markers are displayed in triplicates per group ((A) MB, (J) STR). The quantified levels of Lamin B1 (B,K), HMGB1 (C,L), SATB1 (D,M), p16 (E,N), p21 (F,O), GFAP (G,P), Iba-1 (H,Q) and β-III-tubulin (I,R) are demonstrated. The level of β-III-tubulin decreased with α-syn PFF injection due to the neuronal loss. In quantification, the band intensity was normalized by a loading control, GAPDH and displayed in mean ± SEM in relativity (100% for age-matched controls, n = 6/group). The data analysis was applied to unpaired Student’s t-test for statistical significance. *: p < 0.05, **: p < 0.01, ***: p < 0.001 and ****: p < 0.0001. ns: not significant.
Figure 9
Figure 9
In cell-type-specific analyses in the STR, the levels of Lamin B1 and HMGB1 are significantly lower in both astrocytes and microglia in α-syn PFF-injected mouse brains than PBS-treated ones, whereas the levels of p21 in both cell-types are increased with α-syn PFF. In the STR, both GFAP (AC) and Iba-1 (EG) were increased in PFF-injected STR (n = 6/group). The intensities of Lamin B1 and HMGB1 in both astrocytes (A,B,D) and microglia (E,F,H) were reduced, while the levels of p21 were significantly higher with α-syn PFF (C,D,G,H). The label intensities of Lamin B1, HMGB1 and p21 were quantified cell-type specifically (GFAP or Iba-1), based on double-labels in a blinded manner. DAPI stain (blue) was used to indicate the location of nucleus. In quantification, PBS injected STR region was used as a relative label intensity (100%, n = 5–6/group) in mean ± SEM and applied to unpaired Student’s t-test for statistical significance. ****: p < 0.0001. Size bar: 100 µm.
Figure 10
Figure 10
In cell-type-specific analyses in the SNc, the levels of Lamin B1 and HMGB1 are significantly decreased in both astrocytes and microglia in α-syn PFF-injected mouse brains than PBS-treated ones, whereas the levels of p21 in both cell types are increased with α-syn PFF. In the SNc, both GFAP (AC) and Iba-1 (EG) label intensities were increased in PFF-injected SNc (n = 6/group) than PBS control. The intensities of Lamin B1 and HMGB1 in both astrocytes (A,B,D) and microglia (E,F,H) were reduced; however, the levels of p21 were significantly increased in both cell-types with α-syn PFF (C,D,G,H). DAPI stain (blue) was used to indicate the location of nucleus. The label intensities of Lamin B1, HMGB1 and p21 were cell-type specifically quantified, based on double-labels in a blinded manner. In quantification, PBS injected SNc region was used as a relative label intensity (100%, n = 5/group) in mean ± SEM and applied to unpaired Student’s t-test for statistical significance. **: p < 0.01, ***: p < 0.001 and ****: p < 0.0001. Size bar: 100 µm.
Figure 11
Figure 11
In cell-type-specific analyses in the CTX, the levels of Lamin B1 and HMGB1 are significantly lower in both astrocytes and microglia in α-syn PFF-injected brains than PBS-treated ones, whereas the levels of p21 in both cell types are increased with α-syn PFF. In the CTX, both GFAP (AC) and Iba-1 (EG) were increased in PFF-injected CTX (n = 6/group). The intensities of Lamin B1 and HMGB1 in both astrocytes (A,B,D) and microglia (E,F,H) were reduced; however, the levels of p21 were enhanced in both cell types with α-syn PFF (C,D,G,H). DAPI stain (blue) was also used to indicate the location of nucleus. The label intensities of Lamin B1, HMGB1 and p21 were quantified cell-type specifically, based on double-labels in a blinded manner. In quantification, PBS injected CTX region was used as a relative label intensity (100%, n = 5/group) in mean ± SEM and applied to unpaired Student’s t-test for statistical significance. ***: p < 0.001 and ****: p < 0.0001. Size bar: 100 µm.
Figure 12
Figure 12
The number of GFAP-positive astrocytes as well as the cell volume of astrocytes were significantly increased with α-syn PFF treatment in the STR, SNc and CTX. (A) The examples of enlarged astrocytes by α-syn PFF are compared with PBS treated controls and displayed in the STR, SNc and CTX. The astrocyte counting (B,D,F) and cell volume measurement (C,E,G) were analyzed in a blinded manner. In quantification, α-syn PFF-injected brains (n = 6/group) were compared with PBS-injected brains (n = 5/group) in the STR (B,C), SNc (D,E) and CTX (F,G), displayed as a relative number or volume (100% in PBS) in mean ± SEM and applied to unpaired Student’s t-test for statistical significance. ***: p < 0.001 and ****: p < 0.0001. Size bar: 100 µm.

References

    1. Siderowf A., Stern M. Update on Parkinson’s disease. Ann. Intern. Med. 2003;138:651–658. doi: 10.7326/0003-4819-138-8-200304150-00013. - DOI - PubMed
    1. Eriksen J.L., Dawson T.M., Dickson D.W., Petrucelli L. Caught in the act: α-Synuclein is the culprit in Parkinson’s disease. Neuron. 2003;40:453–456. doi: 10.1016/S0896-6273(03)00684-6. - DOI - PubMed
    1. Spillantini M.G., Schmidt M.L., Lee V.M., Trojanowski J.Q., Jakes R., Goedert M. Alpha-synuclein in Lewy bodies. Nature. 1997;388:839–840. doi: 10.1038/42166. - DOI - PubMed
    1. Coppé J.P., Desprez P.Y., Krtolica A., Campisi J. The senescence-associated secretory phenotype: The dark side of tumor suppression. Annu. Rev. Pathol. 2010;5:99–118. doi: 10.1146/annurev-pathol-121808-102144. - DOI - PMC - PubMed
    1. Walton C.C., Begelman D., Nguyen W., Andersen J.K. Senescence as an Amyloid Cascade: The Amyloid Senescence Hypothesis. Front. Cell. Neurosci. 2020;19:129. doi: 10.3389/fncel.2020.00129. - DOI - PMC - PubMed

Publication types

MeSH terms