. 2021 Jul 5;10(7):1701.
doi: 10.3390/cells10071701.

Phosphorylation in the Charged Linker Modulates Interactions and Secretion of Hsp90β

Affiliations

Phosphorylation in the Charged Linker Modulates Interactions and Secretion of Hsp90β

Lorenz Weidenauer et al. Cells. .

Abstract

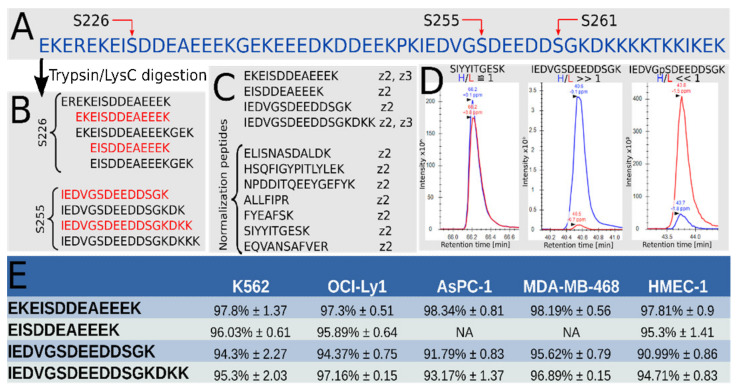
Hsp90β is a major chaperone involved in numerous cellular processes. Hundreds of client proteins depend on Hsp90β for proper folding and/or activity. Regulation of Hsp90β is critical to coordinate its tasks and is mediated by several post-translational modifications. Here, we focus on two phosphorylation sites located in the charged linker region of human Hsp90β, Ser226 and Ser255, which have been frequently reported but whose function remains unclear. Targeted measurements by mass spectrometry indicated that intracellular Hsp90β is highly phosphorylated on both sites (>90%). The level of phosphorylation was unaffected by various stresses (e.g., heat shock, inhibition with drugs) that impact Hsp90β activity. Mutating the two serines to alanines increased the amount of proteins interacting with Hsp90β globally and increased the sensitivity to tryptic cleavage in the C-terminal domain. Further investigation revealed that phosphorylation on Ser255 and to a lesser extent on Ser226 is decreased in the conditioned medium of cultured K562 cells, and that a non-phosphorylatable double alanine mutant was secreted more efficiently than the wild type. Overall, our results show that phosphorylation events in the charged linker regulate both the interactions of Hsp90β and its secretion, through changes in the conformation of the chaperone.

Keywords: chaperone; charged linker; heat shock protein 90; interactome; phosphorylation; proteomics.


Conflict of interest statement

The authors declare no conflict of interest. The funders had no role in the design of the study; in the collection, analyses, or interpretation of data; in the writing of the manuscript, or in the decision to publish the results.

Figures

Figure 1
Figure 1
Determination of occupancy of CL phosphosites in human Hsp90β (HSP90AB1). (A) Amino acid sequence of Hsp90β’s CL with S226, S255 and S261 indicated by red arrows. (B) Typical peptides spanning S226 or S255 resulting from a tryptic digestion of the CL. The peptides marked in red were selected for targeted MS. (C) The complete list of peptides selected for the targeted MS method and their charge state (z number). Normalization peptides are required to determine the H/L ratio for the whole protein. Both phosphopeptides and non-phosphopeptides from the CL were measured. (D) Typical chromatogram for a normalization peptide (here SIYYITGESK, left pane), a non-phosphopeptide from the CL (IEDVGSDEEDDSGK, middle pane), and its corresponding phosphopeptide (IEDVGpSDEEDDSGK, right pane). The chromatogram for the heavy (H) peptide is the blue curve, and the light (L) chromatogram the red curve. (E) Average and standard deviation of phosphorylation occupancy for 5 human cell lines (n = 3).
Figure 2
Figure 2
Quantitative exploration of the interactome of WT vs. AA. (A) Volcano plot of the inverse log10 of the adjusted p-value as a function of the normalized H/L ratio in log2 scale for all 83 quantified interactors (SILAC experiment). Points represent individual proteins. Point color code: co-chaperones in green, Hsp40 proteins in pink, Hsp70 in orange, Hsp90 in red, other already known interactors in blue, and putative interactors in grey. Classification of co-chaperones and known interactors is based on the “Hsp90 interactors” table by Didier Picard (www.picard.ch, accessed on 17 May 2021). Horizontal dashed line marks the 0.05 threshold for the adjusted p-value, vertical dashed lines mark absolute fold-changes greater than 0.4, and vertical red line marks Hsp90β. (B) Gene Ontology (GO) term analysis of the proteins enriched in the AA co-IP. Vertical axis: enriched GO terms. Horizontal axis: the GeneRatio is the ratio between the number of proteins enriched with the corresponding GO term and the total number of proteins identified in the input assigned to the corresponding GO term. Spot size is proportional to the count of proteins enriched (legend on the right of the plot). Spot color corresponds to the adjusted p-value as described in the color scale on the right of the plot.
Figure 3
Figure 3
Sensitivity of WT and AA to limited proteolysis. (A) Reconstructed electropherogram of capillary western blot detection of HA-tag for WT and AA for increasing trypsin concentrations (top, dark background) and graph view below. (B) SDS-PAGE analysis of the trypsin cleavage products. Full-length Hsp90 is indicated by the pink star (“band A”). (C) Boxplots of the ratio of Hsp90β’s unique peptides MS intensity in gel band A relative to initial intensity in gel band A with 0 ng/μL trypsin. p-values comparing WT and AA samples are given above the boxes. Points represent single peptides. (D) The major tryptic cleavage site in Hsp90β’s C domain, near K607 and the major resulting products are shown. (E) Boxplots of the ratio of Hsp90β’s unique peptides MS intensity in band A relative to the summed MS intensity in the rest of the lane (whole lanes were analyzed).
Figure 4
Figure 4
Levels of WT vs. AA in the CM of transfected HEK293T-Hsp90βKO19 cells. (A) CWB detection of HA-tag (red bands) and β-actin (grey bands) in transfected HEK293T-Hsp90βKO19 cells. Dual detection was performed on the same capillaries by chemiluminescence (β-actin) or fluorescence (HA-tag). (B) CWB analysis of HA-tag and β-actin in CM. (C) Total absolute CWB signal in CM divided by total absolute CWB signal (CM plus input). Total absolute signal was adjusted to account for the totality of the sample (it is the expected signal if the whole sample was analyzed at once). Points represent replicates. In red, the p-value from WT vs. AA t-test comparison of HA signal corrected by basal β-actin release.

References

    1. Pearl L.H. Review: The HSP90 molecular chaperone-an enigmatic ATPase. Biopolymers. 2016;105:594–607. doi: 10.1002/bip.22835. - DOI - PMC - PubMed
    1. Prodromou C. Mechanisms of Hsp90 regulation. Biochem. J. 2016;473:2439–2452. doi: 10.1042/BCJ20160005. - DOI - PMC - PubMed
    1. Schopf F.H., Biebl M.M., Buchner J. The HSP90 chaperone machinery. Nat. Rev. Mol. Cell Biol. 2017;18:345–360. doi: 10.1038/nrm.2017.20. - DOI - PubMed
    1. Sima S., Richter K. Regulation of the Hsp90 system. Biochim. Biophys. Acta Mol. Cell Res. 2018;1865:889–897. doi: 10.1016/j.bbamcr.2018.03.008. - DOI - PubMed
    1. Johnson J.L. Evolution and function of diverse Hsp90 homologs and cochaperone proteins. Biochim. Biophys. Acta Mol. Cell Res. 2012;1823:607–613. doi: 10.1016/j.bbamcr.2011.09.020. - DOI - PubMed

Publication types

MeSH terms

LinkOut - more resources