. 2021 Jul 6;10(7):1704.
doi: 10.3390/cells10071704.

Viscoelastic Properties in Cancer: From Cells to Spheroids

Affiliations

Viscoelastic Properties in Cancer: From Cells to Spheroids

Yara Abidine et al. Cells. .

Abstract

AFM-based rheology methods enable the investigation of the viscoelastic properties of cancer cells. Such properties are known to be essential for cell functions, especially for malignant cells. Here, the relevance of the force modulation method was investigated to characterize the viscoelasticity of bladder cancer cells of various invasiveness on soft substrates, revealing that the rheology parameters are a signature of malignancy. Furthermore, the collagen microenvironment affects the viscoelastic moduli of cancer cell spheroids; thus, collagen serves as a powerful proxy, leading to an increase of the dynamic moduli vs. frequency, as predicted by a double power law model. Taken together, these results shed new light on how cancer cells and tissues adapt their viscoelastic properties depending on their malignancy and the microenvironment. This method could be an attractive way to control their properties in the future, based on the similarity of spheroids with in vivo tumor models.

Keywords: AFM; cancer cells; confocal microscopy; microenvironment; rheology; spheroids.


Conflict of interest statement

The authors declare no conflict of interest.

Figures

Figure 1
Figure 1
Viscoelastic moduli of RT112, T24, and J82 cells on an 8 kPa substrate. The elastic modulus G (black) and the loss modulus G (red) are shown as a function of frequency f. These measurements were performed above the cell nucleus. The lines correspond to the model in Equation (3), using (A) G0 = 1567 Pa, a = 0.05, G1 = 0.005 Pa, b = 2.4, G2 = 321 Pa, c = 0.07, G3 = 29.4 Pa, d = 1.05, (B) G0 = 1060 Pa, a = 0.20, G1 = 0.24 Pa, b = 1.7, G2 = 351 Pa, c = 0.08, G3 = 84 Pa, d = 0.8 and (C) G0 = 682 Pa, a = 0.14, G1 = 0.04 Pa, b = 2, G2 = 205 Pa, c = 0.01, G3 = 40 Pa, d = 0.92. N = 5; error bars represent the mean ± the standard error of the mean (SEM).
Figure 2
Figure 2
Parameters G0 (A), exponent a (B), exponent b (C), and exponent c (D) for RT112, T24, and J82 cancer cells on different gels (E = 5–8–28 kPa). The parameters were extracted from fitting averaged G and G for each condition with Equation (3). Three different adjustments were performed, and the means of the fitted parameters were obtained. N=5; error bars represent the mean ± SEM. Asterisks represent a significant difference using the Student t-test: ns = not significant, * p < 0.05 and ** p < 0.01. For each cell line, the statistical asterisk is versus the condition 5 kPa. A bar is added under the asterisk when a statistical difference is found between RT112–T24 and T24–J82 on 8 kPa gels.
Figure 3
Figure 3
(A) Viscoelastic properties (G, G) of a T24 spheroid with no collagen. D 320 μm. Initial number of cells = 10,000. The lines correspond to the model in Equation (3), using G0 = 2100 Pa, a = 0, G1 = 4.8 Pa, b = 1.02, G2 = 530 Pa, c = −0.15, G3 = 4.4 Pa, d = 1.2. (B) Viscoelastic properties (G, G) of a T24 spheroid containing collagen at 0.03 mg/mL. D 410 μm. Initial number of cells=10,000. The same model gives G0 = 358 Pa, a = 0.30, G1 = 0 Pa, b = 0, G2 = 161 Pa, c = 0.35, G3 = 0.026 Pa, d = 1.92. Representative data are shown here with N = 2 (no collagen) and N = 4 (0.03 mg/mL); error bars represent the mean ± SEM.
Figure 4
Figure 4
Role of collagen concentration (0–0.01–0.03 mg/mL) on parameters G0, G1 (A) and exponents a, b, c, d (B). The values of all parameters are reported in Table 1. For each condition, we considered three spheroid sizes ranging from 300 μm to 410 μm with G and G averaged for each spheroid diameter (a total of N = 15, 10, 6 experiments for respective collagen concentrations of 0, 0.01, 0.03 mg/mL). The parameters were then extracted by fitting the averaged G and G with the model in Equation (3). The error bars represent the standard error of the mean (SEM).
Figure 5
Figure 5
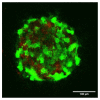
Confocal image of a T24 spheroid with 0.01 mg/mL collagen concentration (GFP cells in green; collagen in red). D 350 μm.

References

    1. Lekka M., Laidler P., Gil D., Lekki J., Stachura Z., Hrynkiewicz A.Z. Elasticity of normal and cancerous human bladder cells studied by scanning force microscopy. Eur. Biophys. J. 1999;28:312–316. doi: 10.1007/s002490050213. - DOI - PubMed
    1. Cross S.E., Jin Y.S., Rao J., Gimzewski J.K. Nanomechanical analysis of cells from cancer patients. Nat. Nanotechnol. 2007;2:780–783. doi: 10.1038/nnano.2007.388. - DOI - PubMed
    1. Verdier C., Étienne J., Duperray A., Preziosi L. Review: Rheological properties of biological materials. C. R. Acad. Sci. Phys. 2009;10:790–811. doi: 10.1016/j.crhy.2009.10.003. - DOI
    1. Rother J., Nöding H., Mey I., Janshoff A. Atomic force microscopy-based microrheology reveals significant differences in the viscoelastic response between malign and benign cell lines. Open Biol. 2014;4:140046. doi: 10.1098/rsob.140046. - DOI - PMC - PubMed
    1. Abidine Y., Laurent V.M., Michel R., Duperray A., Verdier C. Local mechanical properties of bladder cancer cells measured by AFM as a signature of metastatic potential. Eur. Phys. J. Plus. 2015;130:202. doi: 10.1140/epjp/i2015-15202-6. - DOI

Publication types

MeSH terms