Review
. 2021 Jul 16;10(7):1807.
doi: 10.3390/cells10071807.

Two-Pore Channels Regulate Expression of Various Receptors and Their Pathway-Related Proteins in Multiple Ways

Affiliations
Review

Two-Pore Channels Regulate Expression of Various Receptors and Their Pathway-Related Proteins in Multiple Ways

Sonja Grossmann et al. Cells. .

Abstract

Two-pore channels (TPCs) constitute a small family of ion channels within membranes of intracellular acidic compartments, such as endosomes and lysosomes. They were shown to provide transient and locally restricted Ca2+-currents, likely responsible for fusion and/or fission events of endolysosomal membranes and thereby for intracellular vesicle trafficking. Genetic deletion of TPCs not only affects endocytosis, recycling, and degradation of various surface receptors but also uptake and impact of bacterial protein toxins and entry and intracellular processing of some types of viruses. This review points to important examples of these trafficking defects on one part but mainly focuses on the resulting impact of the TPC inactivation on receptor expression and receptor signaling. Thus, a detailed RNA sequencing analysis using TPC1-deficient fibroblasts uncovered a multitude of changes in the expression levels of surface receptors and their pathway-related signaling proteins. We refer to several classes of receptors such as EGF, TGF, and insulin as well as proteins involved in endocytosis.

Keywords: RNA sequence analysis; endolysosomal system; intracellular trafficking; receptor endocytosis; two-pore channel.


Conflict of interest statement

The authors declare no competing interests.

Figures

Figure 1
Figure 1
Differential gene expression (DGE) analysis. (A). Flow chart for RNA sequencing approach. (B). Volcano plot of RNA sequencing expression data of three independent samples (n = 3) of TPC1 knockout vs. wildtype mouse embryonic fibroblasts. Significantly up- and downregulated genes are indicated as blue and red dots, respectively. Grey area shows genes that were not differentially expressed. Only when p-value and false discovery rate were <0.05 gene expression change was considered statistically significant. RNA sequencing and differential gene expression analysis were performed as previously described [35]. Volcano plot was made using tools integrated in the Galaxy platform [46]. Original sequencing data were deposited in the Short Read Archive at the National Center for Biotechnology Information (NCBI) under the BioProject ID PRJNA694624.
Figure 2
Figure 2
Pathway enrichment analysis of the 350 most up- and downregulated genes using ClueGO (Cytoscape software plugin, [48]. GO/Reactome/WikiPathways/KEGG pathway ([47,49,50,51]) functionally grouped networks with terms indicated as nodes (Benjamini–Hochberg p value < 0.05) linked by their kappa score level (≥0.4); only the label of the most significant term per group is shown. The size of the node correlates with the term significance. The node color shows the proportion of genes either upregulated (red) or downregulated (blue) associated with the term.
Figure 3
Figure 3
Differential gene expression of TGF-β receptor signaling pathway proteins in TPC1-deficient MEF cells compared with wildtype cells. Color code indicates changes in expression. Up- and downregulated genes are displayed in red and blue, respectively. Genes that show no significant differential expression (q > 0.05) in RNA-seq are shown in white (fold change = 1). Figure was adopted from an illustration and by courtesy of Cell Signaling Technology, Inc.
Figure 4
Figure 4
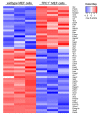
Heatmap of genes involved in insulin receptor signaling. Heatmap showing significantly differentially expressed genes (q < 0.05) in three independent samples (n = 3) of TPC1 deficient MEF vs. wildtype cells that are involved in insulin receptor signaling (KEGG pathway 04910; [49]. Each column stands for one independent sample of the depicted genotype. Expression values are shown as the Z-scores of the log2 transformed normalized counts for each gene. Red and blue are assigned to higher and lower expression, respectively, according to the color key in the upper right. Heatmap was created using tools integrated in the Galaxy platform [46]. Original sequencing data were deposited in the Short Read Archive at the National Center for Biotechnology Information (NCBI) under the BioProject ID PRJNA694624.
Figure 5
Figure 5
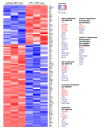
Heatmap of genes involved in endocytosis. Heatmap showing significantly differentially expressed genes (q < 0.05) in TPC1 deficient MEF vs. wildtype cells that are involved in endocytosis (KEGG pathway 04144; [49]. Expression values are shown as Z-scores of the log2 transformed normalized counts for each gene. Each column stands for one independent sample of the depicted genotype (n = 3). Red and blue are assigned to a higher and a lower expression, respectively, according to the color key in the upper right. Heatmap was created using tools integrated in the Galaxy platform [46]. All genes listed were compared to GO terms shown on the right. Only genes that were significantly changed were included and categorized according to the endolysosomal compartment or to the nature of endocytosis. Same color code was used as in heatmap. Original sequencing data were deposited in the Short Read Archive at the National Center for Biotechnology Information (NCBI) under the BioProject ID PRJNA694624.

References

    1. Ruas M., Davis L.C., Chen C.C., Morgan A.J., Chuang K.T., Walseth T.F., Grimm C., Garnham C., Powell T., Platt N., et al. Expression of Ca2+-permeable two-pore channels rescues NAADP signalling in TPC-deficient cells. EMBO J. 2015;34:1743–1758. doi: 10.15252/embj.201490009. - DOI - PMC - PubMed
    1. Ruas M., Chuang K.T., Davis L.C., Al-Douri A., Tynan P.W., Tunn R., Teboul L., Galione A., Parrington J. TPC1 has two variant isoforms and their removal has different effects on endo-lysosomal functions compared to loss of TPC2. Mol. Cell. Biol. 2014 doi: 10.1128/MCB.00113-14. - DOI - PMC - PubMed
    1. Jaslan D., Bock J., Krogsaeter E., Grimm C. Evolutionary Aspects of TRPMLs and TPCs. Int. J. Mol. Sci. 2020;21:4181. doi: 10.3390/ijms21114181. - DOI - PMC - PubMed
    1. Guo J., Zeng W., Chen Q., Lee C., Chen L., Yang Y., Cang C., Ren D., Jiang Y. Structure of the voltage-gated two-pore channel TPC1 from Arabidopsis thaliana. Nature. 2016;531:196–201. doi: 10.1038/nature16446. - DOI - PMC - PubMed
    1. Kintzer A.F., Stroud R.M. Structure, inhibition and regulation of two-pore channel TPC1 from Arabidopsis thaliana. Nature. 2016;531:258–262. doi: 10.1038/nature17194. - DOI - PMC - PubMed

Publication types

LinkOut - more resources