

A Simplified Population-Level Landscape Model Identifying Ecological Risk Drivers of Pesticide Applications, Part One: Case Study for Large Herbivorous Mammals
- PMID: 34360014
- PMCID: PMC8345457
- DOI: 10.3390/ijerph18157720
A Simplified Population-Level Landscape Model Identifying Ecological Risk Drivers of Pesticide Applications, Part One: Case Study for Large Herbivorous Mammals
Abstract
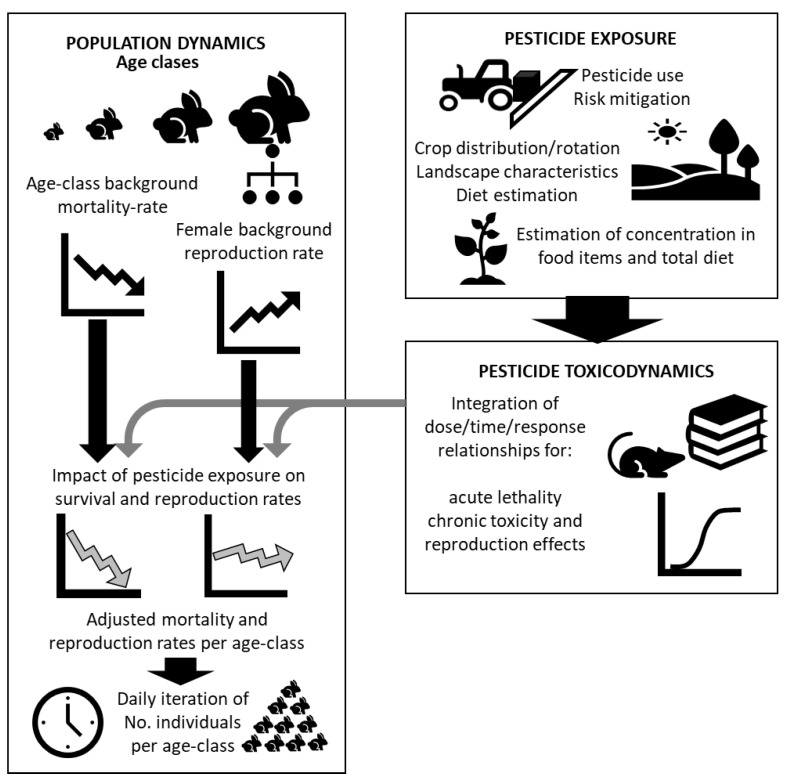
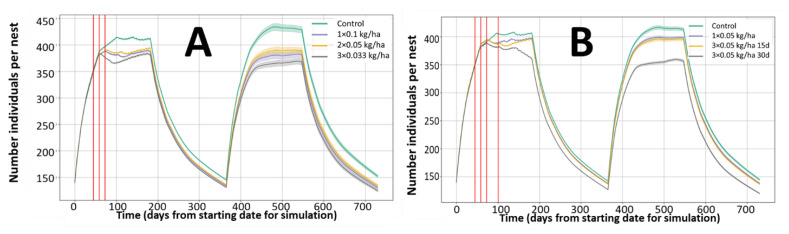
Environmental risk assessment is a key process for the authorization of pesticides, and is subjected to continuous challenges and updates. Current approaches are based on standard scenarios and independent substance-crop assessments. This arrangement does not address the complexity of agricultural ecosystems with mammals feeding on different crops. This work presents a simplified model for regulatory use addressing landscape variability, co-exposure to several pesticides, and predicting the effect on population abundance. The focus is on terrestrial vertebrates and the aim is the identification of the key risk drivers impacting on mid-term population dynamics. The model is parameterized for EU assessments according to the European Food Safety Authority (EFSA) Guidance Document, but can be adapted to other regulatory schemes. The conceptual approach includes two modules: (a) the species population dynamics, and (b) the population impact of pesticide exposure. Population dynamics is modelled through daily survival and seasonal reproductions rates; which are modified in case of pesticide exposure. All variables, parameters, and functions can be modified. The model has been calibrated with ecological data for wild rabbits and brown hares and tested for two herbicides, glyphosate and bromoxynil, using validated toxicity data extracted from EFSA assessments. Results demonstrate that the information available for a regulatory assessment, according to current EU information requirements, is sufficient for predicting the impact and possible consequences at population dynamic levels. The model confirms that agroecological parameters play a key role when assessing the effect of pesticide exposure on population abundance. The integration of laboratory toxicity studies with this simplified landscape model allows for the identification of conditions leading to population vulnerability or resilience. An Annex includes a detailed assessment of the model characteristics according to the EFSA scheme on Good Modelling Practice.
Keywords: hare; landscape risk assessment; pesticides; population model; rabbit.
Conflict of interest statement
The authors declare that they have no actual or potential competing financial interests. The author J.V.T. is employed with the European Food Safety Authority (EFSA) in the Scientific Committee and Emerging Risks Unit, which provides scientific support to EFSA’s Scientific activities. However, the present article is published under the sole responsibility of the authors and may not be considered as an EFSA scientific output. The positions and opinions presented in this article are those of the authors alone and do not represent the views of EFSA. The author G.T. is employed with PharmaMar, however this work has not been conducted as part of this current affiliation. The author D.T. has conducted this work on personal capacity as independent researcher, not linked to current or past affiliations.
Figures
Similar articles
-
Appropriate exposure estimates for wildlife risk assessments of crop protection products based on continuous radio telemetry: A case study with woodpigeons.Environ Toxicol Chem. 2017 May;36(5):1270-1277. doi: 10.1002/etc.3656. Epub 2016 Dec 13. Environ Toxicol Chem. 2017. PMID: 27753137
-
Predicting environmental concentrations and the potential risk of Plant Protection Products (PPP) on non-target soil organisms accounting for regional and landscape ecological variability in european soils.Chemosphere. 2022 Sep;303(Pt 2):135045. doi: 10.1016/j.chemosphere.2022.135045. Epub 2022 May 21. Chemosphere. 2022. PMID: 35609662
-
A conceptual framework for landscape-based environmental risk assessment (ERA) of pesticides.Environ Int. 2024 Sep;191:108999. doi: 10.1016/j.envint.2024.108999. Epub 2024 Sep 10. Environ Int. 2024. PMID: 39276592
-
Environmental risk assessment in agro-ecosystems: Revisiting the concept of receiving environment after the EFSA guidance document.Ecotoxicol Environ Saf. 2021 Jan 15;208:111676. doi: 10.1016/j.ecoenv.2020.111676. Epub 2020 Nov 21. Ecotoxicol Environ Saf. 2021. PMID: 33396008 Review.
-
Assessing the Risks to Bats from Plant Protection Products: A Review of the Recent European Food Safety Authority Statement Regarding Toxicity and Exposure Routes.Environ Toxicol Chem. 2021 Nov;40(11):2978-2989. doi: 10.1002/etc.5209. Epub 2021 Oct 12. Environ Toxicol Chem. 2021. PMID: 34499761 Free PMC article. Review.
Cited by
-
Could Exposure to Glyphosate Pose a Risk to the Survival of Wild Animals? A Case Study on the Field Lizard Podarcis siculus.Vet Sci. 2023 Sep 21;10(9):583. doi: 10.3390/vetsci10090583. Vet Sci. 2023. PMID: 37756105 Free PMC article. Review.
-
The use of new approach methodologies for the environmental risk assessment of food and feed chemicals.Curr Opin Environ Sci Health. 2023 Feb;31:1-8. doi: 10.1016/j.coesh.2022.100416. Curr Opin Environ Sci Health. 2023. PMID: 36741274 Free PMC article.
References
-
- EFSA Scientific Committee Guidance to develop specific protection goals options for environmental risk assessment at EFSA, in relation to biodiversity and ecosystem services. EFSA J. 2016;14:04499. doi: 10.2903/j.efsa.2016.4499. - DOI
-
- Risk Assessment for Birds and Mammals. EFSA J. 2009;7:1438. doi: 10.2903/j.efsa.2009.1438. - DOI
-
- Forbes V.E., Hommen U., Thorbek P., Heimbach F., Brink P.V.D., Wogram J., Thulke H.-H., Grimm V. Ecological Models in Support of Regulatory Risk Assessments of Pesticides: Developing a Strategy for the Future. Integr. Environ. Assess. Manag. 2009;5:167–172. doi: 10.1897/IEAM_2008-029.1. - DOI - PubMed
-
- EFSA Panel on Plant Protection Products and their Residues (PPR) Ockleford C., Adriaanse P., Berny P., Brock T., Duquesne S., Grilli S., Hernandez-Jerez A.F., Bennekou S.H., Klein M., et al. Scientific Opinion on the state of the art of Toxicokinetic/Toxicodynamic (TKTD) effect models for regulatory risk assessment of pesticides for aquatic organisms. EFSA J. 2018;16:e05377. doi: 10.2903/j.efsa.2018.5377. - DOI - PMC - PubMed
MeSH terms
Substances
LinkOut - more resources
Full Text Sources
Medical
Miscellaneous
