. 2021 Jul 22;22(15):7847.
doi: 10.3390/ijms22157847.

Cytokine-Laden Extracellular Vesicles Predict Patient Prognosis after Cerebrovascular Accident

Affiliations

Cytokine-Laden Extracellular Vesicles Predict Patient Prognosis after Cerebrovascular Accident

Anthony Fringuello et al. Int J Mol Sci. .

Abstract

Background: A major contributor to disability after hemorrhagic stroke is secondary brain damage induced by the inflammatory response. Following stroke, global increases in numerous cytokines-many associated with worse outcomes-occur within the brain, cerebrospinal fluid, and peripheral blood. Extracellular vesicles (EVs) may traffic inflammatory cytokines from damaged tissue within the brain, as well as peripheral sources, across the blood-brain barrier, and they may be a critical component of post-stroke neuroinflammatory signaling.

Methods: We performed a comprehensive analysis of cytokine concentrations bound to plasma EV surfaces and/or sequestered within the vesicles themselves. These concentrations were correlated to patient acute neurological condition by the Glasgow Coma Scale (GCS) and to chronic, long-term outcome via the Glasgow Outcome Scale-Extended (GOS-E).

Results: Pro-inflammatory cytokines detected from plasma EVs were correlated to worse outcomes in hemorrhagic stroke patients. Anti-inflammatory cytokines detected within EVs were still correlated to poor outcomes despite their putative neuroprotective properties. Inflammatory cytokines macrophage-derived chemokine (MDC/CCL2), colony stimulating factor 1 (CSF1), interleukin 7 (IL7), and monokine induced by gamma interferon (MIG/CXCL9) were significantly correlated to both negative GCS and GOS-E when bound to plasma EV membranes.

Conclusions: These findings correlate plasma-derived EV cytokine content with detrimental outcomes after stroke, highlighting the potential for EVs to provide cytokines with a means of long-range delivery of inflammatory signals that perpetuate neuroinflammation after stroke, thus hindering recovery.

Keywords: Glasgow Coma Scale-Extended; Glasgow Outcome Scale; chemotaxis; cytokines; extracellular vesicles; hemorrhagic stroke; inflammation.


Conflict of interest statement

The authors declare no conflict of interest. The funders had no role in the design of the study; in the collection, analyses, or interpretation of data; in the writing of the manuscript; or in the decision to publish the results.

Figures

Figure 1
Figure 1
Regression analysis of plasma cytokines correlated to GCS at 5–7 days after hemorrhagic stroke. Negative values correspond to lower GCS; positive values correspond to higher GCS. Three anti-inflammatory cytokines were identified. HGF (r = −0.420) and IGFBP-4 (r = −0.387) correlate to negative GCS scores, whereas TIMP-2 (r = 0.393) correlates to a positive GCS score. The 2 inflammatory cytokines identified, Eotaxin-3/CCL26 (r = −0.421) and GCP-2/CXCL6 (r = −0.340), both correlate to negative GCS. Asterisks above figure bars indicate statistical significance. One asterisk (*) indicates p value smaller than 0.1 (p < 0.1). Two asterisks (**) indicate p value smaller than 0.05 (p < 0.05).
Figure 2
Figure 2
Regression analysis of plasma cytokines correlated to GOS-E at 5–7 days after hemorrhagic stroke. Negative values correspond to lower GOS-E; positive values correspond to higher GOS-E. Four plasma cytokines, including anti-inflammatory angiogenin (r = 0.414) and osteopontin/SPP1 (r = 0.412) and pro-inflammatory NAP-2/CXCL7 (r = 0.405) and RANTES/CCL5 (r = 0.426), correlated to positive GOS-E scores. Asterisks above figure bars indicate statistical significance. One asterisk (*) indicates p value smaller than 0.1 (p < 0.1). Two asterisks (**) indicate p value smaller than 0.05 (p < 0.05).
Figure 3
Figure 3
Regression analysis of surface-bound EV cytokines correlated to GCS at 5–7 days after stroke. Six anti-inflammatory and 9 pro-inflammatory cytokines all show negative values corresponding to lower GCS. Asterisks above figure bars indicate statistical significance. One asterisk (*) indicates p value smaller than 0.1 (p < 0.1). Two asterisks (**) indicate p value smaller than 0.05 (p < 0.05). Three asterisks (***) indicate p value smaller than 0.02 (p < 0.02).
Figure 4
Figure 4
Regression analysis of surface-bound EV cytokines correlated to GOS-E (30+ day outcome) from blood samples taken at 5–7 days after stroke. Ten anti-inflammatory and 14 pro-inflammatory cytokines all show negative values corresponding to lower GOS-E. Asterisks above figure bars indicate statistical significance. One asterisk (*) indicates p value smaller than 0.1 (p < 0.1). Two asterisks (**) indicates p value smaller than 0.05 (p < 0.05).
Figure 5
Figure 5
Regression analysis of intra-EV cytokines (after stripping of EV membrane-bound/associated proteins) at 5–7 days after stroke correlated to GOS-E (30+ days after stroke). All 4 of the anti-inflammatory cytokines identified as significant or trending toward significance were correlated to negative GOS-E. Of the 11 pro-inflammatory cytokines identified as significant or trending toward significance, 10 show negative values corresponding to lower GOS-E; cytokine MIP-3 alpha/CCL20 was correlated to a positive GOS-E score (r = 0.302). Asterisks above figure bars indicate statistical significance. One asterisk (*) indicates p value smaller than 0.1 (p < 0.1). Two asterisks (**) indicate p value smaller than 0.05 (p < 0.05). Three asterisks (***) indicate p value smaller than 0.02 (p < 0.02).
Figure 6
Figure 6
Protein pathway enrichment analysis and protein–protein interactions of cytokines correlated to GCS and GOS-E were analyzed through the Metascape platform. EV cytokines identified as significant or trending toward significance were analyzed, and cytokines not identified were used as background subtraction. Pathway and protein–protein interactions are considered significant at ≤−2.0 Log10 (P) by the Metascape platform. Metascape analysis revealed significant interactions with EV surface and intra-EV cytokines correlated to GCS scores at 5–7 days after stroke, including the insulin-like growth factor receptor signaling pathway (Log10 (P) = −2.2) and its regulation (Log10 (P) = −2.2). EV surface and intra-EV cytokines that were correlated to GOS-E scores revealed interactions relating to the chronic inflammatory response (Log10 (P) = −3.0) and regulation of the chronic inflammatory response (Log10 (P) = −2.9). Sensory perception of pain was also identified (Log10 (P) = −2.9). Cytokines that were only identified as significant or trending toward significance within the plasma were also analyzed but did not yield any additional interactions through Metascape. EV surface and intra-EV cytokines that were correlated to both GCS and GOS-E (MDC/CCL2, M-CSF/CSF1, IL7, and MIG/CXCL9) generated common protein–protein interactions with enrichment clusters for influenza A (Log10 (P) = −2.25) and herpes simplex infection (Log10 (P) = −3.85). The regulation of phagocytosis (Log10 (P) = −3.3) was also correlated. Analysis of all cytokines from both EVs and plasma correlated to GCS and GOS-E did not yield any additional interactions.
Figure 7
Figure 7
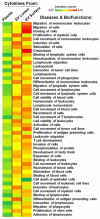
Ingenuity Pathway Analysis/Comparison Analysis shows enrichment of categories related to myeloid cell and lymphocyte movement/migration, homing, proliferation, induction, and activation. Patient and healthy donor cytokine array scores (plasma, EV lumen, EV surface) were analyzed to compare patient vs. healthy donor values (log(2) scale). Heat map was generated from activation z-scores yielding the top 50 diseases and biofunctions.
Figure 8
Figure 8
Ingenuity Core Analyses/Comparison Analyses generated networks (top 2 shown). The top 2 derived networks (out of 14; network scores from 25 down to 1) using IPA-extracted pathway data are shown. Network scores are derived from a right-tailed Fisher’s exact test, where scores as p-score = −log10 (p values) indicate probabilities of random protein associations based on focus molecules in a total gene group. Focus molecules are nodes from which networks initiate. Higher cytokine scores are indicated by red shading and lower values by green shading, relative to their representation in stroke patients vs. healthy donors. Proteins clustered within the top networks/associated functions as derived from IPA algorithms are shown as members of “interactomes”. Proteins from the arrays are labeled in larger bold font, with the background color described above. Solid lines (edges) = direct connections between/among proteins; dashed lines = indirect interactions. Dark blue lines = connections between array proteins; light blue lines = known interactions between array proteins and other proteins in the interactome derived from the Ingenuity Knowledgebase. (A) Network 1, “Cellular Movement; Hematological System Development & Function; Immune Cell Trafficking”. (B) Network 2, “Cell Signaling; Cell-Cell Signaling & Interaction; Cellular Growth & Proliferation”.

References

    1. Benjamin E.J., Blaha M.J., Chiuve S.E., Cushman M., Das S.R., Deo R., de Ferranti S.D., Floyd J., Fornage M., Gillespie C., et al. Heart disease and stroke statistics-2017 update: A report from the american heart association. Circulation. 2017;135:e146–e603. doi: 10.1161/CIR.0000000000000485. - DOI - PMC - PubMed
    1. Benjamin E.J., Muntner P., Alonso A., Bittencourt M.S., Callaway C.W., Carson A.P., Chamberlain A.M., Chang A.R., Cheng S., Das S.R., et al. Heart disease and stroke statistics-2019 update: A report from the american heart association. Circulation. 2019;139:e56–e528. doi: 10.1161/CIR.0000000000000659. - DOI - PubMed
    1. Anrather J., Iadecola C. Inflammation and stroke: An overview. Neurotherapeutics. 2016;13:661–670. doi: 10.1007/s13311-016-0483-x. - DOI - PMC - PubMed
    1. Doll D.N., Barr T.L., Simpkins J.W. Cytokines: Their role in stroke and potential use as biomarkers and therapeutic targets. Aging Dis. 2014;5:294–306. - PMC - PubMed
    1. Eming S.A., Krieg T., Davidson J.M. Inflammation in wound repair: Molecular and cellular mechanisms. J. Investig. Derm. 2007;127:514–525. doi: 10.1038/sj.jid.5700701. - DOI - PubMed