. 2021 Jul 28;22(15):8109.
doi: 10.3390/ijms22158109.

Keratin Profiling by Single-Cell RNA-Sequencing Identifies Human Prostate Stem Cell Lineage Hierarchy and Cancer Stem-Like Cells

Affiliations

Keratin Profiling by Single-Cell RNA-Sequencing Identifies Human Prostate Stem Cell Lineage Hierarchy and Cancer Stem-Like Cells

Wen-Yang Hu et al. Int J Mol Sci. .

Abstract

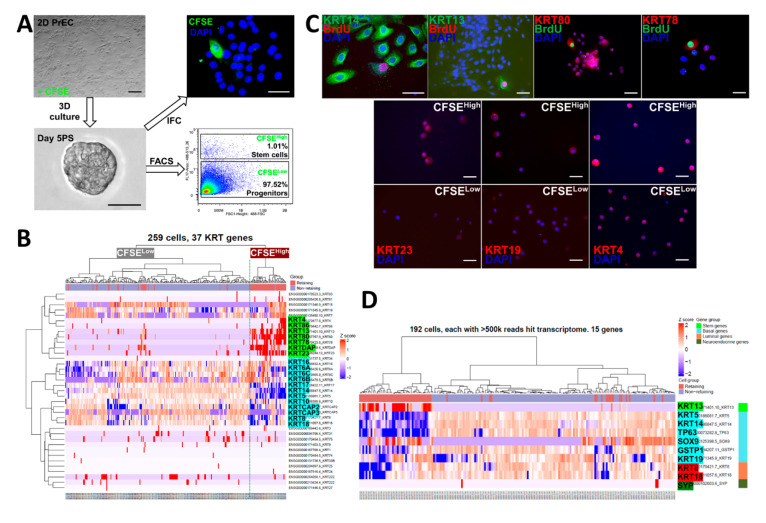
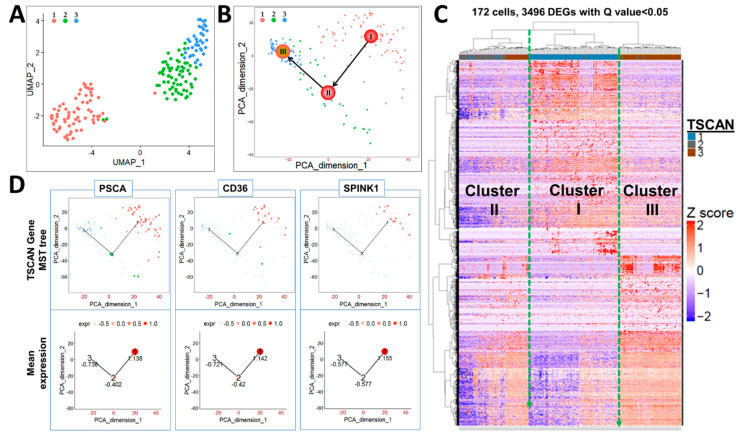
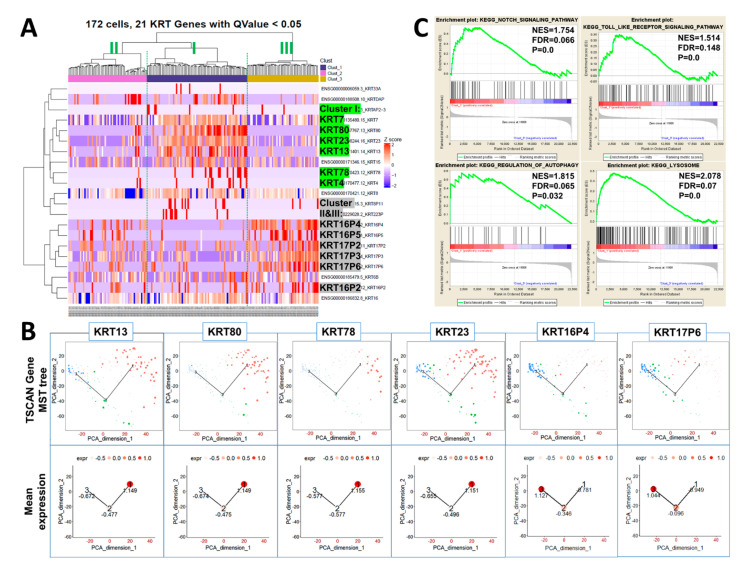
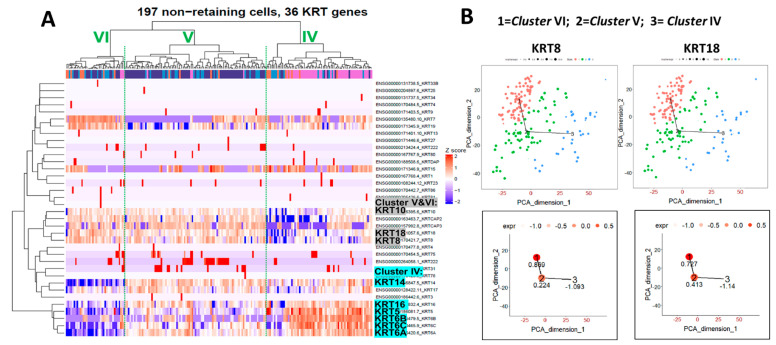
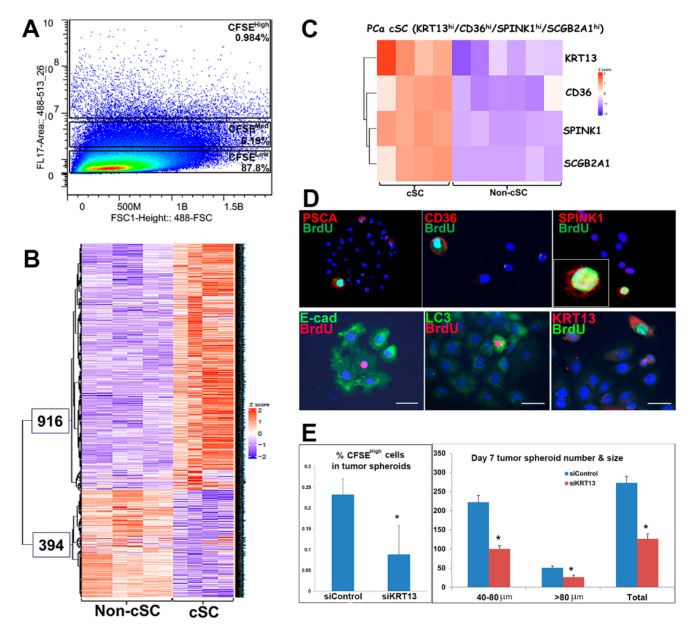
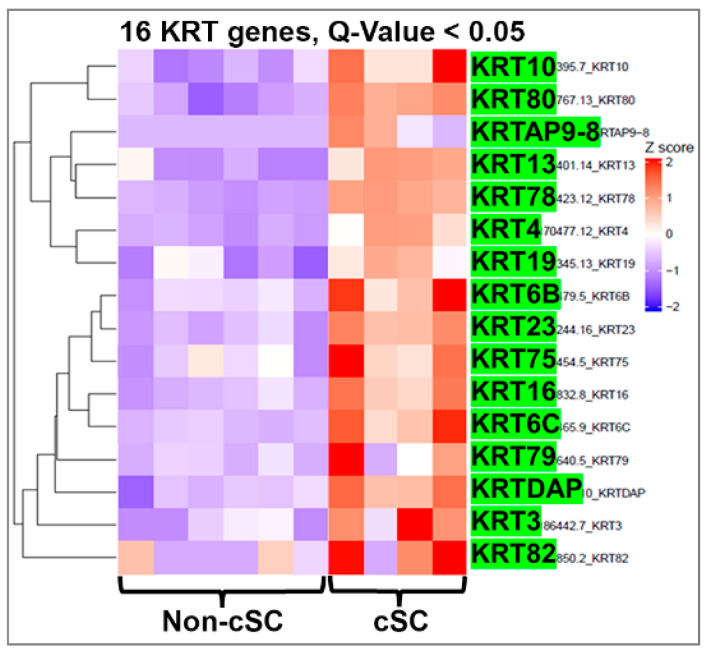
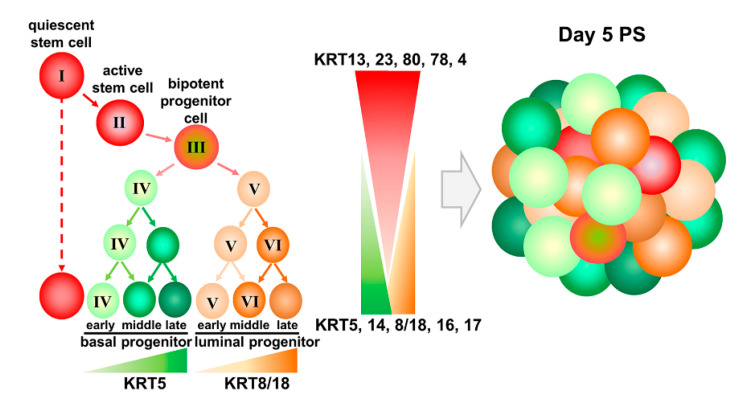
Single prostate stem cells can generate stem and progenitor cells to form prostaspheres in 3D culture. Using a prostasphere-based label retention assay, we recently identified keratin 13 (KRT13)-enriched prostate stem cells at single-cell resolution, distinguishing them from daughter progenitors. Herein, we characterized the epithelial cell lineage hierarchy in prostaspheres using single-cell RNA-seq analysis. Keratin profiling revealed three clusters of label-retaining prostate stem cells; cluster I represents quiescent stem cells (PSCA, CD36, SPINK1, and KRT13/23/80/78/4 enriched), while clusters II and III represent active stem and bipotent progenitor cells (KRT16/17/6 enriched). Gene set enrichment analysis revealed enrichment of stem and cancer-related pathways in cluster I. In non-label-retaining daughter progenitor cells, three clusters were identified; cluster IV represents basal progenitors (KRT5/14/6/16 enriched), while clusters V and VI represent early and late-stage luminal progenitors, respectively (KRT8/18/10 enriched). Furthermore, MetaCore analysis showed enrichment of the "cytoskeleton remodeling-keratin filaments" pathway in cancer stem-like cells from human prostate cancer specimens. Along with common keratins (KRT13/23/80/78/4) in normal stem cells, unique keratins (KRT10/19/6C/16) were enriched in cancer stem-like cells. Clarification of these keratin profiles in human prostate stem cell lineage hierarchy and cancer stem-like cells can facilitate the identification and therapeutic targeting of prostate cancer stem-like cells.

Keywords: RNA-seq; differentiation; keratin; lineage hierarchy; prostate cancer; single cell; stem cells.


Conflict of interest statement

The authors declare no conflict of interest.

Figures

Figure 1
Figure 1
Two groups of differentially expressed keratin genes in CFSEHigh vs. CFSELow day 5 prostasphere cells. (A) Normal primary prostate epithelial cells (PrEC) pre-labeled with CFSE were 3D cultured (5 days) to form prostaspheres (PS), followed by FACS to separate CFSEHigh stem-like cells (1.01%) from CFSELow progenitor cells (97.52%). Scale bar = 50 µm. (B) Heatmap clustering of Fluidigm C1 captured single-cell RNA-seq of prostasphere cells revealed enrichment of KRT13, 23, 80, 78, 86, and 4 in CFSEHigh prostate stem-like cells (89 cells), while KRT6, 17, 14, 5, 8, and 18 were enriched in CFSELow progenitor cells (170 cells). (C) Top, Immunostaining confirmed the colocalization of keratins 13, 80, and 78 in BrdU label retaining prostasphere cells (pink) and keratin 14 localization in non-labeled progenitor cells. Bottom, FACS isolated CFSEHigh prostate stem-like cells immunostained for keratin 23, 19, while CFSELow progenitor cells did not. Scale bar = 50 µm. (D) Single-cell RNA-seq of CFSE labeled prostaspheres followed by heatmap clustering using selected genes for stem, basal, luminal, and neuroendocrine cells showed enrichment of stem cell marker gene KRT13 in CFSEHigh prostate stem cells, while basal marker genes KRT5, KRT14, TP63, GSTP1, and KRT19, luminal genes KRT8/18, and neuroendocrine gene SYP were enriched in CFSELow prostate progenitor cells. SOX9 was uniquely enriched in CFSEHigh cells and a subpopulation of CFSELow cells.
Figure 2
Figure 2
Single-cell RNA-seq of CFSEHigh cells revealed three subpopulations of cells. Data from Fluidigm C1 single-cell RNA-seq of CFSEHigh isolated prostasphere cells was analyzed by UMAP (A) and TSCAN (B) principal component analyses, which identified three major cell clusters that were further confirmed by unsupervised heatmap clustering (C). CFSEHigh cell hierarchical clustering (I (1) → II (2) → III (3)) was ordered by MST-based pseudo-time reconstruction to mimic true biological time, identifying cells in cluster I as originating cells which yield cluster II that then yield cluster III (labeled in B). (D) Known stemness genes PSCA, CD36, and SPINK1 are enriched in cluster I (1) as compared to clusters II (2) & III (3), which is demarcated by a circle size (top) that represents gene expression levels that are relatively quantified at the bottom.
Figure 3
Figure 3
Differentially expressed keratin genes in CFSEHigh prostasphere cells are sufficient to distinguish cells in cluster I, cluster II, and cluster III. (A) In CFSEHigh cells, KRT13, 23, 80, 78, and 4 are enriched in cluster I quiescent stem cells and have low expression in clusters II and III. KRT16, 17, and 6 genes are enriched in cluster III, whereas cluster II has low expression levels of this keratin gene set. (B) TSCAN analysis documents enrichment of KRT13, 80, 78, and 23 in cluster I (1) quiescent stem cells and of KRT16P4 and 17P6 in cluster III (3) cells demarcated by the circle size (top) which is directionally relatively quantified at bottom. (C) GSEA analysis identifies enrichment of stem cell-related Notch, Toll-like receptor, autophagy, and lysosome pathways in cluster I (1) vs. cluster III (3).
Figure 4
Figure 4
Keratin profiles of differentially expressed keratin genes in non-label retaining prostasphere cells. (A) Single-cell RNA-seq of the sorted CFSELow prostasphere cells with subsequent keratin gene heatmap clustering reveals three subpopulations of progenitor cells: cluster IV (right), cluster V (middle), and cluster VI (left). Cluster IV is enriched in KRT14, 5, 16, and 6, indicating a basal progenitor cell lineage. Clusters V and VI are enriched in KRT8, 18, and 10, indicating a luminal cell lineage. (B) TSCAN analysis of KRT8 and KRT18 in CFSELow cells suggests a relationship between cluster V (2) and VI (1), but not cluster IV (3). Relative gene expression levels are noted numerically for each cluster.
Figure 5
Figure 5
RNA-seq reveals differentially expressed genes in cancer stem-like cells and vs. non-stem cells in tumor spheroids of patient PCa specimens. (A) Cancer stem-like cells (cSC; (CFSEHigh) and non-cSC (CFSElow) from spheroids of three PCa specimens were separated by FACS. (B) Following RNA-seq of the sorted cells, unsupervised transcriptome profiling identified 1310 differentially expressed genes (Q value < 0.05); 916 enriched in cSCs and 394 enriched in non-cSCs. Sequencing of the non-cSC fractions from three patients were performed in duplicate, highlighting data consistency. For the cSC fraction, one patient sample was sequenced in duplicate, and the other two were sequenced in singlet. (C) Heatmap of CD36, KRT13, SPINK1, and SCGB2A1 expression shows enrichment in cSCs vs. non-cSCs. (D) ICC documents that PSCA, CD36, and SPINK1 proteins (red) colocalized with BrdU-labeled (green) cSC cells in the 3D cultured tumor spheroids. Similar to normal prostate stem cells, the cSCs exhibit decreased E-cadherin, increased LC3 and KRT13 (Hu et al., 2017), which together identifies unique features of PCa-derived cancer stem-like cells. (E) siRNA knockdown of KRT13 significantly decreased the percentage of CFSEHigh cells in tumor spheroids (left) and tumor spheroid formation (right). * p < 0.05 vs. siControl, N = 3.
Figure 6
Figure 6
Heatmap clustering of keratin genes in PCa stem-like cells (cSCs) and the non-stem cells in tumor spheroids from PCa specimens. RNA-seq followed by heatmap clustering analysis shows that in addition to normal stem cell-enriched keratins (KRT13, 23, 80, 78, 4), KRT10, 19, 6C, 75, 16, 79, 3, and 82 also were enriched in cancer stem-like cells relative to expression levels in the non-cSC population. Q-value < 0.05.
Figure 7
Figure 7
Keratin profiling in tumor spheroids using single-cell RNA-seq identifies cancer stem-like cells. (A,B) Uniform manifold approximation and projection (UMAP) clustering defined five clusters in cancer cells, identifying cluster 2 as cancer stem-like cells enriched for stemness markers, including KRT13. (C) Keratin gene profiling by heatmap and (D) dot-plot analyses identified a group of keratin genes enriched in the cluster 2 cancer stem-like cells.
Figure 8
Figure 8
Model of prostate epithelial stem cell hierarchy based upon keratin profiles. Quiescent prostate stem cells (cluster I: enriched for KRT13, 23, 80, 78, 4) become active stem cells (cluster II), with increased expression of KRT 16, 17, and 6 that generate bipotent progenitor cells (cluster III) and further give rise to committed unique potent basal progenitors (cluster IV: enriched for KRT5, 14, 6, 16), as well as early (cluster V) and late-stage (cluster VI) luminal progenitors (enriched for KRT8, 18, 10).

References

    1. Presnell S.C., Petersen B., Heidaran M. Stem cells in adult tissues. Semin. Cell Dev. Biol. 2002;13:369–376. doi: 10.1016/S1084952102000939. - DOI - PubMed
    1. Smith S., Neaves W., Teitelbaum S. Adult Versus Embryonic Stem Cells: Treatments. Science. 2007;316:1422–1423. doi: 10.1126/science.316.5830.1422b. - DOI - PubMed
    1. De Marzo A.M., Nelson W.G., Meeker A.K., Coffey D.S. Stem cell features of benign and malignant prostate epithelial cells. J. Urol. 1998;160:2381–2392. doi: 10.1016/S0022-5347(01)62196-7. - DOI - PubMed
    1. Goldstein A.S., Lawson D.A., Cheng D., Sun W., Garraway I.P., Witte O.N. Trop2 identifies a subpopulation of murine and human prostate basal cells with stem cell characteristics. Porc. Natl. Acad. Sci. USA. 2008;105:20882–20887. doi: 10.1073/pnas.0811411106. - DOI - PMC - PubMed
    1. Prins G.S., Lindgren M. Accessory sex glands in the male. In: Plant T.M., Zeleznik A.J., editors. Knobil and Neill’s Physiology of Reproduction. 4th ed. Academic Press; Cambridge, MA, USA: 2015. pp. 773–804.