. 2021 Jul 29;22(15):8130.
doi: 10.3390/ijms22158130.

Relative Contribution of Different Mitochondrial Oxidative Phosphorylation Components to the Retinal Pigment Epithelium Barrier Function: Implications for RPE-Related Retinal Diseases

Affiliations

Relative Contribution of Different Mitochondrial Oxidative Phosphorylation Components to the Retinal Pigment Epithelium Barrier Function: Implications for RPE-Related Retinal Diseases

Michael H Guerra et al. Int J Mol Sci. .

Abstract

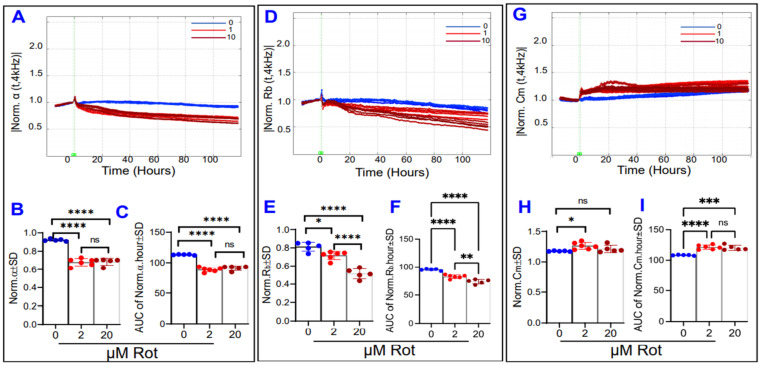
Disruption of retinal pigment epithelial (RPE) barrier integrity is involved in the pathology of several blinding retinal diseases including age-related macular degeneration (AMD) and diabetic retinopathy (DR), but the underlying causes and pathophysiology are not completely well-defined. Mitochondria dysfunction has often been considered as a potential candidate implicated in such a process. In this study, we aimed to dissect the role of different mitochondrial components; specifically, those of oxidative phosphorylation (OxPhos), in maintaining the barrier functionality of RPE. Electric cell-substrate impedance sensing (ECIS) technology was used to collect multi-frequency electrical impedance data to assess in real-time the barrier formation of the RPE cells. For this purpose, the human retinal pigment epithelial cell line-ARPE-19-was used and treated with varying concentrations of specific mitochondrial inhibitors that target different steps in OxPhos: Rotenone for complex I (the largest protein complex in the electron transport chain (ETC)); oligomycin for ATP synthase; and carbonyl cyanide-p-trifluoromethoxyphenyl hydrazone (FCCP) for uncoupling ATP synthesis from the accompanying ETC. Furthermore, data were modeled using the ECIS-Zθ software to investigate in depth the effects of these inhibitors on three separate barrier parameters: cell-cell interactions (Rb), cell-matrix interactions (α), and the cell membrane capacitance (Cm). The viability of ARPE-19 cells was determined by lactate dehydrogenase (LDH) Cytotoxicity Assay. The ECIS program's modeling demonstrated that FCCP and thus OxPhos uncoupling disrupt the barrier function in the ARPE-19 cells across all three components of the total resistance (Rb, α, and Cm) in a dose-dependent manner. On the other hand, oligomycin and thus ATP synthase inhibition mostly affects the ARPE-19 cells' attachment to their substrate evident by a significant decrease in α resistance in a dose-dependent manner, both at the end and throughout the duration of the experiment. On the contrary, rotenone and complex I inhibition mostly affect the ARPE-19 paracellular resistance Rb in a dose-dependent manner compared to basolateral resistance α or Cm. Our results clearly demonstrate differential roles for different mitochondrial components in maintaining RPE cell functionality in which uncoupling of OxPhos is a major contributing factor to the disruption barrier function. Such differences can be used in investigating gene expression as well as for screening of selective agents that improve the OxPhos coupling efficiency to be used in the therapeutic approach for treating RPE-related retinal diseases.

Keywords: AMD; ARPE-19; DR; ECIS; RPE; mitochondria; oxidative phosphorylation; uncouplers.


Conflict of interest statement

The authors declare no conflict of interest.

Figures

Figure 1
Figure 1
Comparative Effects of different mitochondrial components on RPE barrier functionality using real-time bioimpedance analysis. Effects of FCCP, oligomycin (oligo), and rotenone (Rot) on the barrier function of ARPE-19 cells as measured in real-time by the ECIS system. Three-dimensional plots of Log Normalized Impedance (Z) as a function of both time and of log of the frequency of the 1 µA alternating current (AC) applied to the ECIS electrode. Treatments were applied to the cell groups at T = 0, which was 94 h after cells were placed onto the ECIS electrode, a point at which the cells had already become confluent. Impedance across the cells was measured for 100 h after addition of either control vehicle (A), FCCP at concentrations of 1 µM or 10 µM ((B,C), respectively), oligomycin at concentrations of 1 µM or 10 µM ((D,E), respectively), or rotenone at concentrations of 2 µM or 20 µM ((F,G), respectively). Z0, the impedance at T0, was normalized to a value of 1, and all other impedance values were calculated as the ratio Zt/Z0. AC current frequencies used were 250, 500, 1000, 2000, 4000, 8000, 16,000, 32,000, and 64,000 Hz. Abbreviations: Z, impedance; Norm, normalized; FCCP, trifluoromethoxy carbonylcyanide phenylhydrazone; Oligo, oligomycin; Rot, rotenone; Freq, frequency; Zt, impedance at time t; Z0, impedance at time T = 0. Data shown are representative three-dimensional plots of 5–6 independent biological replicates per group.
Figure 2
Figure 2
Real-time spreading of ARPE-19 cells in a state of OxPhos uncoupling. (A) Normalized capacitance across ARPE-19 cells vs. time, measured at an AC current frequency of 64,000 Hz. Treatments were applied at time T = 0. ARPE-19 cell groups were control, FCCP 1 µM treatment, and FCCP 10 µM treatment. Capacitance was measured from time of placement onto electrode to 100 h after treatment application, and capacitance was normalized to T = 0. (B) Bar chart representation of the normalized capacitance of each of the cell groups at time T = 100 h, the experiment’s endpoint. (C) Bar chart representation of the area under the normalized capacitance curve of the ARPE-19 cell groups for the interval T = 0–100 h. Abbreviations: AUC, area under the curve; Norm, normalized. Data shown are the mean ± SD of 5–6 independent biological replicates per group. p values are **** p ≤ 0.0001.
Figure 3
Figure 3
Real-time spreading of ARPE-19 cells under ATP synthase inhibition. (A) Normalized capacitance across ARPE-19 cells vs. time, measured at an AC current frequency of 64,000 Hz. Treatments were applied at time T = 0. ARPE-19 cell groups were control, 1 µM, and 10 µM oligomycin treatment. Capacitance was measured from time of placement onto electrode to 100 h after treatment application, and capacitance values were normalized to that at T = 0. (B) Bar chart representation of the normalized capacitance of each of the cell groups at time T = 100 h, the experiment’s endpoint. (C) Bar chart representation of the area under the normalized capacitance curve of the ARPE-19 cell groups for the interval T = 0–100 h. Compared to the control, the oligomycin 10 µM group affects cell spreading behavior on average across treatment duration, but no effect remains by the end of the experiment. Abbreviations: AUC, area under the curve; Norm, normalized; ns, no significance. Data shown are the mean ± SD of 5–6 independent biological replicates per group. p values are **** p ≤ 0.0001.
Figure 4
Figure 4
Real-time spreading of ARPE-19 cells under inhibition of complex I of the electron transport chain. (A) Normalized capacitance across ARPE-19 cells vs. time, measured at an AC current frequency of 64,000 Hz. Treatments were applied at time T = 0. ARPE-19 cell groups were the control, rotenone 2 µM treatment, and rotenone 20 µM treatment. Capacitance was measured from time of placement onto electrode to 100 h after treatment application, and capacitance values were normalized to that at T = 0. (B) Bar chart representation of the normalized capacitance of each of the cell groups at time T = 100 h, the experiment’s endpoint. (C) Bar chart representation of the area under the normalized capacitance curve of the ARPE-19 cell groups for the interval T = 0–100 h. Both doses of rotenone disrupted cell spreading during the experiment. Abbreviations: AUC, area under the curve. Data shown are the mean ± SD of 5–6 independent biological replicates per group. p values are * p ≤ 0.05, ** p ≤ 0.01, *** p ≤ 0.001, and **** p ≤ 0.0001.
Figure 5
Figure 5
Real-time measurement of the total resistance across the ARPE-19 cells in a state of OxPhos uncoupling. (A) Plot of normalized resistance vs. time for the cell groups of the control, FCCP 1 µM, and FCCP 10 µM. Resistance was measured from the time the cells were placed on the ECIS electrode to the time 100 h after treatment application. Resistance was normalized to T = 0, the time of treatment application. (B) Bar chart representation of each group’s normalized resistance at the endpoint of the experiment, T = 100 h. Comparison between all three groups displays a significant difference. (C) Bar chart representation of the areas under the normalized resistance curve for the interval T = 0–100 h. Using AUC, all three groups demonstrate a significant difference from each other. Abbreviations: AUC, area under the curve. Data shown are the mean ± SD of 5–6 independent biological replicates per group. p values are **** p ≤ 0.0001.
Figure 6
Figure 6
Real-time measurement of the total resistance across the ARPE-19 cells in a state of inhibited ATP synthase. (A) Plot of normalized resistance vs. time for the cell groups of the control, 1 µM, and 10 µM Oligomycin (Oligo). Resistance was normalized to T = 0, the time of treatment application. (B) Bar chart representation of each group’s normalized resistance at the endpoint of the experiment, T = 100 h. Comparison between all three groups displays a significant difference. (C) Bar chart representation of the areas under the normalized resistance curve for the interval T = 0–100 h. Using AUC, all three groups demonstrate a significant difference from each other. Abbreviations: Norm, normalized; AUC, area under the curve. Data shown are the mean ± SD of 5–6 independent biological replicates per group. p values are ** p ≤ 0.01 and **** p ≤ 0.0001.
Figure 7
Figure 7
Real-time measurement of the total resistance across the ARPE-19 cells in a state of ETC complex I inhibition. (A) Plot of normalized resistance vs. time for the cell groups of the control, 2 µM and 20 µM rotenone (Rot). Resistance was measured from the time the cells were placed on the ECIS electrode to the time 100 h after treatment application. Resistance was normalized to T = 0, the time of treatment application. (B) Bar chart representation of each group’s normalized resistance at the endpoint of the experiment, T = 100 h. Comparison between all three groups displays a significant difference. (C) Bar chart representation of the areas under the curve (AUC) of normalized resistance for the interval T = 0–100 h. Using AUC, all three groups demonstrate a significant difference from each other, and this AUC difference between the groups demonstrates a smaller p-value of difference between the rotenone group compared to that found in the endpoint comparison in B. Abbreviations: Norm, normalized; AUC, area under the curve. Data shown are the mean ± SD of 5–6 independent biological replicates per group. p values are * p ≤ 0.05 and **** p ≤ 0.0001.
Figure 8
Figure 8
Real-time measurement of α, Rb, and Cm in ARPE-19 cells in a state of OxPhos uncoupling. (A) Normalized α measured at 4000 Hz vs. time (T) for the interval from the start of treatment at T = 0–100 h after initiation of treatment with an FCCP concentration of 0, 1, or 10 µM. The α curves for the FCCP 10 µM cell group all abruptly end around the 5.1-h mark, as this is the time when the Rb curves for the FCCP 10 µM group reach zero. The ECIS software is unable to calculate a positive integer for α at times when Rb has a value of zero. By this 5.1-h mark, the endpoint α values and the area under the curve (AUC) of α are significantly different between each FCCP group and control. These data are not shown in the figure. (B) End-point values for the control and FCCP 1 µM groups normalized α at the end of the experiment, where FCCP 1 µM has decreased from the control. (C) AUC of normalized α for the interval T = 0–100 h for the groups FCCP 0 (Control) and 1 µM. Throughout the total experiment, the FCCP 1 µM group demonstrates a difference in behavior from the control group. (D) Normalized Rb measured at 4000 Hz vs. time (T) for the interval from the addition of treatment at T = 0 to 100 h afterward. The Rb curves for the FCCP 10 µM cell group reach zero around the 5.1 h mark. (E) Rb experiment endpoint comparisons for all three groups, where a dose-dependent effect on end Rb is seen. (F) AUC of normalized Rb for the time from treatment start to experiment end. FCCP treatment demonstrates a dose-dependent reduction in Rb. (G) Normalized Cm measured at 4000 Hz vs. time (T) for the interval from the start of treatment at T = 0 to 100 h after initiation of treatment with an FCCP concentration of 0, 1, or 10 µM. The Cm curves for the FCCP 10 µM cell group all abruptly end around the 5.1 h mark, as this is the time when the Rb curves for the FCCP 10 µM group reach zero. The ECIS software is unable to calculate a positive integer for Cm at times when Rb has a value of zero. At this 5.1 h mark, the endpoint Cm values and the area under the curve (AUC) of Cm are significantly different between FCCP 10 µM and FCCP 0 but not between FCCP 10 µM and Control. These data are not shown in the figure. (H) Comparison of Cm at the experimental endpoint of T = 100 h for the control and FCCP 1 µM groups, where FCCP 1 µM has resulted in an endpoint difference from FCCP 0. (I) AUC of normalized Cm for the interval T = 0–100 h for the groups FCCP 0 and 1 µM. Throughout the experiment, the FCCP 1 µM group demonstrates a difference in Cm behavior from the control group. Statistical comparison analysis in (B,C,H,I) done using two-tailed unpaired t-tests. Statistical comparison analysis in (E,F) done using the ANOVA test followed by Tukey post hoc test to make the comparisons. Abbreviations: Norm, normalized; AUC, area under the curve; ns, no significance. Data shown are the mean ± SD of 5–6 independent biological replicates per group. p values are * p ≤ 0.05, ** p ≤ 0.01, and **** p ≤ 0.0001.
Figure 9
Figure 9
Real-time measurement of α, Rb, and Cm in ARPE-19 cells in a state of ATP synthase inhibition. (A) Normalized α measured at 4000 Hz vs. time (T) from the start of treatment at T = 0 to 100 h after initiation of treatment with an oligomycin concentration of 0, 1, or 10 µM. (B) α values at the experimental end T = 100 h, both oligomycin (Oligo) groups demonstrate differences from control (Oligo 0). (C) Areas under the curve (AUC) of normalized α for the time from treatment start to experiment end. By the end of the experiment, ATP synthase inhibition has resulted in significant reductions to α in a dose-dependent fashion. (D) Normalized Rb measured at 4000 Hz vs. time (T) for the interval from the start of treatment at T = 0 to 100 h after initiation of treatment. Rb values at T = 100 h, where the 10 µM but not the 1 µM Oligo group had an effect. (E) Rb values at the experimental end T = 100 h, both Oligo groups demonstrate no differences from control. (F) AUC of normalized Rb for the time T = 0–100 h. Oligomycin treatment results in a reduction in Rb at high doses, and there is no significant change to Rb at low doses. (G) Normalized Cm measured at 4000 Hz vs. time (T). (H) Cm values measured at T = 100 h, where only the high dose oligomycin had an effect on endpoint Cm. (I) AUC of normalized Cm for treatment interval. The behavior of the oligomycin 1 µM group throughout the entire experiment time was slightly different from control (Oligo 0), while the behavior of the 10 µM Oligo group did not differ over this time frame. Abbreviations: Norm, normalized; AUC, area under the curve; ns, no significance. Data shown are the mean ± SD of 5–6 independent biological replicates per group. p values are * p ≤ 0.05, *** p ≤ 0.001, and **** p ≤ 0.0001.
Figure 10
Figure 10
Real-time measurement of α, Rb, and Cm in ARPE-19 cells in a state of ETC complex I inhibition. (A) Normalized α measured at 4000 Hz vs. time (T) from the start of treatment at T = 0 to 100 h after initiation of treatment with a rotenone (Rot) concentration of 0, 2, or 20 µM. (B) Comparison of α values measured at T = 100 h, the end of the experiment. Both low and high-dose Rot had the same effect on α endpoints. (C) Areas under the curve (AUC) of normalized α for the time from treatment start to experiment end. By the end of the experiment, complex I inhibition resulted in significant reductions to α in a non-dose-dependent fashion. (D) Normalized Rb measured at 4000 Hz vs. time (T) for the interval T = 0–100 h. (E) Comparison of Rb values at T = 100 h. Rot exerted a dose-dependent effect on endpoint Rb. (F) Areas under the curve of normalized Rb for the time T = 0–100 h. Rot treatment also had a dose-dependent effect on the Rb behavior throughout the experiment. (G) Normalized Cm measured at 4000 Hz vs. time (T) from T = 0–100 h. (H) Comparison of Cm values measured at the experimental end, where only low dose changed the Cm. (I) Areas under the curve of normalized Cm for the time T = 0–100 h. Both Rot treatments resulted in Cm alterations compared to control within the 100 h after treatment, though these Rot groups did not differ from each other. Abbreviations: Norm, normalized; AUC, area under the curve; ns, no significance. Data shown are the mean ± SD of 5–6 independent biological replicates per group. p values are * p ≤ 0.05, ** p ≤ 0.01, *** p ≤ 0.001, and **** p ≤ 0.0001.
Figure 11
Figure 11
Effects of mitochondrial inhibitors on ARPE-19 cell viability. Lactate dehydrogenase (LDH) cytotoxicity assays were done at T = 24, 48, and 72 h after initiation of treatment. (A) LDH release of the cell groups 24 h after experiment start. Only rotenone 20 µM is associated with increased LDH release. (B) LDH release at T = 48 h. At this time, the FCCP 10 µM and oligomycin 10 µM have joined the rotenone 20 µM with associated increased LDH release. (C) LDH release of the cell groups at 72 h. Abbreviations: FCCP, trifluoromethoxy carbonylcyanide phenylhydrazone; Oligo, oligomycin; Rot, rotenone; ns, no significance. Data shown are the mean ± SD of 5–6 independent biological replicates per group. p values are ** p ≤ 0.01 and **** p ≤ 0.0001.
Figure 12
Figure 12
Effects of mitochondrial inhibitors on ARPE-19 cells total resistance at experimental midpoint T = 24 h. (A) Midpoint resistance at T = 24 h for the ARPE-19 cells treated with FCCP. After 24 h of treatment with FCCP, there is a dose-dependent effect of FCCP on the midpoint resistance. (B) Area under the curve (AUC) of total resistance for the cells treated with FCCP, on the interval T = 0–24 h. Like the 24 h midpoint resistance for the FCCP-treated cells, there is a dose-dependent effect. (C) Midpoint resistance at T = 24 h for the ARPE-19 cells-treated with oligomycin. After 24 h of treatment with oligomycin, there is a dose-dependent decrease in the resistance. (D) Area under the curve (AUC) of total resistance for the cells treated with oligomycin, on the interval T = 0–24 h. The AUC comparison shows the same dose-dependent effect of oligomycin that the endpoint comparison does. (E) Midpoint resistance at T = 24 h for the ARPE-19 cells treated with rotenone. After 24 h of treatment with rotenone, both doses have reduced resistance to the same level. (F) Area under the curve (AUC) of total resistance for the cells treated with rotenone, on the interval T = 0–24 h. Abbreviations: Norm, normalized; FCCP, trifluoromethoxy carbonylcyanide phenylhydrazone; Oligo, oligomycin; Rot, rotenone; ns, no significance. Data shown are the mean ± SD of 5–6 independent biological replicates per group. p values are ** p ≤ 0.01 and **** p ≤ 0.0001.

References

    1. Masland R.H. The fundamental plan of the retina. Nat. Neurosci. 2001;4:877–886. doi: 10.1038/nn0901-877. - DOI - PubMed
    1. Boulton M., Dayhaw-Barker P. The role of the retinal pigment epithelium: Topographical variation and ageing changes. Eye. 2001;15:384–389. doi: 10.1038/eye.2001.141. - DOI - PubMed
    1. Bok D. The retinal pigment epithelium: A versatile partner in vision. J. Cell Sci. 1993;1993:189–195. doi: 10.1242/jcs.1993.Supplement_17.27. - DOI - PubMed
    1. To C.-H., Hodson S.A. The glucose transport in retinal pigment epithelium is via passive facilitated diffusion. Comp. Biochem. Physiol. Part A. 1998;121:441–444. doi: 10.1016/S1095-6433(98)10156-3. - DOI - PubMed
    1. Detrick B., Hooks J.J. Immune regulation in the retina. Immunol. Res. 2010;47:153–161. doi: 10.1007/s12026-009-8146-1. - DOI - PMC - PubMed

MeSH terms

Substances