

Effects of Urolithin A on Mitochondrial Parameters in a Cellular Model of Early Alzheimer Disease
- PMID: 34361099
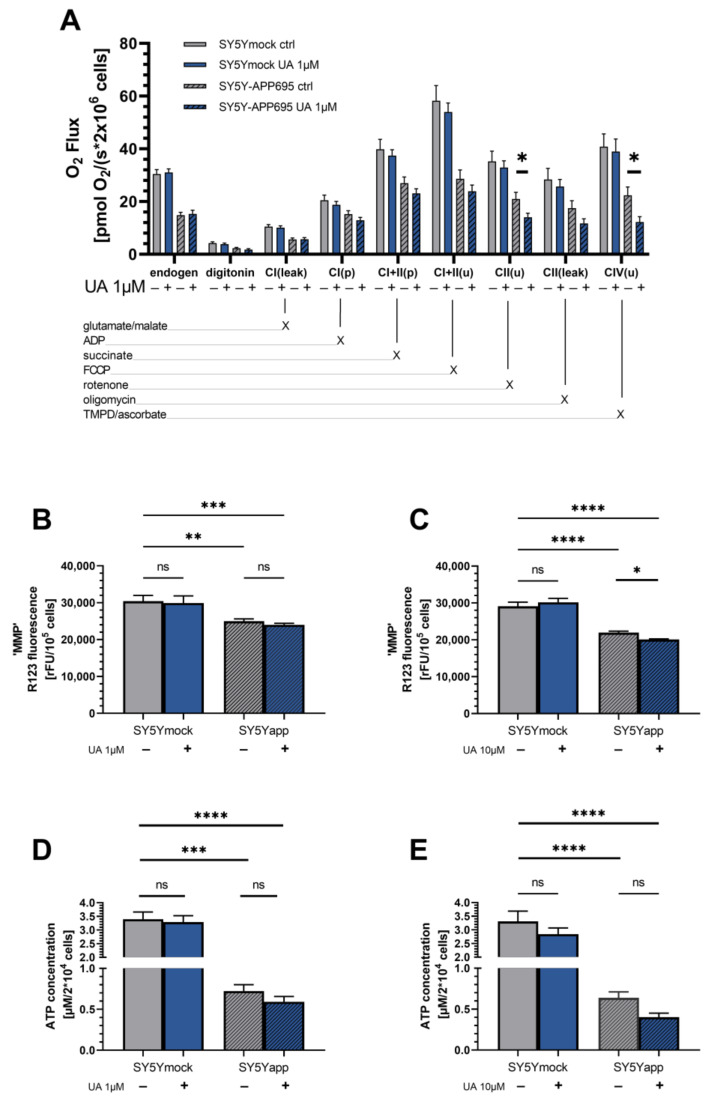
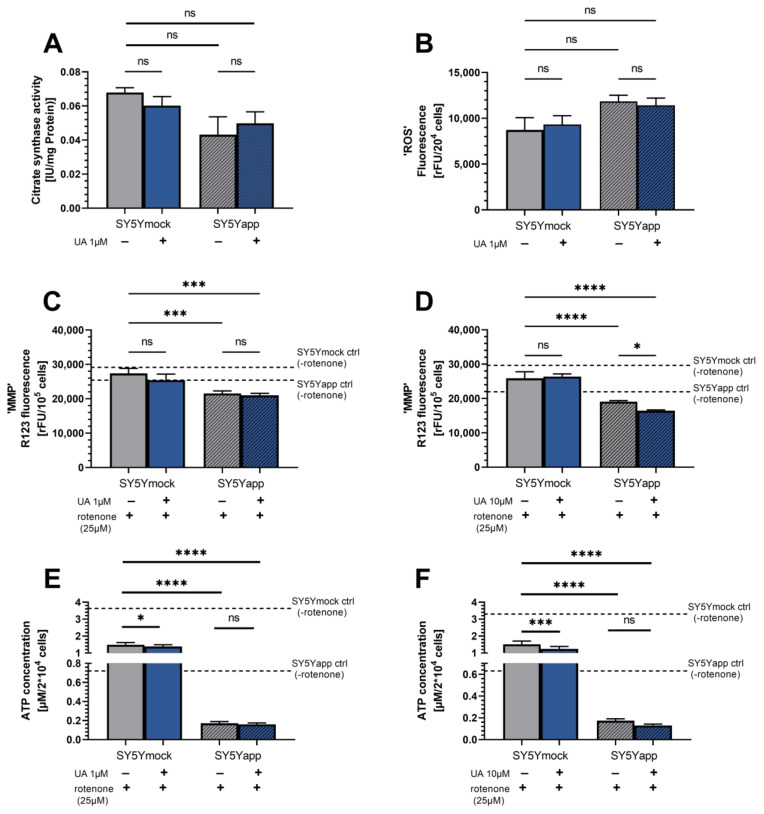
- PMCID: PMC8347929
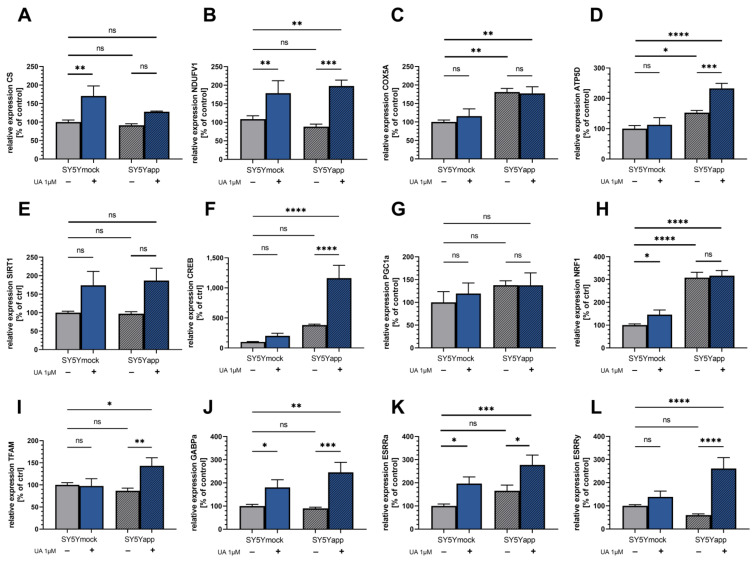
- DOI: 10.3390/ijms22158333
Effects of Urolithin A on Mitochondrial Parameters in a Cellular Model of Early Alzheimer Disease
Abstract
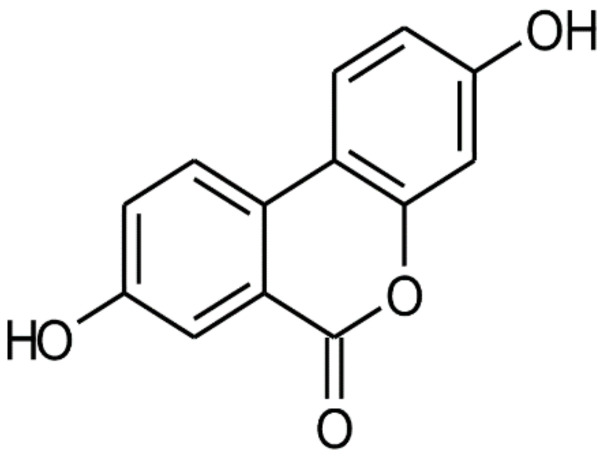
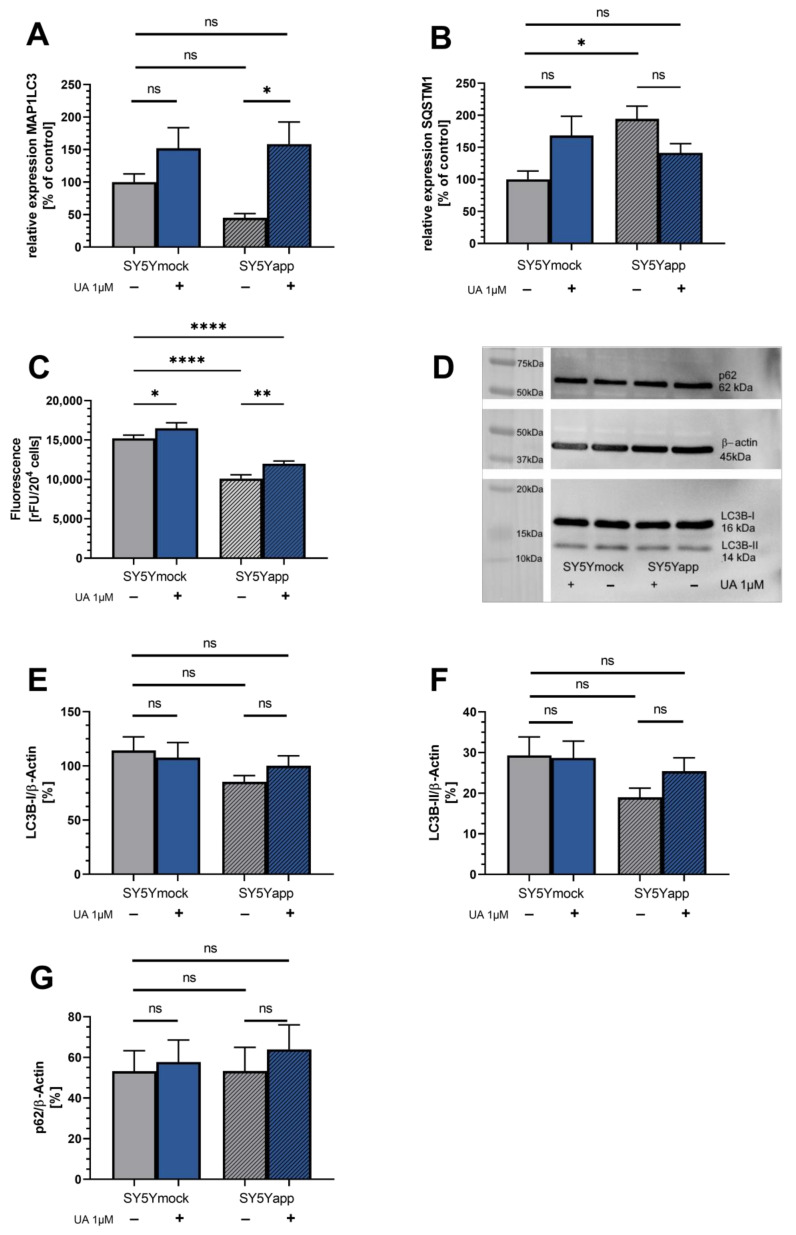
(1) Background: Ellagitannins are natural products occurring in pomegranate and walnuts. They are hydrolyzed in the gut to release ellagic acid, which is further metabolized by the microflora into urolithins, such as urolithin A (UA). Accumulation of damaged mitochondria is a hallmark of aging and age-related neurodegenerative diseases. In this study, we investigated the neuroprotective activity of the metabolite UA against mitochondrial dysfunction in a cellular model of early Alzheimer disease (AD). (2) Methods: In the present study we used SH-SY5Y-APP695 cells and its corresponding controls (SH-SY5Ymock) to assess UA's effect on mitochondrial function. Using these cells we investigated mitochondrial respiration (OXPHOS), mitochondrial membrane potential (MMP), adenosine triphosphate (ATP) production, autophagy and levels of reactive oxygen species (ROS) in cells treated with UA. Furthermore, we assessed UA's effect on the expression of genes related to mitochondrial bioenergetics, mitochondrial biogenesis, and autophagy via quantitative real-time PCR (qRT-PCR). (3) Results: Treatment of SH-SY5Y-APP695 cells suggests changes to autophagy corresponding with qRT-PCR results. However, LC3B-I, LC3B-II, and p62 levels were unchanged. UA (10 µM) reduced MMP, and ATP-levels. Treatment of cells with UA (1 µM) for 24 h did not affect ROS production or levels of Aβ, but significantly increased expression of genes for mitochondrial biogenesis and OXPHOS. Mitochondrial Transcription Factor A (TFAM) expression was specifically increased in SH-SY5Y-APP695. Both cell lines showed unaltered levels of peroxisome proliferator-activated receptor gamma coactivator 1-alpha (PGC1α), which is commonly associated with mitochondrial biogenesis. Results imply that biogenesis might be facilitated by estrogen-related receptor (ESRR) genes. (4) Conclusion: Urolithin A shows no effect on autophagy in SH-SY5Y-APP695 cells and its effect on mitochondrial function is limited. Instead, data suggests that UA treatment induces hormetic effects as it induces transcription of several genes related to mitochondrial biogenesis.
Keywords: Alzheimer’s; ellagitannin; hormesis; metabolite; mitochondria; neurodegeneration; polyphenol; urolithin.
Conflict of interest statement
The authors declare no conflict of interest.
Figures
References
-
- Albensi B.C. Dysfunction of mitochondria: Implications for Alzheimer’s disease. Int. Rev. Neurobiol. 2019;145:13–27. - PubMed
MeSH terms
Substances
LinkOut - more resources
Full Text Sources
Other Literature Sources
Medical
