

1H-NMR-Based Metabolomics: An Integrated Approach for the Detection of the Adulteration in Chicken, Chevon, Beef and Donkey Meat
- PMID: 34361796
- PMCID: PMC8347375
- DOI: 10.3390/molecules26154643
1H-NMR-Based Metabolomics: An Integrated Approach for the Detection of the Adulteration in Chicken, Chevon, Beef and Donkey Meat
Abstract
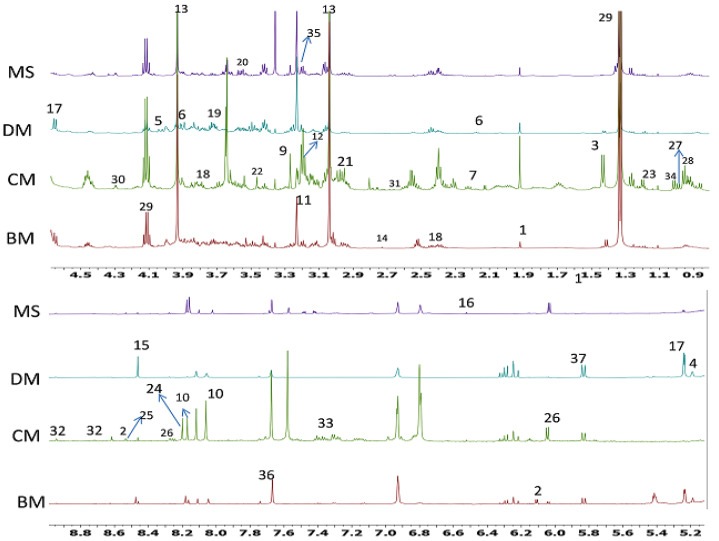
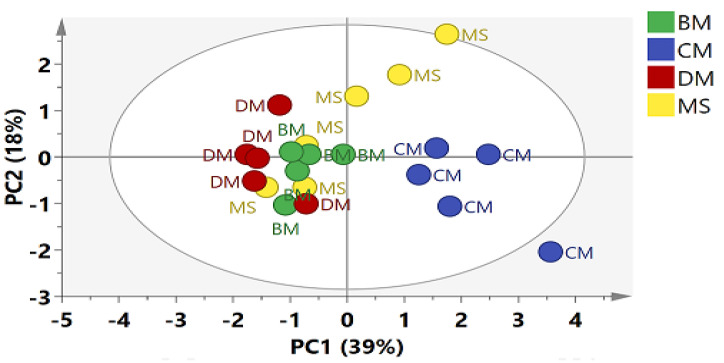
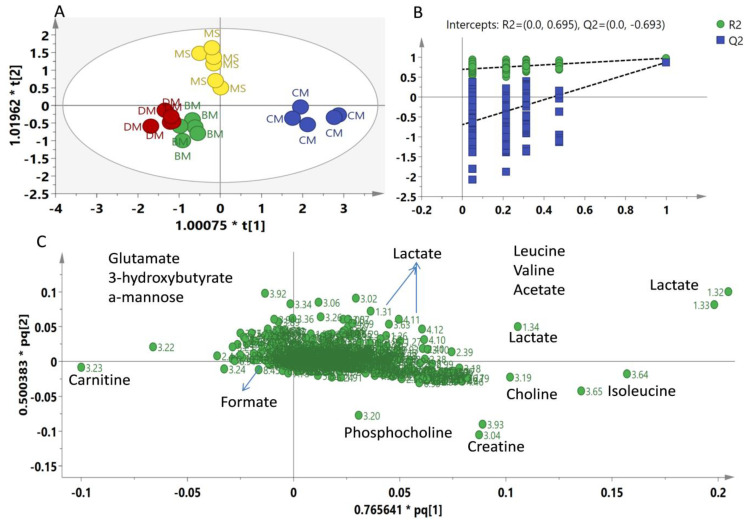
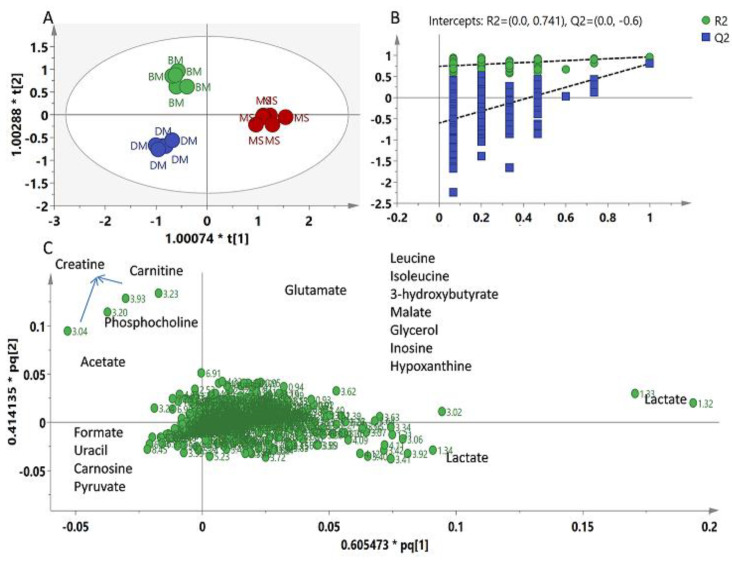
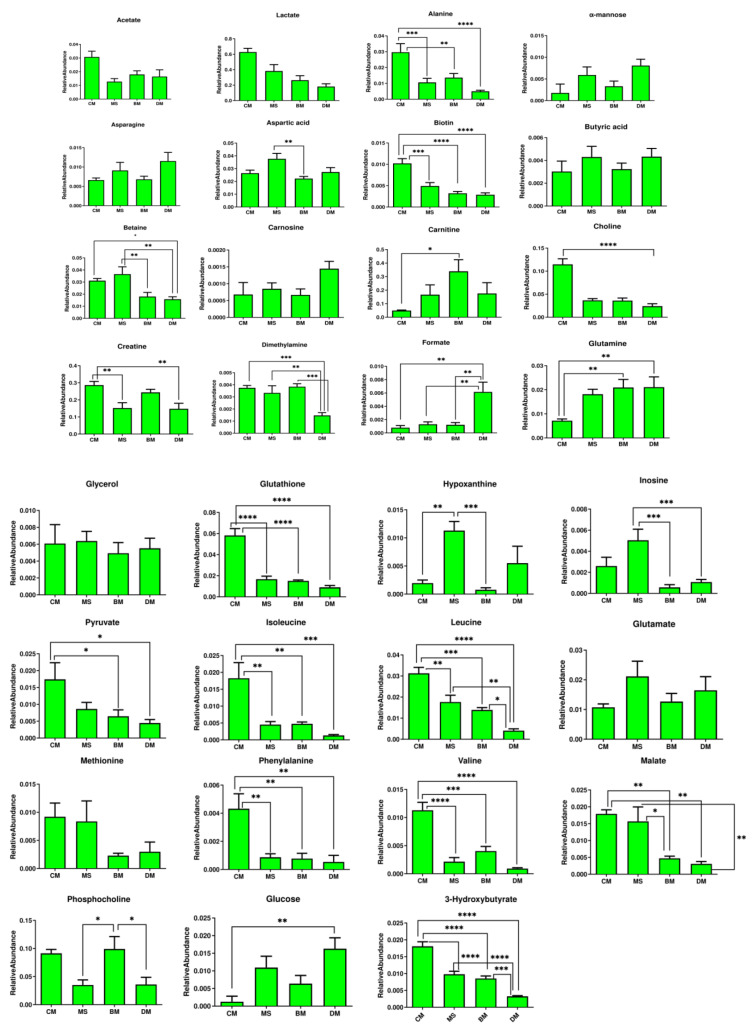
Meat is a rich source of energy that provides high-value animal protein, fats, vitamins, minerals and trace amounts of carbohydrates. Globally, different types of meats are consumed to fulfill nutritional requirements. However, the increasing burden on the livestock industry has triggered the mixing of high-price meat species with low-quality/-price meat. This work aimed to differentiate different meat samples on the basis of metabolites. The metabolic difference between various meat samples was investigated through Nuclear Magnetic Resonance spectroscopy coupled with multivariate data analysis approaches like principal component analysis (PCA) and orthogonal partial least square-discriminant analysis (OPLS-DA). In total, 37 metabolites were identified in the gluteal muscle tissues of cow, goat, donkey and chicken using 1H-NMR spectroscopy. PCA was found unable to completely differentiate between meat types, whereas OPLS-DA showed an apparent separation and successfully differentiated samples from all four types of meat. Lactate, creatine, choline, acetate, leucine, isoleucine, valine, formate, carnitine, glutamate, 3-hydroxybutyrate and α-mannose were found as the major discriminating metabolites between white (chicken) and red meat (chevon, beef and donkey). However, inosine, lactate, uracil, carnosine, format, pyruvate, carnitine, creatine and acetate were found responsible for differentiating chevon, beef and donkey meat. The relative quantification of differentiating metabolites was performed using one-way ANOVA and Tukey test. Our results showed that NMR-based metabolomics is a powerful tool for the identification of novel signatures (potential biomarkers) to characterize meats from different sources and could potentially be used for quality control purposes in order to differentiate different meat types.
Keywords: NMR; biomarkers; halal meat; metabolomics; multivariate data analysis.
Conflict of interest statement
The authors declare no conflict of interest.
Figures
References
-
- Jalil H., Hussain S.S., Siddiqi A.F. An empirical study of meat supply chain and prices pattern in Lahore (Pakistan): A case study. Int. J. Supply Chain Manag. 2019;2:44–52.
-
- Ahmad R.S., Imran A., Hussain M.B. Nutritional Composition of Meat. In: Arshad M.S., editor. Meat Science and Nutrition. IntechOpen; London, UK: 2018. pp. 61–77. - DOI
-
- Abd El-Aziz D.M. Molecular and histological investigation of adulterated ready-to-eat heated meat products with chicken substances. Int. Food Res. J. 2018;25:1948–1952.
-
- Guntarti A., Martono S., Yuswanto A., Rohman A. Analysis of beef meatball adulteration with wild boar meat using real-time polymerase chain reaction. Int. Food Res. J. 2017;24:2451–2455.
MeSH terms
Substances
LinkOut - more resources
Full Text Sources
Medical
