. 2021 Jul 12;9(7):1485.
doi: 10.3390/microorganisms9071485.

Multiomics Profiling Reveals Signatures of Dysmetabolism in Urban Populations in Central India

Affiliations

Multiomics Profiling Reveals Signatures of Dysmetabolism in Urban Populations in Central India

Tanya M Monaghan et al. Microorganisms. .

Abstract

Background: Non-communicable diseases (NCDs) have become a major cause of morbidity and mortality in India. Perturbation of host-microbiome interactions may be a key mechanism by which lifestyle-related risk factors such as tobacco use, alcohol consumption, and physical inactivity may influence metabolic health. There is an urgent need to identify relevant dysmetabolic traits for predicting risk of metabolic disorders, such as diabetes, among susceptible Asian Indians where NCDs are a growing epidemic.

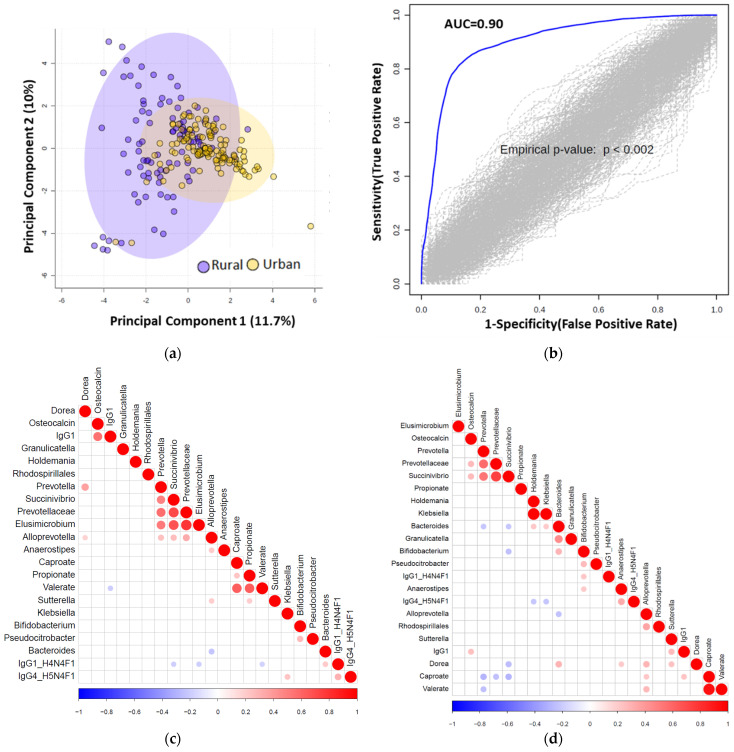
Methods: Here, we report the first in-depth phenotypic study in which we prospectively enrolled 218 adults from urban and rural areas of Central India and used multiomic profiling to identify relationships between microbial taxa and circulating biomarkers of cardiometabolic risk. Assays included fecal microbiota analysis by 16S ribosomal RNA gene amplicon sequencing, quantification of serum short chain fatty acids by gas chromatography-mass spectrometry, and multiplex assaying of serum diabetic proteins, cytokines, chemokines, and multi-isotype antibodies. Sera was also analysed for N-glycans and immunoglobulin G Fc N-glycopeptides.

Results: Multiple hallmarks of dysmetabolism were identified in urbanites and young overweight adults, the majority of whom did not have a known diagnosis of diabetes. Association analyses revealed several host-microbe and metabolic associations.

Conclusions: Host-microbe and metabolic interactions are differentially shaped by body weight and geographic status in Central Indians. Further exploration of these links may help create a molecular-level map for estimating risk of developing metabolic disorders and designing early interventions.

Keywords: diabetes mellitus; dysmetabolism; geography; glycome; host–microbe interactions; multiomics.


Conflict of interest statement

T.M. has received consultancy fees from Takeda. B.H.M. has received consultancy fees from Finch Therapeutics Group. J.R.M. has received consultancy fees from Cultech Ltd., and Enterobiotix Ltd. G.L. is founder and CEO of Genos, a private research organization that specializes in high-throughput glycomic analysis and has several patents in this field. M.P-B., F.K. and F.V. are employees of Genos. The remaining authors declare no competing interests.

Figures

Figure 1
Figure 1
The microbiota is structurally distinct in participants from rural vs. urban areas. (a) Schematic of overall study design (n = number of urban/rural samples). (b) Diversity as determined by inverse Simpson index based on normalized ASV counts in participants from rural vs. urban areas (Kruskall–Wallis nonparametric test, p < 0.001). (c) Non-metric multidimensional scaling (NMDS) visualization of Bray–Curtis distance (based on normalized ASV counts) of the microbiota in participants based on geography (rural vs. urban; purple vs. yellow). Analysis of similarities (ANOSIM) was conducted using Bray–Curtis distance, 9999 permutations. (d) Log-transformed relative abundance of significantly differential genera between participants from rural or urban areas, as determined by Linear discriminant analysis Effect Size (LEfSe).
Figure 2
Figure 2
Serum immunoglobulin levels vary by geography. (a) Principal component analysis (PCA) score plot on the selected features demonstrates a clear separation in serum multi-isotype antibody responses in terms of geographic setting of sampled population. Dots represent patients and are coloured according to the subject cohort. Ellipse represents 95% confidence. Results are plotted according to the Principal component-1 (PC1) and Principal component-2 (PC2) scores, with the percent variation of the cohort explained by the respective x and y axess. (b) Box plots showing levels of serum IgM and IgG1 antibodies in rural and urban cohorts, respectively.
Figure 3
Figure 3
Significant Pearson correlation (p < 0.05) of the selected features for the (a) rural (n = 94) and (b) urban samples (124). Correlated variables are either highly positively correlated (in blue circles) or negatively correlated (red circles).
Figure 4
Figure 4
(a) Principal component analysis (PCA) score plot performed on the selected omics features demonstrating clustering of the rural vs. urban cohorts. Dots represent patients and are coloured according to the subject cohort. Ellipse represents 95% confidence. Results are plotted according to the Principal component-1 (PC1) and Principal component-2 (PC2) scores, with the percent variation of the cohort explained by the respective x and y axes. (b) Permutation test to show the stability of the AUC value after randomizing the urban and rural samples 100 times. (c) Significant correlation (p < 0.05) heatmap of the elastic net selected features is shown for urban samples. (d) Significant Pearson correlation (p < 0.05) heatmap of the elastic net selected features is shown for rural (n = 94) samples.
Figure 5
Figure 5
Jitter plot of the normalized selected features from elastic net analysis are shown for the rural (n = 94) vs. urban (n = 124) cohorts. Wilcoxon Rank test was performed and results were obtained, and p-values are shown in the respective plots.

References

    1. Mohan P., Mohan S.B., Dutta M. Communicable or non-communicable diseases? Building strong primary health systems to address double burden of disease in India. J. Fam. Med. Prim. Care. 2019;8:326–329. doi: 10.4103/jfmpc.jfmpc_67_19. - DOI - PMC - PubMed
    1. Arokiasamy P. India’s escalating burden of non-communicable diseases. Lancet Glob. Health. 2018;6:e1262–e1263. doi: 10.1016/S2214-109X(18)30448-0. - DOI - PubMed
    1. GBD 2016 Disease and Injury Incidence and Prevalence Collaborators Global, regional, and national incidence, prevalence, and years lived with disability for 328 diseases and injuries for 195 countries, 1990–2016: A systematic analysis for the Global Burden of Disease Study 2016. Lancet. 2017;390:1211–1259. doi: 10.1016/S0140-6736(17)32154-2. - DOI - PMC - PubMed
    1. India State-level Disease Burden Initiative Collaborators Nations within a nation: Variations in epidemiological transition across the states of India, 1990-2016 in the Global Burden of Disease Study. Lancet. 2017;390:2427–2460. - PMC - PubMed
    1. Lumeng C.N., Saltiel A.R. Inflammatory links between obesity and metabolic disease. J. Clin. Investig. 2011;121:2111–2117. doi: 10.1172/JCI57132. - DOI - PMC - PubMed

LinkOut - more resources