. 2021 Aug 6;7(32):eabf6580.
doi: 10.1126/sciadv.abf6580. Print 2021 Aug.

Longitudinal tracking of neuronal mitochondria delineates PINK1/Parkin-dependent mechanisms of mitochondrial recycling and degradation

Affiliations

Longitudinal tracking of neuronal mitochondria delineates PINK1/Parkin-dependent mechanisms of mitochondrial recycling and degradation

Huihui Li et al. Sci Adv. .

Abstract

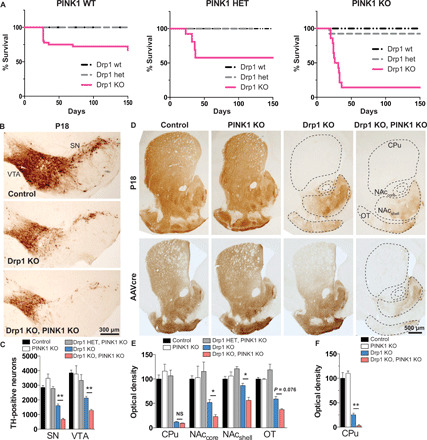
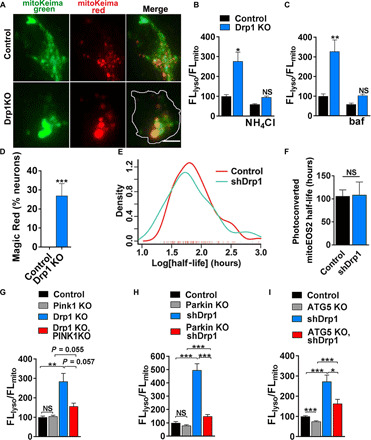
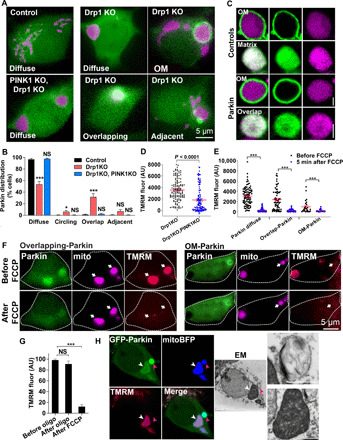
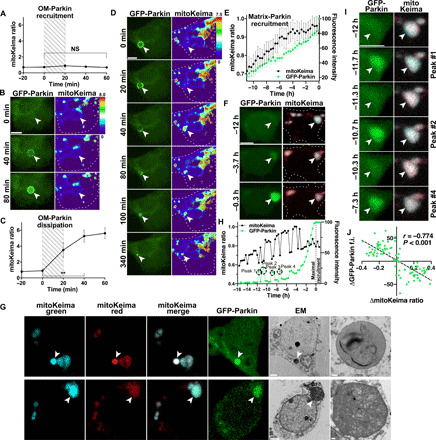
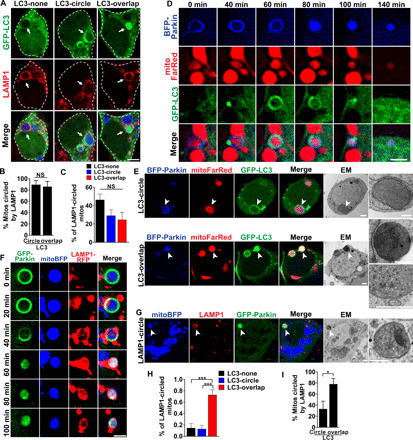
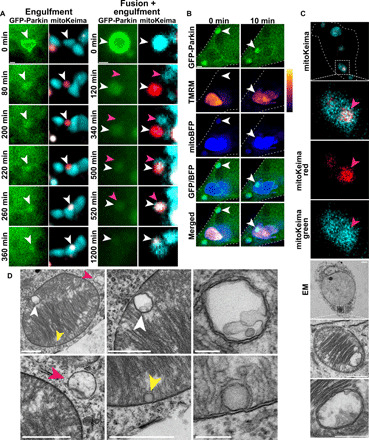
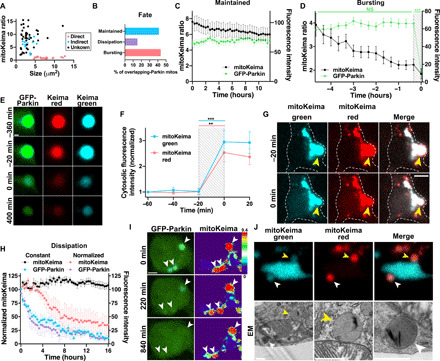
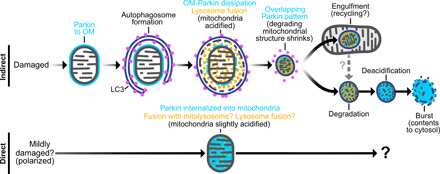
Altered mitochondrial quality control and dynamics may contribute to neurodegenerative diseases, including Parkinson's disease, but we understand little about these processes in neurons. We combined time-lapse microscopy and correlative light and electron microscopy to track individual mitochondria in neurons lacking the fission-promoting protein dynamin-related protein 1 (Drp1) and delineate the kinetics of PINK1-dependent pathways of mitochondrial quality control. Depolarized mitochondria recruit Parkin to the outer mitochondrial membrane, triggering autophagosome formation, rapid lysosomal fusion, and Parkin redistribution. Unexpectedly, these mitolysosomes are dynamic and persist for hours. Some are engulfed by healthy mitochondria, and others are deacidified before bursting. In other cases, Parkin is directly recruited to the matrix of polarized mitochondria. Loss of PINK1 blocks Parkin recruitment, causes LC3 accumulation within mitochondria, and exacerbates Drp1KO toxicity to dopamine neurons. These results define a distinct neuronal mitochondrial life cycle, revealing potential mechanisms of mitochondrial recycling and signaling relevant to neurodegeneration.


Figures

Fig. 1
Fig. 1. Midbrain DA neurons require PINK1 to survive when fission is compromised.
(A) Kaplan-Meier survival curve of Drp1 wt, heterozygous (het), and Drp1KO mice on a PINK1 wt background (left), PINK1 het background (middle), and PINK1 KO background (right). Drp1KO-PINK1KO mice were significantly more likely to die than either Drp1KO-PINK1 wt [hazard ratio (HR) 14.4, 95% confidence interval (CI): 4.67 to 44.6, P < 0.001 by log-rank (Mantel-Cox) test] or Drp1KO-PINK1 het mice (HR 4.21, 95% CI: 1.50 to 11.8, P < 0.01). n = 18 to 36 PINK1 wt mice per group, 5 to 13 PINK1 het mice per group, and 13 to 15 PINK1 KO mice per group. Data in left (PINK1 WT) were published (2) and reproduced here with permission from The Journal of Neuroscience. (B and C) Targeted deletion of Drp1 in DA neurons causes loss of DA cell bodies in the SN and VTA by P18 (assessed by TH staining), which is exacerbated by concurrent PINK1 loss. Data show means ± SEM, n = 4 mice per group with 5 to 6 fields per mouse. In (D) (top) and (E), the loss of cell bodies is preceded by early loss of DA terminals projecting to the caudate putamen (CPu) by P18. Although DA projections to the nucleus accumbens (NAc) core and shell and to the olfactory tubercule (OT) are relatively spared in Drp1KO, concurrent loss of PINK1 markedly increases their susceptibility. n = 4 mice per group, 14 to 20 fields per mouse. In (D) (bottom) and (F), AAVcre was delivered to the SNc of 6- to 7-month-old Drp1lox/lox and Drp1lox/lox;PINK1KO mice. Two months later, mice lacking PINK1 were more susceptible to Drp1 loss, indicating that the synergistic effect also occurs in adult animals. n = 3 to 5 mice per group with 4 to 5 fields per mouse. NS, not significant; *P < 0.05 and **P < 0.01 by one-way ANOVA with Games-Howell post hoc test.
Fig. 2
Fig. 2. Drp1KO increases mitochondrial targeting to lysosomes in a process that is facilitated by PINK1 and Parkin.
(A) Images show control and Drp1KO hippocampal neurons expressing mitoKeima. Scale bar, 4 μm. (B) Quantification of Drp1KO hippocampal neurons expressing mitoKeima. Drp1KO mitochondria have proportionally increased fluorescence in the acidic, lysosomal (FLlyso) versus mitochondrial (FLmito) channel, and this signal is decreased by NH4Cl. Data show means ± SEM, n = 7 to 8 coverslips per group, 6 to 12 cells per coverslip, compilation of two experiments. (C) Bafilomycin (baf), which blocks lysosome acidification, also decreased the FLlyso/FLmito ratio. n = 3 coverslips per group, 5 to 17 cells per coverslip. (D) Neurons were incubated with Magic Red for 1 hour. Magic Red signal accumulates in Drp1KO but not control neurons. n = 9 to 10 coverslips per group, 4 to 12 cells per coverslip, compilation of two experiments. (E and F) Estimate of mitochondrial turnover in neurons expressing Drp1 shRNA or scramble shRNA assessed on the basis of the rate of loss of photoconverted mitoEOS2 from the cell body. Individual neurons expressing mitoEOS2 were photoconverted and longitudinally imaged using robotic microscopy. Loss of Drp1 (shRNA) did not influence the rate of dissipation of red (photoconverted) fluorescence despite producing characteristic swollen mitochondria (fig. S2F). Data are means ± SEM, not significant versus scramble shRNA by two-sided Mann-Whitney test, n = 109 neurons in total from two experiments. (G and H) Increased lysosomal targeting in Drp1KO neurons is inhibited by PINK1 KO or Parkin KO. (G) n = 10 to 11 coverslips per group, n = 3 to 15 cells per coverslip, compilation of two experiments; (H) n = 16 coverslips per group, n = 3 to 9 cells per coverslip from three experiments. (I) Increased lysosomal targeting in neurons treated with shDrp1 is also largely inhibited by ATG5 KO. n = 25 to 32 coverslips per group, n = 3 to 5 cells per coverslip from six experiments; *P < 0.05, **P < 0.01, and ***P < 0.001 by one-way ANOVA with Games-Howell post hoc test (B, G, H, and I) or Tukey’s multiple comparisons test (C) or t test (D).
Fig. 3
Fig. 3. Parkin is recruited into polarized Drp1KO mitochondria.
(A) Neurons expressing GFP-Parkin (green) and mitoBFP (purple, mitochondrial matrix–targeted BFP). Parkin is diffusely distributed in control neurons. A subset of Drp1KO neurons contain mitochondria with either adjacent Parkin punctae, overlapping Parkin, or Parkin ringing (circling). Drp1KO;PINK1KO blocks all Parkin recruitment. (B) Quantification of Parkin distribution patterns. Data show means ± SEM; n = 12 coverslips per group, 8 to 20 neurons per coverslip from three experiments. (C) Confocal microscopy shows single mitochondria in Drp1KO neurons expressing a mitochondrial matrix marker (mitoFarRed, purple) and either a mitochondrial outer membrane marker (OM-GFP) or mitochondrial matrix marker (matrix-GFP) as controls or GFP-Parkin recruited either in a mitochondrial OM or overlapping pattern. Scale bars, 1 μm. (D) Scattergraph of mitochondrial membrane potential (TMRM) of individual Drp1KO and Drp1KO;PINK1KO mitochondria. n = 128 to 130 mitochondria per group from two experiments. P < 0.0001 by unpaired t test. (E and F) Scattergraphs (E) and images (F) of mitochondrial membrane potential (TMRM, red) of mitochondria with different Parkin patterns in Drp1KO neurons expressing mitoBFP and GFP-Parkin, before and after FCCP treatment (1.25 μM). n = 26 to 87 mitochondria per group from three experiments. (G) Mitochondrial membrane potential (TMRM) of mitochondria with overlapping-Parkin in Drp1KO neurons before and after oligomycin (5 μM, 5 min) and FCCP (1.25 μM, 5 min). n = 17 cells from two experiments. *P < 0.05 and ***P ≤ 0.001 by one-way ANOVA with Tukey’s multiple comparisons test (G) or Games-Howell post hoc test (B and E). (H) CLEM showing GFP-Parkin accumulation in polarized (white arrowheads) and depolarized (pink arrowheads) mitochondria. Corresponding ultrastructure shows that the polarized mitochondrion with internalized Parkin has intact membranes and cristae (bottom inset), while the depolarized mitochondria (top inset) is a vesicular structure containing degraded mitochondrial membranes. Scale bars, 2 μm (main panels) and 1 μm (inset). AU, arbitrary units.
Fig. 4
Fig. 4. Time-lapse imaging reveals distinct Parkin-dependent quality control pathways.
Drp1KO neurons coexpressing GFP-Parkin and mitoKeima were imaged every 20 min for up to 21 hours. (A) Relative mitochondrial acidity during OM-Parkin recruitment. Hatched area represents period of GFP-Parkin OM accumulation. Data represent means ± SEM. n = 10 mitochondria from 9 neurons, 1 to 4 neurons per dish, three experiments. (B) GFP-Parkin accumulates at the OM of a mitochondrion with low acidity. (C) Mitochondrial acidity during OM GFP-Parkin dissipation. Hatched area delineates period when GFP-Parkin begins to dissipate. n = 10 mitochondria from 9 neurons, 1 to 4 neurons per dish, two experiments. **P < 0.01 by one-way ANOVA with repeated measures. (D) OM-Parkin dissipates concomitantly with mitochondrial acidification. Parkin then accumulates inside the shrunken mitochondrion. (E) Direct matrix-Parkin accumulation. GFP-Parkin (green) slowly accumulates in the mitochondrial matrix as acidity (black) increases. GFP-Parkin fluorescence was normalized such that the lower and upper bounds were defined by the nuclear and maximum mitochondrial intensities, respectively. Traces are aligned so maximum matrix-Parkin intensity is at 0 hours. n = 23 mitochondria from 22 neurons, 1 to 9 neurons per dish, seven experiments. (F) GFP-Parkin directly accumulates in mitochondria, without prior OM recruitment. (G) CLEM shows that acidified overlapping-Parkin mitochondria are degrading mitochondrial contents within lysosomes (mitolysosomes) (top). Overlapping-Parkin mitochondria with slightly acidic pH (fig. S5F) are intact mitochondria with electron-dense cristae (bottom). Scale bars, 2 μm (cell overviews) and 0.2 μm (insets). (H and I) Corresponding repetitive single spikes of Parkin accumulation and decreased mitochondrial acidity in a Drp1KO mitochondrion during direct matrix-Parkin recruitment. (B, D, F, and I) Scale bars, 5 μm. (J) Inverse relationship between changes in GFP-Parkin intensity and mitoKeima ratio during Parkin spikes. The change in GFP-Parkin and mitoKeima was measured between time points before, during, and after the peak. n = 90 measurements, 40 individual spikes in 6 neurons, 5 to 9 spikes per neuron, 1 mitochondrion per neuron; Pearson r = −0.774, P < 0.001. f.i., fluorescence intensity.
Fig. 5
Fig. 5. PINK1-dependent formation of LC3-positive autophagosomes precedes rapid lysosome fusion.
(A) Drp1KO neurons expressing GFP-LC3 (green) and mitoBFP (blue) treated with 100 nM bafilomycin for 4 hours and stained for LAMP1 (lysosomes, red). Scale bar, 4 μm. (B) Most mitochondria with circling or overlapping patterns of GFP-LC3 were circled by LAMP1. n = 8 coverslips per group, 4 to 7 neurons per coverslip, three experiments. (C) Among LAMP1-circled mitochondria, ≈50% did not have LC3 accumulation (diffuse LC3); others were circled by GFP-LC3 (LC3-circle) or had GFP-LC3 overlapping the mitochondrial matrix (LC3-overlap). n = 8 coverslips per group, n = 6 to 11 cells per coverslip, three independent experiments. (D) Drp1KO neurons coexpressing GFP-LC3, mitoFarRed, and BFP-Parkin. GFP-LC3 accumulates in a distinct punctum on the mitochondrion with OM-Parkin, before dispersing to encircle the mitochondrion. BFP-Parkin then transitions to the overlapping pattern, and LC3 reaccumulates into a punctum. Scale bar, 2 μm. (E) CLEM shows ultrastructure of Parkin-positive mitochondria with distinct patterns of GFP-LC3. Mitochondria with LC3-circle are surrounded by an isolation membrane (top). LC3-overlap mitochondrion (bottom) is electron-dense but intact, with packed cristae (see insets). Bottom inset is the same structure from a different section. Scale bars, 1 μm. (F) Drp1KO neurons coexpressing GFP-Parkin, LAMP1-RFP, and mitoBFP. Images show formation of a LAMP1 ring, indicating lysosomal fusion, concurrent with Parkin shifting from OM to overlapping. Scale bar, 2 μm. (G) Overlapping-Parkin mitochondria circled by LAMP1 are mitolysosomes by ultrastructure. Scale bars, 1 μm. (H) Drp1KO;PINK1KO neurons expressing GFP-LC3 and mitoBFP treated with bafilomycin for 4 hours and stained for LAMP1. Among LAMP1-circled mitochondria, ≈80% had LC3-overlap, and a few were either circled or lacked GFP-LC3 accumulation. n = 9 coverslips per group, 5 to 12 neurons per coverslip, two experiments. (I) Most mitochondria with LC3-overlap were circled by LAMP1. n = 6 coverslips per group, 5 to 12 neurons per coverslip, three experiments. *P < 0.05 and ***P < 0.001 by t test (B and I) or one-way ANOVA with Tukey’s multiple comparisons test (C and H).
Fig. 6
Fig. 6. Acidified overlapping-Parkin mitochondria are engulfed by mitochondria with normal pH.
Mitochondria in Drp1KO hippocampal neurons coexpressing GFP-Parkin and mitoKeima were tracked individually to determine their fates. (A) Time-lapse images show the fates of single mitochondria that were acidified following OM-Parkin disruption (white arrowheads). Some mitolysosomes are engulfed by nonacidified mitochondria (left). The mitolysosome on the right first fuses with a nonacidified mitochondrion (pink arrowheads) before being engulfed by another. Scale bars, 1 μm. (B) Drp1KO neurons expressing GFP-Parkin and mitoBFP were incubated with TMRM and imaged every 10 min for several hours. Representative images show overlapping-Parkin mitochondria being engulfed by polarized mitochondria (white arrowheads). Overlapping-Parkin colocalizes with mito-BFP before and after engulfment. Scale bar, 1 μm. (C) CLEM images show a healthy mitochondrion with intact cristae that contains a discrete acidified structure (by mitoKeima) that corresponds to a membrane-bound structure enclosing mitochondrial materials. Scale bars, 2 μm (cell overview), 1 μm (mitochondria overview), and 0.5 μm (inset). (D) EM images show a healthy mitochondrion engulfing two structures (white and yellow arrowheads) similar to what was described in (C). A lysosome (pink arrowheads) was also observed interacting with the same mitochondrion. Scale bars, 1 μm for images containing arrowheads and 0.2 μm for insets.
Fig. 7
Fig. 7. Long-lived mitolysosomes burst and release contents.
(A) Mitochondria with confirmed indirect OM-Parkin (blue, n = 12) are smaller and more acidic than those with direct Parkin recruitment (pink, n = 23). Most with overlapping-Parkin from t = 0 (unknown origin, black, n = 46) are similar to those from the indirect pathway. (B) Fates of these 46 mitolysosomes. (C) Constant acidity levels in mitolysosomes that maintain GFP-Parkin signal (n = 19 mitochondria from 18 neurons, 1 to 4 neurons per dish, 10 experiments; not significant for interaction between GFP-Parkin and mitoKeima ratio by two-way ANOVA with repeated measures). (D) GFP-Parkin sharply decreases after bursting. Acidity decreases over hours preceding degradation (P < 0.05). Traces are aligned so bursting occurs at 0 hours. n = 19 mitochondria from 17 neurons, 1 to 5 neurons per dish, seven experiments. ***P < 0.001 by two-way ANOVA with repeated measures. (E) Post-burst mitolysosome structure tracked for 400 min. Scale bar, 1 μm. (F) Cytosolic mitoKeima increases when mitolysosomes burst. Traces are aligned so bursting occurs at 0 min. n = 20 mitochondria from 18 neurons, 1 to 5 neurons per dish, seven experiments. **P < 0.01 and ***P < 0.001 by two-way ANOVA with repeated measures and Bonferroni’s multiple comparison test. (G) Mitolysosome bursting (yellow arrowheads) is accompanied by increased cytosolic mitoKeima. Scale bar, 5 μm. (H) In some mitolysosomes, GFP-Parkin dissipates followed by pH normalization (pink, n = 3 mitochondria from 3 neurons, 1 neuron per dish, three experiments), while others remain acidic (black, n = 4 mitochondria from 3 neurons, 1 to 2 neurons per dish, two experiments). GFP-Parkin intensity similarly decreases in both (constant acidity, blue; normalized acidity, purple). (I) In three mitochondria with overlapping-Parkin, GFP-Parkin signal fades by 220 min and is at cytosolic levels by 840 min. By then, the mitolysosome in the lower left corner has normalized acidity. Scale bar, 3 μm. (J) CLEM shows close contacts between a mitochondrion with intact cristae and two acidified mitolysosomes (yellow and white arrowheads). Scale bars, 1 μm.
Fig. 8
Fig. 8. Indirect and direct pathways of mitochondrial Parkin recruitment.
Schema shows indirect and direct mechanisms by which Parkin accumulates in mitochondria and the fates of mitochondria in each of these pathways. In the indirect pathway, Parkin accumulates on the OM of depolarized mitochondria (OM-Parkin). These mitochondria are engulfed by autophagosomes and then rapidly fuse with lysosomes, which occurs concurrently with Parkin dissipation from the OM. These degrading mitochondrial structures then shrink to form mitolysosomes with an overlapping-Parkin pattern (and which are indistinguishable from healthy mitochondria when visualized by either light microscopy with mitochondria-targeted reporters or immunofluorescence against mitochondrial matrix proteins). Mitolysosomes are stable for many hours. A subset is engulfed by mitochondria, and others eventually undergo deacidification before bursting and releasing contents into the cytosol. In the direct pathway, Parkin is gradually recruited directly into mitochondria over many hours, as mitochondria concurrently undergo mild acidification through undefined mechanisms.

References

    1. Itoh K., Nakamura K., Iijima M., Sesaki H., Mitochondrial dynamics in neurodegeneration. Trends Cell Biol. 23, 64–71 (2013). - PMC - PubMed
    1. Berthet A., Margolis E. B., Zhang J., Hsieh I., Zhang J., Hnasko T. S., Ahmad J., Edwards R. H., Sesaki H., Huang E. J., Nakamura K., Loss of mitochondrial fission depletes axonal mitochondria in midbrain dopamine neurons. J. Neurosci. 34, 14304–14317 (2014). - PMC - PubMed
    1. Pham A. H., Meng S., Chu Q. N., Chan D. C., Loss of Mfn2 results in progressive, retrograde degeneration of dopaminergic neurons in the nigrostriatal circuit. Hum. Mol. Genet. 21, 4817–4826 (2012). - PMC - PubMed
    1. Nakamura K., Nemani V. M., Azarbal F., Skibinski G., Levy J. M., Egami K., Munishkina L., Zhang J., Gardner B., Wakabayashi J., Sesaki H., Cheng Y., Finkbeiner S., Nussbaum R. L., Masliah E., Edwards R. H., Direct membrane association drives mitochondrial fission by the Parkinson disease-associated protein alpha-synuclein. J. Biol. Chem. 286, 20710–20726 (2011). - PMC - PubMed
    1. Wang W., Wang X., Fujioka H., Hoppel C., Whone A. L., Caldwell M. A., Cullen P. J., Liu J., Zhu X., Parkinson’s disease-associated mutant VPS35 causes mitochondrial dysfunction by recycling DLP1 complexes. Nat. Med. 22, 54–63 (2016). - PMC - PubMed