. 2021 Aug 6;12(1):4773.
doi: 10.1038/s41467-021-24956-2.

Impact of aging and exercise on skeletal muscle mitochondrial capacity, energy metabolism, and physical function

Affiliations

Impact of aging and exercise on skeletal muscle mitochondrial capacity, energy metabolism, and physical function

L Grevendonk et al. Nat Commun. .

Abstract

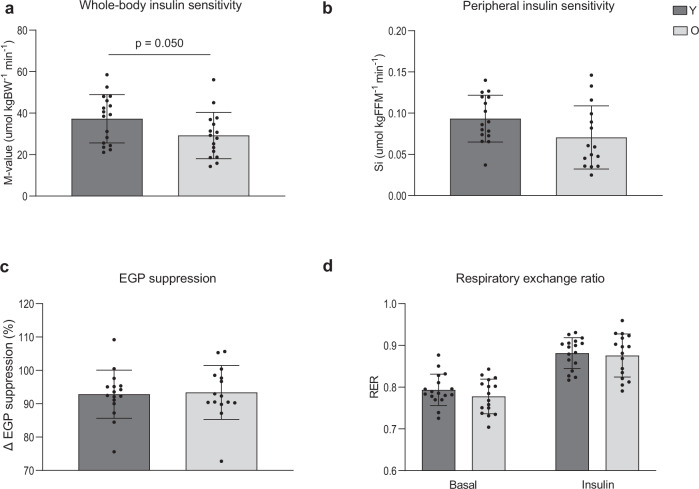
The relationship between the age-associated decline in mitochondrial function and its effect on skeletal muscle physiology and function remain unclear. In the current study, we examined to what extent physical activity contributes to the decline in mitochondrial function and muscle health during aging and compared mitochondrial function in young and older adults, with similar habitual physical activity levels. We also studied exercise-trained older adults and physically impaired older adults. Aging was associated with a decline in mitochondrial capacity, exercise capacity and efficiency, gait stability, muscle function, and insulin sensitivity, even when maintaining an adequate daily physical activity level. Our data also suggest that a further increase in physical activity level, achieved through regular exercise training, can largely negate the effects of aging. Finally, mitochondrial capacity correlated with exercise efficiency and insulin sensitivity. Together, our data support a link between mitochondrial function and age-associated deterioration of skeletal muscle.


Conflict of interest statement

J.V.d.B and M.C.E.B are affiliated with Danone Nutricia Research and Friesland-Campina, respectively. Friesland-Campina and Danone Nutricia Research are sponsors of the TiFN program and partly financed the project. The other authors declare no competing interests.

Figures

Fig. 1
Fig. 1. Effect of aging on muscle health and exercise efficiency.
a Walking distance during the 6MWT performed on the Caren-system (Y, n = 14; O, n = 17). b Maximum rate of oxygen consumption measured during graded cycling exercise corrected for FFM (Y, n = 16; O, n = 17). c Maximal power output measured during graded cycling test (Y, n = 16; E, n = 17). d Muscle strength expressed as the extension and flexion peak torque during an isokinetic protocol on the Biodex system and corrected for fat-free mass (Y, n = 16; O, n = 17). e Upper leg muscle volume measured by MRI (Y, n = 17; O, n = 17). f Resting energy expenditure adjusted for fat-free mass (Y, n = 15; O, n = 17). g Respiratory exchange ratio measured before, in resting conditions, and during submaximal exercise (Y, n = 15; O, n = 17). h Exercise efficiency measured during the submaximal cycle test and expressed as gross efficiency and net efficiency (Y, n = 15; O, n = 17). Dark gray bars represent the young individuals (Y), light gray bars represent the older individuals (O). FFM could not be measured in one Y due to the implications of the SARS-CoV-19 outbreak. For the same reason, 6MWT data and muscle volume data are missing in the same Y participant. Another participant from Y did not perform the 6MWT due to scheduling issues. The reported 6MWT distance from one Y participant was invalid and therefore excluded for analysis. One Y participant failed to complete the submaximal cycle test due to exhaustion. In another Y participant, the test could not be performed due to the implications of the SARS-CoV-19 outbreak. Values are presented as mean ± SD (with individual data points), Asterisk denotes significant differences between the two groups (p < 0.05, two-sided, independent samples t-test). 6MWT 6-min walk test, VO2max maximal oxygen flow, Nm newton meters, FFM fat-free mass, RER respiratory exchange ratio, REE resting energy expenditure, EE exercise efficiency.
Fig. 2
Fig. 2. Effect of aging on insulin sensitivity and substrate selection.
a Whole-body insulin sensitivity based on the M-value measured during a hyperinsulinemic-euglycemic clamp. b Insulin-stimulated glucose uptake, corrected for plasma insulin and glucose levels (Si) and expressed per kg FFM. c EGP suppression, calculated as the percentage insulin-suppressed EGP from the basal EGP d Respiratory exchange ratio measured before, in resting conditions (Basal), and during insulin stimulation (Insulin). Dark gray bars represent the young individuals (Y, n = 17), light gray bars represent older individuals (O, n = 15). One participant from O was excluded for analysis due to a violation of the protocol instructions. For one O participant, tracer data could not be analyzed. Values are presented as mean ± SD (with individual data points), p = 0.05 denotes a significant difference between the two groups (two-sided, independent samples t-test). M-value mean glucose infusion rate, BW body weight, Si insulin-stimulated glucose disposal, FFM fat-free mass, EGP endogenous glucose production.
Fig. 3
Fig. 3. Effect of aging on skeletal muscle mitochondrial function and density.
a Mitochondrial respiration upon substrates only (state 2) (Y, n = 15; O = 17). b ADP-stimulated respiration (state 3) respiration fueled by Complex I-linked substrates (Y, n = 15; O = 17). c State 3 respiration upon a lipid substrate (Y, n = 15; O = 17). d State 3 respiration upon parallel electron input into Complex II and I (Y, n = 15; O = 17). e Maximal uncoupled respiration upon FCCP (Y, n = 15; O = 17). f Mitochondrial leak respiration (state 4o) (Y, n = 15; O = 17). g 31P-MRS in vivo assessment of mitochondrial oxidative capacity (κ) (Y, n = 15; O, n = 16). h Mitochondrial protein expression of oxidative phosphorylation (OXPHOS) complex I, complex II, complex III, complex IV, and complex V (Y, n = 15; O, n = 17). Dark gray bars represent the young individuals (Y); light gray bars represent older individuals (O). In one Y no biopsy was performed due to technical issues and, in another Y, due to the implications of the SARS-CoV-19 outbreak. For the latter reason, also PCr recovery data is missing from the same Y participant. PCr data from one O has been excluded from analysis due to a pH decline below 6.9. PCr data from a Y participant has been excluded due to issues regarding the analysis. Values are presented as mean ± SD (with individual data points), Asterisk denotes significant differences between the two groups (p < 0.05, two-sided, independent samples t-test). M malate, O octanoyl-carnitine, G glutamate, S succinate, κ phosphocreatine resynthesis rate constant.
Fig. 4
Fig. 4. Effect of exercise training and physical impairment on muscle health and exercise efficiency in older adults.
a Walking distance during the 6MWT performed on the Caren-system (O, n = 17; TO, n = 17; IO, n = 6). b Maximum rate of oxygen consumption measured during graded cycling exercise (O, n = 17; TO, n = 19; IO, n = 6). c Maximal power output measured during graded cycling test (O, n = 17; TO, n = 19; IO, n = 6). d Muscle strength expressed as the extension and flexion peak torque during an isokinetic protocol on the Biodex system and corrected for fat-free mass (O, n = 17; TO, n = 19; IO, n = 6). e Upper leg muscle volume measured by MRI (O, n = 17; TO, n = 18; IO, n = 6). f Resting energy expenditure adjusted for FFM (O, n = 17; TO, n = 19; IO, n = 5). g Respiratory exchange ratio measured before, in resting conditions, and during submaximal exercise (O, n = 17; TO, n = 19; IO, n = 5). h Exercise efficiency measured during a submaximal cycle test and expressed as gross efficiency and net efficiency (O, n = 17; TO, n = 19; IO, n = 5). Light gray bars represent normally active older adults (O); dark gray bars represent trained older adults (TO); white bars represent physically impaired older adults (IO). Upon the advice of the responsible medical doctor, one IO participant did not perform the maximal and submaximal exercise tests. One TO participant did not perform the 6MWT due to scheduling issues. The reported 6MWT distance from another TO was invalid and therefore excluded for analysis. Data presented in panels a and c were analyzed by two-sided Kruskal–Wallis tests followed by Bonferroni correction. Data presented in panels b, dh were analyzed by one-way ANOVA with Tukey’s post-hoc test. Values are presented as mean ± SD (with individual data points), asterisk denotes significant differences between two groups (p < 0.05). 6MWT 6-min walk test distance, VO2max maximal aerobic capacity, Nm newton meters, FFM fat-free mass, RER respiratory exchange ratio, REE resting energy expenditure, EE exercise efficiency.
Fig. 5
Fig. 5. Effect of exercise training on insulin sensitivity and substrate selection in older adults.
a Whole-body insulin sensitivity based on the M-value measured during a hyperinsulinemic-euglycemic clamp. b Insulin-stimulated glucose uptake corrected for plasma insulin and glucose levels (Si) and expressed per kg FFM c EGP suppression, calculated as the percentage insulin-suppressed EGP from the basal EGP. d Respiratory exchange ratio measured before, in resting conditions (Basal), and during insulin stimulation (Insulin). Light gray bars represent normally active older adults (O, n = 15); dark gray bars represent trained older adults (TO, n = 19). Because only 3 IO participants could undergo the clamp, these results were not considered. One O participant was excluded for analysis due to violation of the protocol instructions. For one O participant tracer data could not be analyzed. Values are presented as mean ± SD (with individual data points), asterisk denotes significant differences between the two groups (p < 0.05 two-sided, independent samples t-test). M-value mean glucose infusion rate, BW body weight, Si insulin-stimulated glucose disposal, FFM fat-free mass, EGP endogenous glucose production.
Fig. 6
Fig. 6. Effect of exercise training and physical impairment on skeletal muscle mitochondrial respiration and density in older adults.
a Mitochondrial respiration upon substrates only (state 2) (O, n = 17; TO, n = 19; IO, n = 6). b ADP-stimulated respiration (state 3) fueled by Complex I-linked substrates (O, n = 17; TO, n = 19; IO, n = 6). c State 3 respiration upon a lipid substrate (O, n = 17; TO, n = 19; IO, n = 6). d State 3 respiration upon parallel electron input into Complex I and II (O, n = 17; TO, n = 19; IO, n = 6). e Maximal uncoupled respiration upon FCCP (O, n = 17; TO, n = 19; IO, n = 6). f Mitochondrial leak respiration (state 4o) (O, n = 17; TO, n = 19; IO, n = 6). g In vivo 31P-MRS estimate of mitochondrial oxidative capacity κ (O, n = 16; TO, n = 18; IO, n = 6). h Mitochondrial protein expression of oxidative phosphorylation (OXPHOS) complex I, complex II, complex III, complex IV, and complex V (O, n = 17; TO, n = 18; IO, n = 6). Light gray bars represent normally active older adults (O); dark gray bars represent trained older adults (TO); white bars represent physically impaired older adults (IO). PCr data from one O participant has been excluded from analysis due to a pH decline below 6.9. PCr from a TO participant has been excluded due to issues regarding the analysis. From one TO not enough muscle tissue was available for the OXPHOS analysis. Data presented in panels a and g were analyzed by two-sided Kruskal–Wallis tests followed by Bonferroni correction. Data presented in panels bf and h were analyzed by one-way ANOVA with Tukey’s post-hoc test. Values are presented as mean ± SD (with individual data points), asterisk denotes significant differences between two groups (p < 0.05). M malate, O octanoyl-carnitine, G glutamate, S succinate, κ phosphocreatine resynthesis rate constant.
Fig. 7
Fig. 7. Bivariate correlations between mitochondrial function and physical muscle function.
a Correlation between maximal exercise capacity and maximal coupled mitochondrial respiration. b Correlation between physical activity and maximal coupled mitochondrial respiration. c Correlation between whole-body insulin sensitivity and maximal uncoupled mitochondrial respiration. d Correlation between gross exercise efficiency and maximal uncoupled mitochondrial respiration. e Correlation between step variability and maximal uncoupled mitochondrial respiration f Correlation between step variability and in vivo PCr recovery rate constant. g Correlation between walking performance and gross exercise efficiency. h Correlation between SPPB chair-stand test and gross exercise efficiency. Dark gray diamonds indicate young normally active individuals (Y), light gray squares indicate normally active older adults (O), white triangles indicate physically impaired older adults individuals (IO), and dark gray circles indicate trained older adults (TO). Asterisk indicates the correlation is significant at the 0.05 level (2-tailed, p < 0.05); Best-fit trend line and 95% confidence intervals are included. MOGS3 state 3 respiration upon malate + octanoyl-carnitine + glutamate + succinate, 3u state 3 uncoupled respiration upon FCCP, κ phosphocreatine resynthesis rate constant, 6MWT 6-min walk test, VO2max maximal aerobic capacity, FFM fat-free mass, Nm newton meters, M-value mean glucose infusion rate, r Pearson correlation coefficient.

References

    1. Beard JR, et al. The World report on ageing and health: a policy framework for healthy ageing. Lancet. 2016;387:2145–2154. doi: 10.1016/S0140-6736(15)00516-4. - DOI - PMC - PubMed
    1. Rodrigues, R., Huber, M. & Lamura, G. Facts and Figures on Healthy Ageing and Long-term Care. Europe and North America, Occasional Reports Series 8. Vienna: European Centre (European Centre for Social Welfare Policy and Research, 2012).
    1. Roubenoff R. Sarcopenia and its implications for the elderly. Eur. J. Clin. Nutr. 2000;54:S40–S47. doi: 10.1038/sj.ejcn.1601024. - DOI - PubMed
    1. Janssen I, Heymsfield SB, Ross R. Low relative skeletal muscle mass (Sarcopenia) in older persons is associated with functional impairment and physical disability. J. Am. Geriatr. Soc. 2002;50:889–896. doi: 10.1046/j.1532-5415.2002.50216.x. - DOI - PubMed
    1. Choi S, et al. 31 P magnetic resonance spectroscopy assessment of muscle bioenergetics as a predictor of gait speed in the baltimore longitudinal study of aging. J. Gerontol. A Biol. Sci. Med. Sci. 2016;71:1638–1645. doi: 10.1093/gerona/glw059. - DOI - PMC - PubMed

Publication types