. 2021 Aug 6;12(1):4776.
doi: 10.1038/s41467-021-24958-0.

Whole-genome sequencing of Schistosoma mansoni reveals extensive diversity with limited selection despite mass drug administration

Affiliations

Whole-genome sequencing of Schistosoma mansoni reveals extensive diversity with limited selection despite mass drug administration

Duncan J Berger et al. Nat Commun. .

Abstract

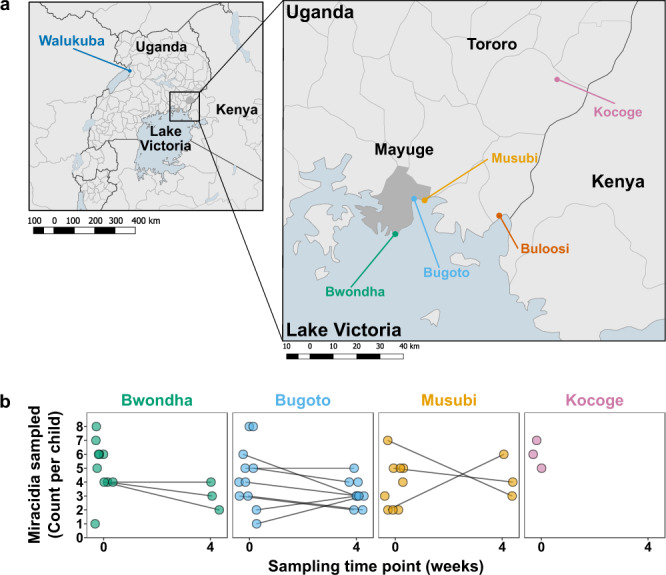
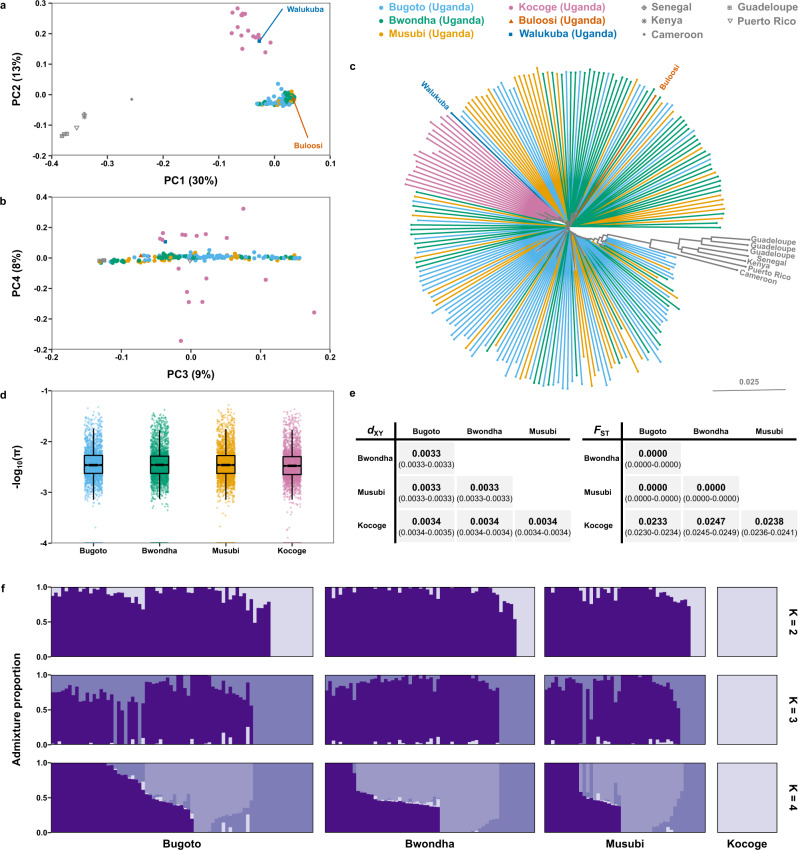
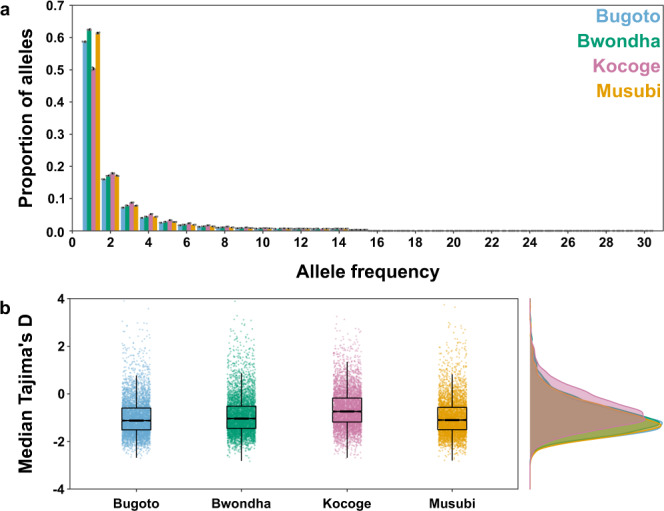
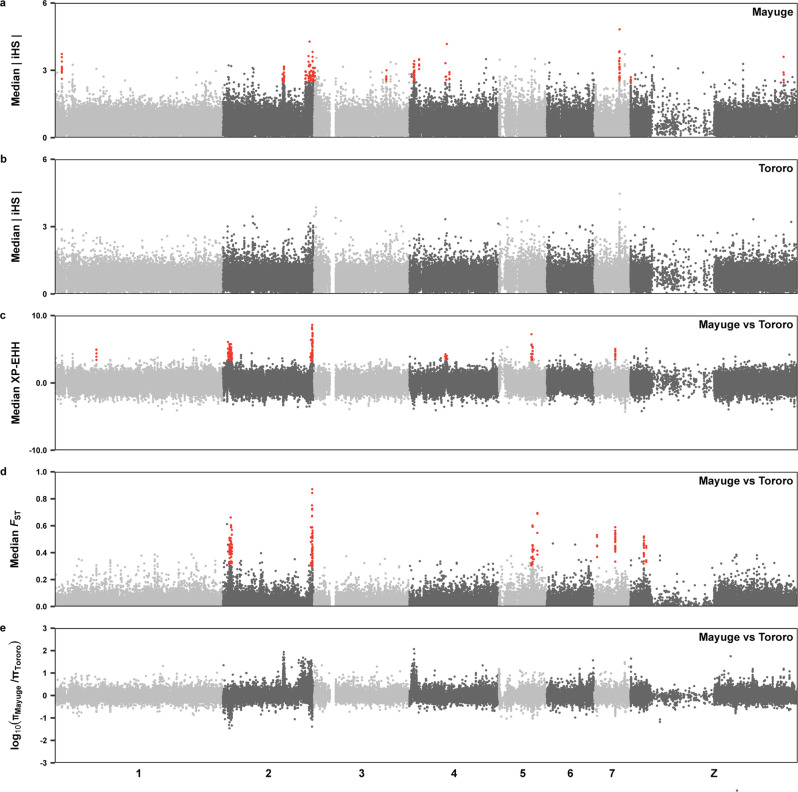
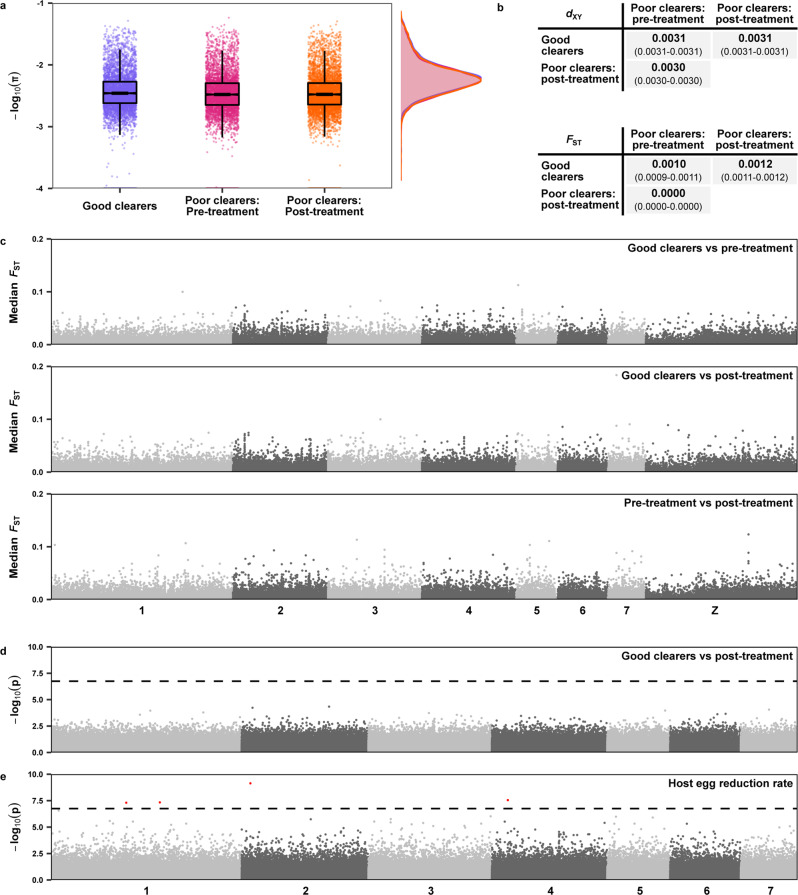
Control and elimination of the parasitic disease schistosomiasis relies on mass administration of praziquantel. Whilst these programmes reduce infection prevalence and intensity, their impact on parasite transmission and evolution is poorly understood. Here we examine the genomic impact of repeated mass drug administration on Schistosoma mansoni populations with documented reduced praziquantel efficacy. We sequenced whole-genomes of 198 S. mansoni larvae from 34 Ugandan children from regions with contrasting praziquantel exposure. Parasites infecting children from Lake Victoria, a transmission hotspot, form a diverse panmictic population. A single round of treatment did not reduce this diversity with no apparent population contraction caused by long-term praziquantel use. We find evidence of positive selection acting on members of gene families previously implicated in praziquantel action, but detect no high frequency functionally impactful variants. As efforts to eliminate schistosomiasis intensify, our study provides a foundation for genomic surveillance of this major human parasite.


Conflict of interest statement

The authors declare no competing interests.

Figures

Fig. 1
Fig. 1. Study design and summary of miracidia stage samples sequenced.
a Sampling was performed in two districts in Uganda; Mayuge district and Tororo district. Within those regions four schools were selected, three from Mayuge district which borders Lake Victoria: Bwondha (green), Bugoto (light blue) and Musubi (yellow). One school from the Tororo district, close to the Kenya border, was chosen: Kocoge (pink). Mayuge district and Tororo district primary schools in each region have been under long-term and short-term mass drug administration (MDA) pressure, respectively. b Pre- and post-treatment sampling information. Circles indicate the numbers of miracidia sampled at week 0 (immediately before treatment) and 4 weeks post-treatment, lines indicate miracidia sampled at both time points from the same children, only samples passing read sequence quality control are included.
Fig. 2
Fig. 2. Schistosoma mansoni population structure.
Principal component analysis (PCA) of genetic differentiation within and between the 198 S. mansoni isolates produced in the present study, plus nine previously published samples from Uganda and elsewhere. a Principal components 1 and 2 and b components 3 and 4 with the first four principal components accounting for 60% of the total variance. Points represent samples from three schools Mayuge district (Uganda), Bugoto (light blue), Bwonda (green) and Musubi (yellow) and one school from Tororo district, Kocoge (pink). We included nine additional previously published samples, one sample was from Buloosi school (orange) ~40 km east of Mayuge district, a second sample was from Walukuba school (dark blue) near Lake Albert and the remaining samples (grey) were from Guadeloupe, Senegal, Kenya, Puerto Rico and Cameroon. c Midpoint rooted neighbour-joining phylogeny showing the relatedness between samples, branches are coloured based on the school or region where sample collection occurred. d Autosomal nucleotide diversity (π) values, calculated as the mean of non-overlapping 5 kb windows for each school population: Bugoto (n = 75 miracidia), Bwondha (n = 60), Musubi (n = 46) and Kocoge (n = 17). For all boxplots, the central line indicates the median, the top and bottom edges of the box indicate the 25th and 75th percentiles, respectively. The maximum whisker lengths are specified as 1.5 times the interquartile range. e Pairwise comparisons of fixation index (FST) and absolute divergence (dXY) between each school population. Both statistics were calculated using autosomal variants in non-overlapping 5 kb windows using the same sample sizes as (d). Median values for each comparison are shown in bold, numbers in parentheses represent the 95% bootstrap confidence intervals around the median. f ADMIXTURE plots illustrating the population structure, assuming 2–4 populations are present (K), using 10-fold cross-validation and standard error estimation with 250 bootstraps. Y-axis values show admixture proportions for different values of K (K = 2–4), each shade of purple indicates a different population.
Fig. 3
Fig. 3. Genome-wide allele frequency patterns.
a One-dimensional site frequency spectra for each parasite population sampled from children in each school: Bugoto (light blue), Bwondha (green), Musubi (yellow) and Kocoge (pink). For each school, miracidial populations were subsampled (n = 15 miracidia per school) and site frequency spectra were calculated, this was repeated for a total of five replicates. The x-axis represents the derived allele frequency and y-axis represents the proportion of sites at each allele frequency. Coloured bars represent the median proportion of sites across all replicates for each school, black error bars represent the standard deviation around the median for all replicates, grey points represent the individual results for each replicate. b Median Tajima’s D values calculated in 5 kb windows across each autosome for each school population. For all boxplots, the central line indicates the median, the top and bottom edges of the box indicate the 25th and 75th percentiles, respectively. The maximum whisker lengths are specified as 1.5 times the interquartile range.
Fig. 4
Fig. 4. Signatures of recent selection.
a Genome-wide integrated haplotype scores (iHS) within the Mayuge population (n = 181) a region of long-term MDA pressure (8–9 previous annual rounds). b Genome-wide integrated haplotype scores (iHS) within the Tororo populations (n = 17), a region of short-term MDA pressure (1 previous round with limited coverage). Points represent median values of all variants in 2 kb non-overlapping windows along the eight S. mansoni chromosomes (shown in alternating shades of grey). c Genome-wide cross-population extended haplotype heterozygosity values (XP-EHH) between populations from Mayuge district and Tororo district, calculated as the median of all variants in 2 kb non-overlapping windows. d Fixation index (FST) values between populations from Mayuge district and Tororo district, calculated as the mean of FST scores in non-overlapping 2 kb windows. e Nucleotide diversity was calculated as the mean of 2 kb windows across each chromosome for each district, the ratio between Mayuge and Tororo 2 kb windows is shown. Windows with the highest 0.25% of values in the Mayuge iHS, FST and XP-EHH statistics (shown as red points) were used to define candidate regions of selection. Windows with a 300 kb of each other were joined into continuous regions of selection, any of those regions with <8 windows with elevated values across any statistic were discarded (Supplementary Data 4).
Fig. 5
Fig. 5. The impact of a single round of praziquantel treatment on Mayuge district Schistosoma mansoni populations.
Populations were stratified into three groups based on clearance phenotype and time of sampling. Samples from children with no miracidial hatching after treatment were classified as ‘good clearers’ (n = 81, purple), samples from children with post-treatment miracidial hatching were grouped as either ‘pre-treatment’ (n = 67, pink) or ‘post-treatment’ (n = 57, orange) if they were sampled 25–27 days post-treatment. a Nucleotide diversity (π) estimates calculated in 5 kb, non-overlapping windows across each autosome for each population. For all boxplots, the central line indicates the median, the top and bottom edges of the box indicate the 25th and 75th percentiles, respectively. The maximum whisker lengths are specified as 1.5 times the interquartile range. b Pairwise comparisons of the fixation index (FST) and absolute divergence (dXY) between populations, calculated in 5 kb, non-overlapping windows across all autosomes for each population. Numbers in bold represent the median value of all windows, numbers in parentheses represent the 95% bootstrap confidence intervals around the median. c Pairwise FST estimates between each population, plotted as median values in 2 kb windows along each autosome (shown in alternating shades of grey). d Manhattan plot of significance values from logistic regression genome-wide association test, comparing populations sampled from good clearers to miracidia only from post-treatment collections. The test was performed using the 281,350 autosomal variants found not to be in strong linkage disequilibrium in these populations. e Manhattan plot of significance values from linear regression genome-wide association test using the quantitative egg reduction rate (ERR) estimates across all 181 Mayuge samples using the 281,954 autosomal variants not found to be in strong linkage disequilibrium. The first four principal components of the PCA (Fig. 4) were used as covariates. The dashed lines represent the Bonferroni corrected significance threshold, points higher than this threshold are shown in red.

References

    1. Hotez, P. J. et al. The Global Burden of Disease Study 2010: interpretation and implications for the neglected tropical diseases. PLoS Negl. Trop. Dis.8, e2865 (2014). - PMC - PubMed
    1. World Health Organization. Prevention and Control of Schistosomiasis and Soil-transmitted Helminthiasis: Report of a WHO Expert Committee (World Health Organization, 2002). - PubMed
    1. Montresor A, Engels D, Ramsan M, Foum A, Savioli L. Field test of the ‘dose pole’ for praziquantel in Zanzibar. Trans. R. Soc. Trop. Med. Hyg. 2002;96:323–324. doi: 10.1016/S0035-9203(02)90111-2. - DOI - PMC - PubMed
    1. World Health Organization. Helminth Control in School-aged Children: A Guide for Managers of Control Programmes (World Health Organisation, 2006).
    1. World Health Organization. Schistosomiasis and soil-transmitted helminthiases: numbers of people treated in 2019. Wkly. Epidemiol. Rec. 2020;95:629–640.

Publication types