. 2021 Aug 6;12(1):4744.
doi: 10.1038/s41467-021-24776-4.

Human sensorimotor organoids derived from healthy and amyotrophic lateral sclerosis stem cells form neuromuscular junctions

Affiliations

Human sensorimotor organoids derived from healthy and amyotrophic lateral sclerosis stem cells form neuromuscular junctions

João D Pereira et al. Nat Commun. .

Abstract

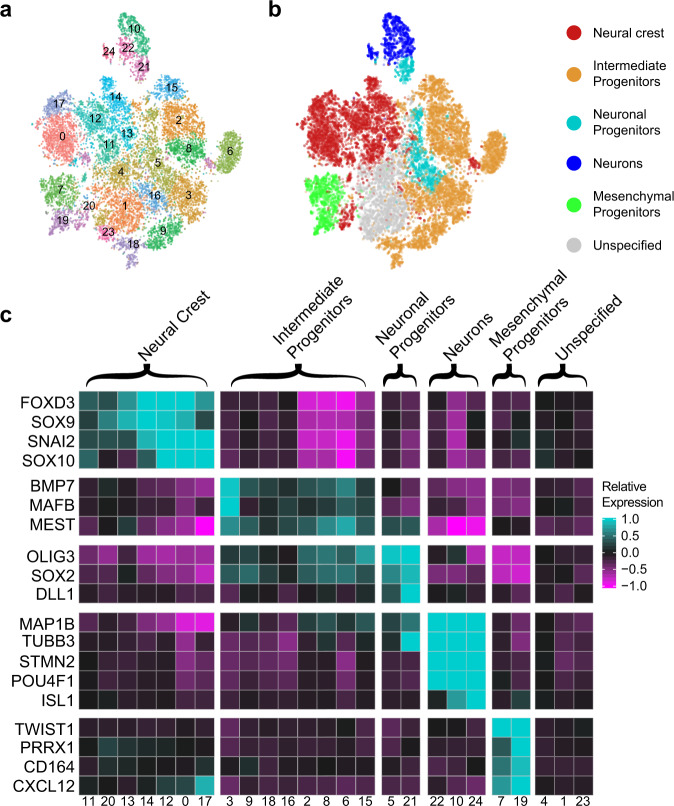
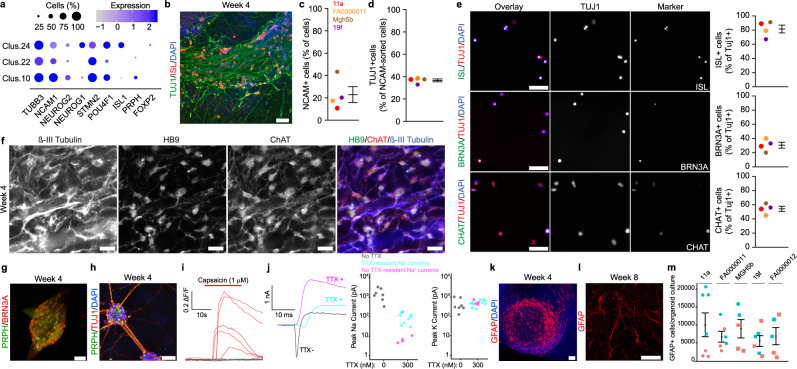
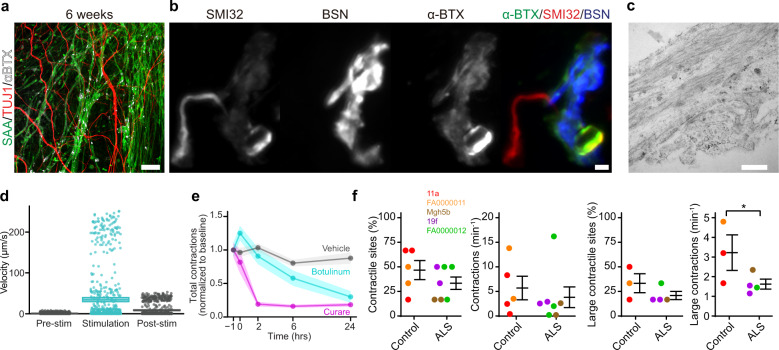
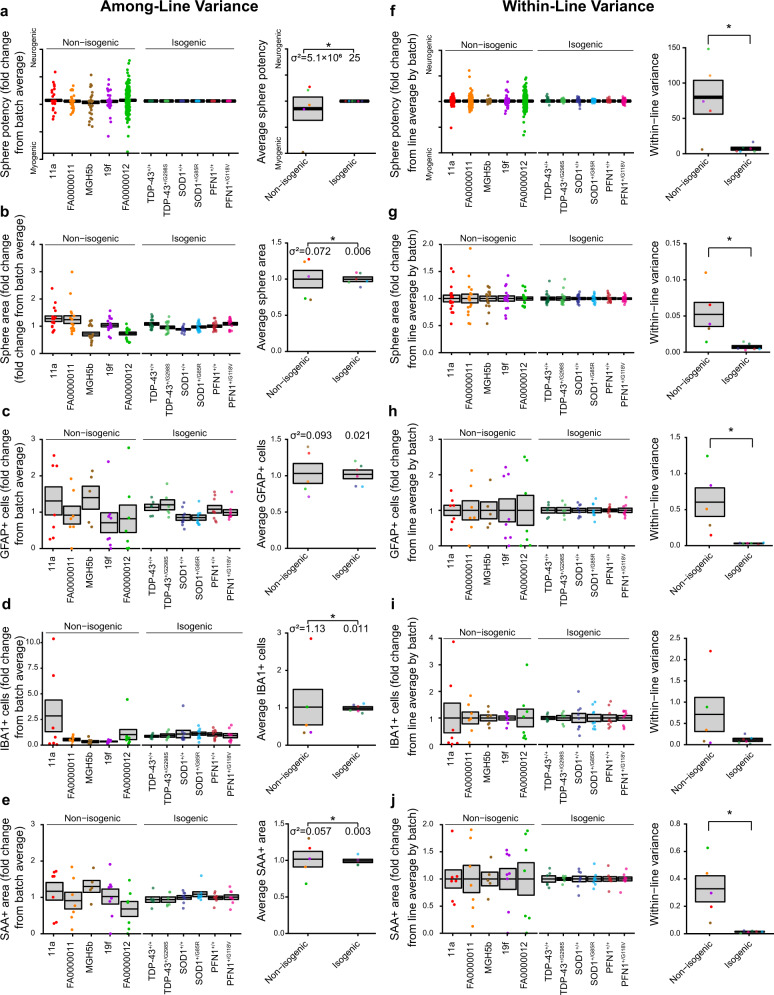
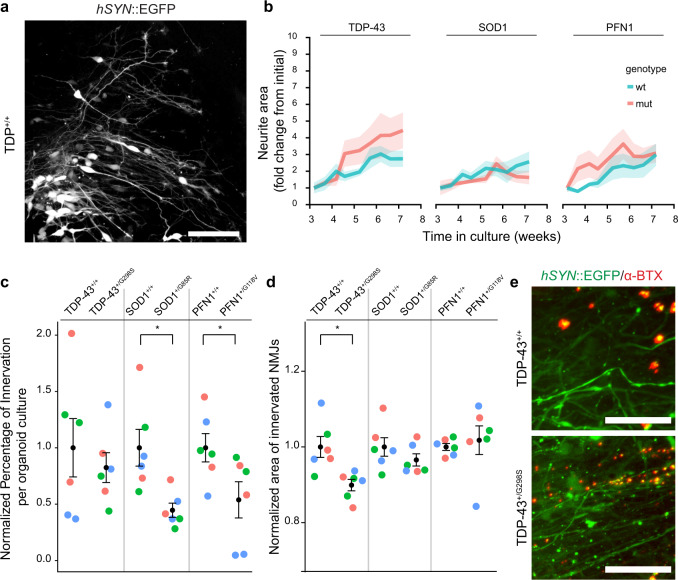
Human induced pluripotent stem cells (iPSC) hold promise for modeling diseases in individual human genetic backgrounds and thus for developing precision medicine. Here, we generate sensorimotor organoids containing physiologically functional neuromuscular junctions (NMJs) and apply the model to different subgroups of amyotrophic lateral sclerosis (ALS). Using a range of molecular, genomic, and physiological techniques, we identify and characterize motor neurons and skeletal muscle, along with sensory neurons, astrocytes, microglia, and vasculature. Organoid cultures derived from multiple human iPSC lines generated from individuals with ALS and isogenic lines edited to harbor familial ALS mutations show impairment at the level of the NMJ, as detected by both contraction and immunocytochemical measurements. The physiological resolution of the human NMJ synapse, combined with the generation of major cellular cohorts exerting autonomous and non-cell autonomous effects in motor and sensory diseases, may prove valuable to understand the pathophysiological mechanisms of ALS.


Conflict of interest statement

B.J.W. serves as a SAB member for Quralis and has consulted for Apic Bio and Q-State Biosciences. The remaining authors declare no competing interests.

Figures

Fig. 1
Fig. 1. Spheres containing neuromesodermal progenitors generate neurons and myocytes.
a Sensorimotor organoid differentiation protocol and end-point analysis times. Spheres patterned in suspension are plated after 1 week and grown under adherent conditions for up to 15 weeks. Scale bars are 40 µm for the first two panels, and 1 mm for the third panel. b SOX2+/TBXT+ neuromesodermal progenitors in a typical sphere, after two days in culture. Scale bar, 70 µm. c Distribution of individual spheres according to the expression of myogenic (TBXT), neuromesodermal (TBXT and SOX2), or neurogenic (SOX2) transcription factors, from three independent biological differentiation replicates of each line (colors indicate replicates). Control lines: 11a, FA0000011. ALS lines: MGH5b, 19f, and FA0000012. d Quantification of the SOX2+/TBXT+ area in whole wells of the same iPSC lines. Bars indicate median and IQR. (n = 5–6 organoid cultures obtained from three independent biological differentiation replicates of each of the same five iPSC lines). e Ectodermal lineage cells, including TUJ1+ neurons after 4 weeks in culture. Scale bar, 120 µm. f Mesodermal lineage cells include sarcomeric α-actinin (SAA)+ myocytes, surrounded by Pax7+ cells. Scale bar, 50 µm. g Whole-well confocal image of organoid cultures at 4 weeks showing SAA+ and TUJ1+ areas. Scale bar, 5 mm.
Fig. 2
Fig. 2. Single-cell RNA-seq analysis of early organoids confirms multiple neural and mesodermal lineages.
a Unsupervised cluster analysis of individual cells from early organoid cultures. Organoid cultures, three independent biological differentiation replicates of the control iPSC line 11a, were dissociated at 2 weeks in culture, and 20,835 single-cell libraries were sequenced at an average read depth of 35,000 reads/cell covering an average of 2555 unique genes/cell. The visualization shows tSNE plots of individual cells as dots and clusters of cells as colored groups. Numbers indicate cluster identity. b classification of clusters into six broad cell types. Marker genes for each cell cluster were identified, and clusters were then classified into groups accordingly. Clusters that could not be unambiguously identified are labeled as unspecified. The visualization shows the same tSNE plot from (a) recolored to reflect cell type. c Expression of cluster-defining genes enriched in each cell type classification. Marker genes that are enriched in each cluster within a cell-type classification were identified. Note that the neural progenitor cell type was defined by the presence of gene subsets from both the intermediate progenitor (OLIG3, SOX2, and DLL1) and neuronal (MAP1B, TUBB3) cell types. The plot shows the mean of scaled expression of indicated genes from within each cell cluster. High and low gene expression are indicated by cyan and magenta, respectively.
Fig. 3
Fig. 3. Sensorimotor organoid cultures generate cells of an ectodermal lineage, including sensory and motor neurons and astrocytes.
a Dot plot of gene expression within neuronal clusters from single-cell RNA-seq data. Color intensity indicates expression level; dot size indicates the proportion of cells expressing each gene. b ISL+/TUJ1+ neurons in 4-week-old organoid cultures. c NCAM+ cells after FACS. d TUJ1 + NCAM + FACS purified cells (from (c)). e Staining (left) and quantification (right) of neuronal subtypes after FACS by expression of ISL (top), BRN3A (middle), and CHAT (bottom). For (c)–(e), one independent biological differentiation for each of control lines: 11a (red), FA0000011 (orange); and ALS lines: MGH5b (brown), and 19f (purple) at 4 weeks. f HB9, ChAT, and β-III tubulin labeling of motor neurons in 4-week-old cultures (three independent biological differentiation replicates of FA0000011). g BRN3A and PRPH staining of ganglia in 4-week-old cultures. h Ganglia connected by PRPH+/TUJ1+ axonal processes. i Sample calcium imaging traces of individual cells in ganglia-containing fields with (red) and without (gray) response to capsaicin at 6–7 weeks. Capsaicin sensitivity was confirmed in three independent biological differentiation replicates of two lines (11a, MGH5b). j Example whole-cell patch-clamp current traces recorded in the absence (gray) or presence of 300 nM TTX (cyan, cell without TTX-resistant sodium currents; magenta, the cell with TTX-resistant sodium currents). Quantification of peak sodium (middle) and potassium (right) current amplitudes in the absence (gray) or presence of TTX (cyan, cell without TTX-resistant currents; magenta, a cell with TTX-resistant currents). Recordings from four independent biological differentiation replicate of FA0000011 (sodium currents: n = 4 cells without TTX resistant currents, and n = 10 cells with TTX resistant currents, Mann–Whitney, U = 0; P = 0.002; potassium currents: n = 4 cells without TTX resistant currents, and n = 10 cells with TTX resistant currents, U = 19; P = 0.945). k GFAP + astrocytes in 4-week-old cultures. l Astrocyte morphology at 8 weeks. m GFAP+ cells in 6-week-old cultures. (n = 5–7 cultures from two independent biological differentiation replicates for each of five indicated lines; Kruskal–Wallis, P = 0.388). Scale bars 25 (f), (g), 50 (e), (k), (l), and 100 (b), (h) µm. Bars indicate mean and SEM.
Fig. 4
Fig. 4. Organoid cultures differentiate into mesodermal lineage cells that include IBA1-expressing microglia, vasculature, and skeletal muscle.
a Microglia in sensorimotor organoids immunolabeled with IBA1 at 4 weeks. Scale bar, 100 µm. b High magnification image of an IBA1+ microglial cell and TUJ1+ axon at 4 weeks of culture. Scale bar, 50 µm. c Quantification of IBA1 + cells in organoid cultures at 6 weeks. Bars indicate mean and SEM (n = 6–8 organoid cultures obtained from two independent biological differentiation replicates of each of five lines; Kruskal–Wallis, P = 0.613). d Microvasculature stained with IB4 nearby TUJ1+ neurons at 4 weeks in culture. Scale bar, 100 µm. e IB4+ microvasculature adjacent to IBA1+ microglia at 4 weeks in culture. Scale bar, 50 µm. f Electron micrograph of endothelial-lined microvessels at high (left) and low (right) magnification after 9 weeks in culture. Scale bars, 10 µm. g Elongated and striated SAA+ myotubes containing peripheral nuclei at 4 weeks. Scale bar, 100 µm. h Electron micrographs of skeletal muscle at 9 weeks showing sarcomeric organization with distinct Z lines, A and I bands, and M bands within the H zone. Scale bar, 500 nm. i Quantification of the percent of SAA+ muscle area in organoid cultures at 6 weeks. Bars indicate mean and SEM (n = 5–6 organoid cultures obtained from two independent biological differentiation replicates of each of five lines; Kruskal–Wallis, P = 0.642). Control lines: 11a, FA0000011. ALS lines: MGH5b, 19f, and FA0000012.
Fig. 5
Fig. 5. Sensorimotor organoids form functional NMJs, which are impaired in ALS cultures.
a TUJ1+ neurons juxtaposed with SAA+ and α-bungarotoxin (αBTX)+ skeletal muscle at 6 weeks in culture. Scale bar, 100 µm. b NMJs at high magnification depicting SMI32+ neuronal terminals and presynaptic BSN staining that abuts postsynaptic αBTX staining. Scale bar, 2 µm. c Electron micrograph of an NMJ showing synaptic densities that separate presynaptic vesicles (bottom right) from longitudinally cut muscle fibers (top) at 9 weeks in culture. Scale bar, 500 nm. d Quantification of muscle contraction triggered by optogenetic activation of neurons. Neurons expressing hSYN::ChR2 evoke the rapid movement of muscle fibers when stimulated with blue light. e Pharmacology of muscle contractions in sensorimotor organoids. Spontaneous muscle contractions in 8-week-old cultures are inhibited by curare and botulinum toxin, the latter indicating dependence on synaptic function. Inhibition of contractions by each drug was assessed in five independent biological differentiation replicates of four iPSC lines (11a, MGH5b, 19f, and FA0000012). Plots show mean and 95% confidence intervals as line and shaded area, respectively. f Unbiased analysis of contraction site and frequency. Skeletal muscle contractions at six sites per organoid culture were counted and pooled from three independent biological differentiation replicates of five iPSC lines at 7–8 weeks. Percentage of contractile sites and contraction frequency per organoid culture were quantified separately for all contractions (left two panels, n = 5 control, and 7 ALS organoids; contractile sites: two-sided ANOVA type 3, F = 1.458, P = 0.255; all contractions: two-sided ANOVA type 3, F = 0.343, P = 0.571), and large contractions (right two panels, n = 3 control, and 4 ALS organoid cultures, large contractile sites: two-sided ANOVA type 3, F = 1.7532, P = 0.243; large contractions: two-sided ANOVA type 3, F = 8.289, P = 0.035). iPSC lines: 11a (red), FA0000011 (orange), MGH5b (brown), 19f (purple), and FA000012 (green). Bars indicate mean and SEM.
Fig. 6
Fig. 6. Gene-edited iPSC lines are paired with their isogenic controls and generate sensorimotor organoids with similar compositions.
a Strategy for CRISPR/Cas9-mediated insertion of point mutations in either TARDBP (TDP-43), SOD1, or PFN1 into the FA0000011 control line. b Multiple correspondence analysis of TDP-43+/+ (dark green), TDP-43+/G298S (light green), SOD1+/+(dark blue), SOD1+/G85R (light blue), PFN1+/+ (red), PFN1+/G118V (pink), and the original healthy control line FA0000011 (orange). c Distribution of individual spheres according to their expression of myogenic (TBXT) or neurogenic (SOX2) transcription factors from three independent biological differentiation replicates (colors). d Spinal motor neurons expressing HB9, ChAT, and β-III Tubulin, in organoid cultures of the SOD1+/G85R iPSC line at 4 weeks (confirmed in three independent biological differentiation replicates). Scale bar, 40 µm. eg, Quantification of GFAP+ cells (e), SAA+ area (f), and IBA1+ cells (g) in organoid cultures at 6 weeks, normalized to paired isogenic controls, per differentiation. Bars indicate mean and SEM. (n = 6–9 organoid cultures obtained from 2–3 independent biological differentiation replicates, in distinct colors, of each of six lines; Kruskal–Wallis, P = 0.934 (e), P = 0.432 (f), P = 0.983 (g)).
Fig. 7
Fig. 7. Isogenic iPSC lines reduce among- and within-line variability of organoid cultures.
Analysis of among-line (a)–(e) and within-line (f)–(j) variance for individual sphere potency (a), (f) and area (b), (g), as well as GFAP+ cells (c), (h), IBA1+ cells (d), (i), and SAA + area (e), (j) within mature organoid cultures from two to three independent biological differentiation replicates for each line. ae left, Mean and SEM of fold change from batch average, along with points for individual spheres (a), (b) or cultures (c), (e). Right, Mean and SEM among non-isogenic and isogenic lines with points for each unique iPSC line. Significance assessed by F-test for Equality of Variances, with group variances (σ2) indicated at bottom, for n = 5 non-isogenic, 6 isogenic lines: (a) F = 2.0 × 105, P = 6.8 × 10−13; (b) F = 2.0 × 105, P = 6.8 × 10−13; (c) F = 4.37, P = 0.137; (d) F = 106.33, P = 1.0 × 10−4; (e) F = 18.90, P = 0.006. fj, left, Mean and SEM of fold change from batch average within-line, along with points for individual spheres (f), (g) or cultures (h)–(j). Right, Mean and SEM of within-line variances for non-isogenic and isogenic lines with points for each unique iPSC line. Significance assessed by one-way ANOVA for n = 5 non-isogenic, 6 isogenic lines: (f) (non-isogenic vs isogenic) 79.9 ± 24.0 vs 7.0 ± 2.1, F = 11.21, P = 0.009; (g) 0.052 ± 0.017 vs 0.007 ± 0.002, F = 8.825, P = 0.016; (h) 0.603 ± 0.198 vs 0.030 ± 0.004, F = 10.25, P = 0.011; (i) 0.711 ± 0.401 vs 0.114 ± 0.035, F = 2.70, P = 0.135; (j) 0.328 ± 0.095 vs 0.015 ± 0.003, F = 13.2, P = 0.005. Colors indicate individual iPSC lines.
Fig. 8
Fig. 8. Isogenic ALS mutations show distinct NMJ phenotypes.
a Live neuronal labeling by expression of hSYN::EGFP delivered by an AAV9 vector. Scale bar, 100 µm. b Quantification of neurite area as fold change of initial, from 3 to 9 weeks in culture. The line indicates mean and shaded area indicates SEM. (Effect of time on neurite area, n = 6 organoid cultures obtained from three independent biological differentiation replicates of each of six lines, linear model, F = 8.743, P = 1.3 × 10−10, individual comparisons: TDP-43 pair: F = 37.040, P = 2.0 × 10−8; SOD1 pair: F = 16.3725, P = 1.0 × 10−4; PFN1 pair: F = 18.639, P = 3.6 × 10−5; interaction between time and iPSC line on neurite area, n = 6 organoid cultures obtained from 3 independent biological differentiations of each of six lines, linear model, F = 0.562, P = 0.985). c Normalized percentage of NMJs innervated at three months in culture (normalized to the paired isogenic controls). Bars indicate mean and SEM (n = 6 organoid cultures obtained from three independent biological differentiation replicates, indicated by colors, of each of six lines, Univariate ANOVA: F = 5.938, P = 6.3 × 10−4; separate two-tailed t-test; TDP-43 pair: P = 0.560; SOD1 pair: P = 0.010; PFN1 pair: P = 0.047). d Normalized area of the innervated NMJs at three months in culture (normalized to the paired isogenic controls). Bars indicate mean and SEM (n = 6 organoid cultures obtained from three independent biological differentiation replicates, indicated by colors, of each of six lines, Univariate ANOVA: F = 3.001, P = 0.026; separate two-tailed t-test; TDP-43 pair: P = 0.009; SOD1 pair: P = 0.203; PFN1: P = 0.659). e Example of the reduction in NMJ area observed in the TDP-43+/G298S iPSC line compared to the isogenic control. Scale bar, 100 µm.

References

    1. Fischer LR, et al. Amyotrophic lateral sclerosis is a distal axonopathy: evidence in mice and man. Exp. Neurol. 2004;185:232–240. doi: 10.1016/j.expneurol.2003.10.004. - DOI - PubMed
    1. Taylor JP, Brown RH, Cleveland DW. Decoding ALS: from genes to mechanism. Nature. 2016;539:197–206. doi: 10.1038/nature20413. - DOI - PMC - PubMed
    1. Klim JR, et al. ALS-implicated protein TDP-43 sustains levels of STMN2, a mediator of motor neuron growth and repair. Nat. Neurosci. 2019;22:167–179. doi: 10.1038/s41593-018-0300-4. - DOI - PMC - PubMed
    1. Melamed, Z. et al. Premature polyadenylation-mediated loss of stathmin-2 is a hallmark of TDP-43-dependent neurodegeneration. Nat. Neurosci. 22, 180–190. - PMC - PubMed
    1. Pasinelli P, Brown RH. Molecular biology of amyotrophic lateral sclerosis: insights from genetics. Nat. Rev. Neurosci. 2006;7:710–723. doi: 10.1038/nrn1971. - DOI - PubMed

Publication types