. 2021 Aug 6;12(1):4746.
doi: 10.1038/s41467-021-25009-4.

MAIT cells regulate NK cell-mediated tumor immunity

Affiliations

MAIT cells regulate NK cell-mediated tumor immunity

Emma V Petley et al. Nat Commun. .

Abstract

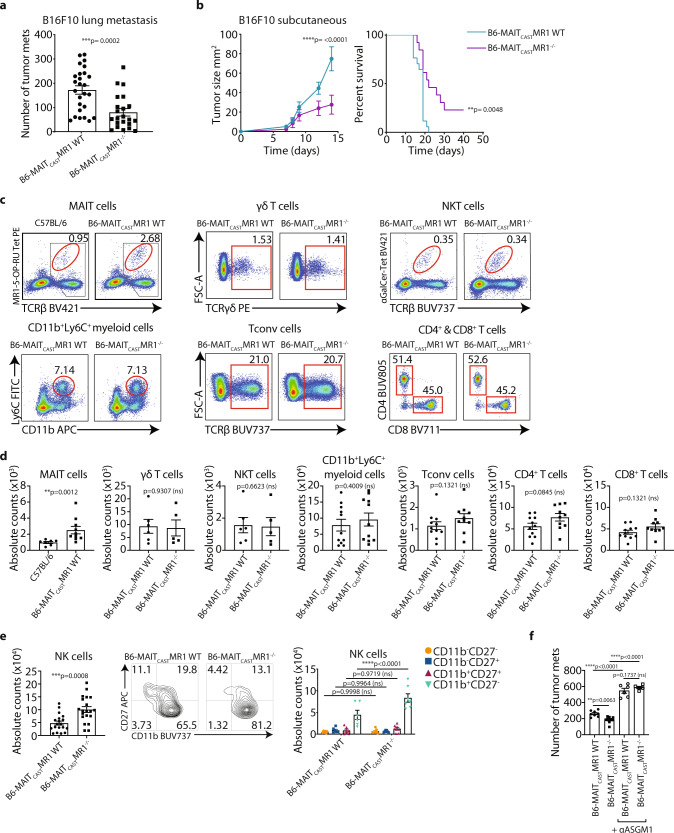
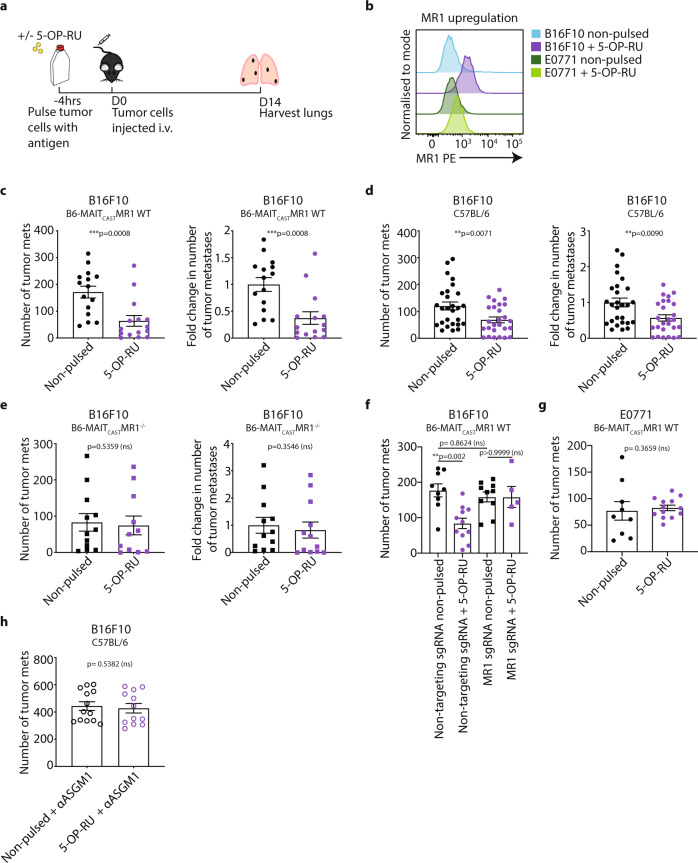
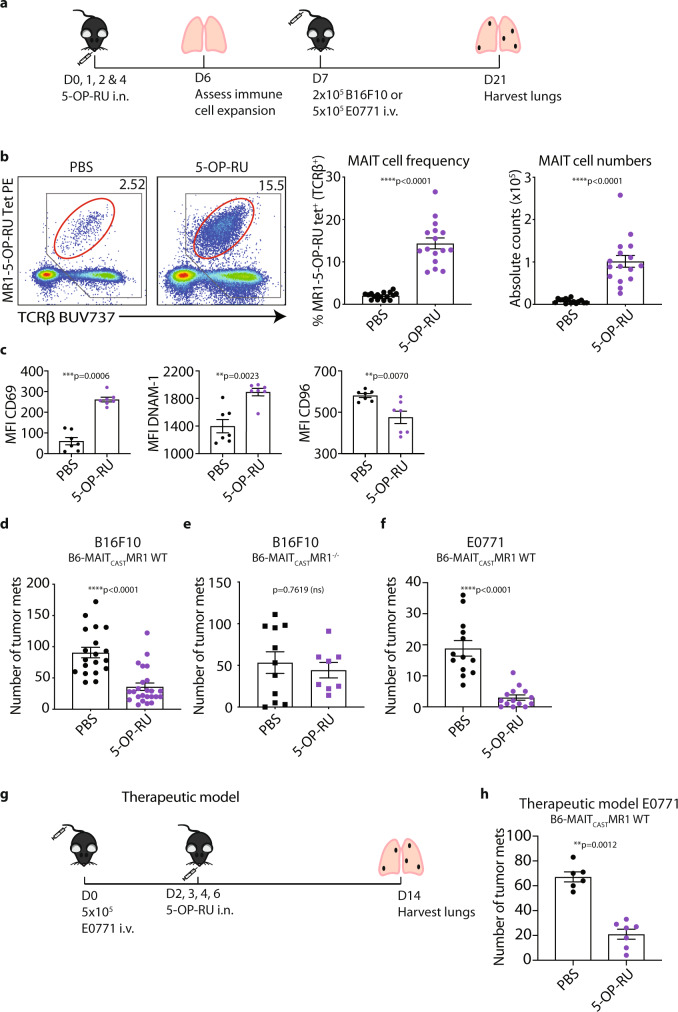
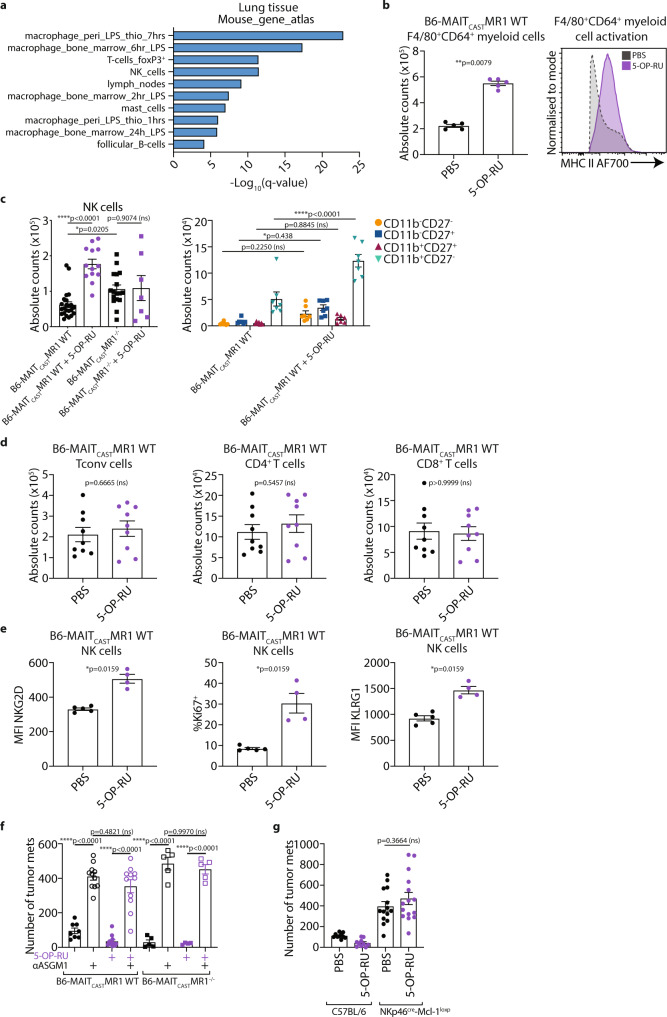
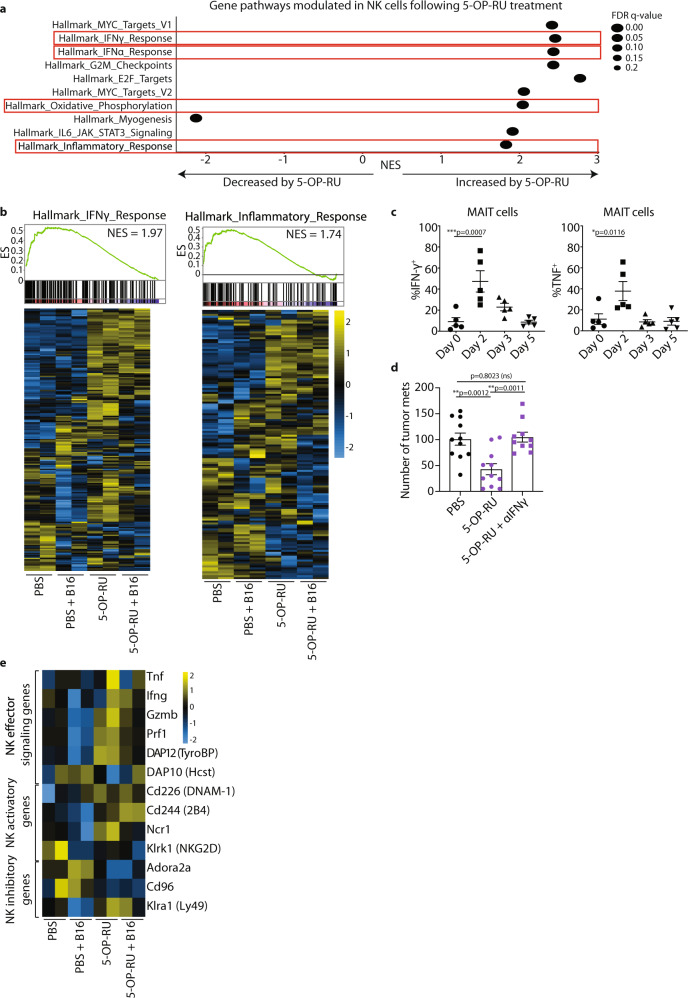
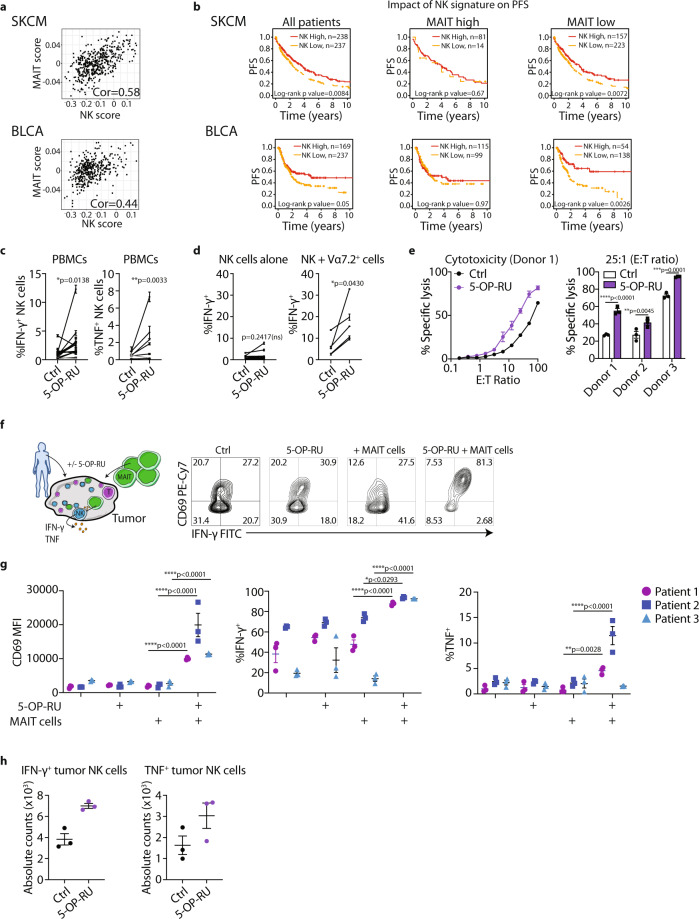
The function of MR1-restricted mucosal-associated invariant T (MAIT) cells in tumor immunity is unclear. Here we show that MAIT cell-deficient mice have enhanced NK cell-dependent control of metastatic B16F10 tumor growth relative to control mice. Analyses of this interplay in human tumor samples reveal that high expression of a MAIT cell gene signature negatively impacts the prognostic significance of NK cells. Paradoxically, pre-pulsing tumors with MAIT cell antigens, or activating MAIT cells in vivo, enhances anti-tumor immunity in B16F10 and E0771 mouse tumor models, including in the context of established metastasis. These effects are associated with enhanced NK cell responses and increased expression of both IFN-γ-dependent and inflammatory genes in NK cells. Importantly, activated human MAIT cells also promote the function of NK cells isolated from patient tumor samples. Our results thus describe an activation-dependent, MAIT cell-mediated regulation of NK cells, and suggest a potential therapeutic avenue for cancer treatment.


Conflict of interest statement

J.M. and D.P.F. are named inventors on a patent application (PCT/AU2013/000742, WO2014005194) and J.Y.W.M., J.M. and D.P.F. are named inventors on another patent application (PCT/AU2015/050148, WO2015149130) involving MR1 ligands for MR1-restricted MAIT cells owned by University of Queensland, Monash University and University of Melbourne. A.P. current position is supported by Roche-Genentech. N.D.H. is co-founder, shareholder, and advisor of oNKo-Innate Pty Ltd. P.J.N. has research funding from BMS, Roche Genentech, Compugen, and Allergan. F.S.F.G. is a consultant and has funded research agreements with Biotheus Inc. P.K.D. declares the following conflicts: research funding from Myeloid Therapeutics, Prescient Therapeutics and Juno Therapeutics. P.A.B. declares the following conflicts: research funding from AstraZeneca, Bristol-Myers Squibb, and Gilead Sciences. The remaining authors declare no competing interests.

Figures

Fig. 1
Fig. 1. MAIT cell-deficient mice elicit enhanced NK cell-mediated anti-tumor immune responses.
a 2 × 105 B16F10 tumor cells were injected i.v. into B6-MAITcast MR1 WT or B6-MAITcast MR1−/− mice. Lungs were harvested and the number of tumor metastases enumerated 14 days after inoculation. Data is presented as mean ± SEM of n = 26 (B6-MAITcast MR1 WT) or n = 22 (B6-MAITcast MR1−/−) independent mice from four combined experiments, two-tailed Mann–Whitney test. b 3 × 104 B16F10 tumor cells were injected s.c. into B6-MAITcast MR1 WT or B6-MAITcast MR1−/− mice and tumor size monitored. Data is presented as mean ± SEM of n = 10 (B6-MAITcast MR1 WT) or n = 6 (B6-MAITcast MR1−/−) independent mice from a representative experiment of n = 2, Two-way ANOVA. Survival was defined when tumor size exceeded 100 mm2. Data is presented as mean ± SEM of n = 17 (B6-MAITcast MR1 WT) or n = 13 (B6-MAITcast MR1−/−) independent mice from two combined experiments, Log-rank (Mantel-Cox) test. c, d Representative flow cytometry plots (c) and absolute numbers (d) of MAIT (CD45.2+CD19TCRβ+MR1-5-OP-RU-tetramer+), γδ T (CD45.2+CD19TCRγδ+), NKT (CD45.2+CD19TCRβ+αGalCer-tetramer+), myeloid (CD45.2+CD19CD11b+Ly6C+), conventional T (Tconv; CD45.2+CD19TCRβ+) and CD4+ and CD8+ T cells in the lungs of indicated mice. Data is presented as mean ± SEM of n = 7 (C57BL/6) and n = 10 (B6-MAITcast MR1 WT) independent mice from three combined experiments (MAIT cells), or n = 6 (B6-MAITcast MR1 WT) and n = 5 (B6-MAITcast MR1−/−) independent mice from two combined experiments (γδ T cells, NKT cells), or n = 11 independent mice from three combined experiments (CD11b+Ly6C+ myeloid cells), or n = 11 (B6-MAITcast MR1 WT) and n = 10 (B6-MAITcast MR1−/−) independent mice from three combined experiments (conventional T cells, CD4+ T cells, CD8+ T cells), two-tailed Mann–Whitney test. Numbers shown in MAIT cells panel indicate the proportion of MAIT cells (red gate) from TCRβ+ gate (grey gate).  e Absolute number and phenotype of NK cells (CD19TCRβNK1.1+) and CD11b/CD27 profile from lungs of B6-MAITcast MR1 WT or B6-MAITcast MR1−/− mice. Data is presented as mean ± SEM of n = 19 (B6-MAITcast MR1 WT) and n = 20 (B6-MAITcast MR1−/−) independent mice from five combined experiments, two-tailed Mann–Whitney test (left) and n = 6 (B6-MAITcast MR1 WT) or n = 7 (B6-MAITcast MR1−/−) independent mice from two combined experiments, Two-way ANOVA (right). f B16F10 tumor cells were inoculated into B6-MAITcast MR1 WT or B6-MAITcast MR1−/− mice as per a and NK cells depleted with anti-asialo GM-1 (αASGM1) on days -1 and 0. Data is presented as mean ± SEM of n = 8 (untreated B6-MAITcast MR1 WT), n = 9 (untreated B6-MAITcast MR1−/−), n = 6 (anti-asialo GM-1 treated B6-MAITcast MR1 WT) and n = 5 (anti-asialo GM-1 treated B6-MAITcast MR1−/−) independent mice and is representative of two independent experiments, One-way ANOVA. *p < 0.05, **p < 0.01, ***p < 0.001, ****p <  0.0001, ns = non-significant.
Fig. 2
Fig. 2. Presentation of 5-OP-RU by tumor cells results in decreased metastasis in a MAIT and NK cell-dependent manner.
a Schematic of experimental setup. b Expression of MR1 in B16F10 and E0771 cells cultured with or without 10 μM of 5-OP-RU antigen for 4 h at 37 °C. Data is representative of three independent experiments. c B16F10 cells were cultured with or without 10 μM of 5-OP-RU antigen for 4 h at 37 °C and then 2 × 10⁵ injected i.v. into B6-MAITcast MR1 WT mice. Tumor metastases were enumerated 14 days after inoculation. Data is presented as mean ± SEM of n = 15 independent mice per group from two combined experiments, two-tailed Mann–Whitney test. d B16F10 cells were cultured with or without 10 μM of 5-OP-RU antigen for 4 h at 37 °C and 2 × 10⁵ were injected i.v. into C57BL/6 mice. Tumor metastases were enumerated 14 days after inoculation. Data is presented as mean ± SEM of n = 27 (non-pulsed) and n = 26 (5-OP-RU-pulsed) independent mice from four combined experiments, two-tailed Mann–Whitney test. e B16F10 cells were cultured with or without 10 μM of 5-OP-RU antigen for 4 h at 37 °C and 2 × 10⁵ were injected i.v. into B6-MAITcast MR1−/− mice. Tumor metastases were enumerated 14 days after inoculation. Data is presented as mean ± SEM of n = 12 (non-pulsed) and n = 11 (5-OP-RU-pulsed tumor cells) independent mice from one independent experiment, two-tailed Mann–Whitney test. Data from Fig. 1a non-pulsed groups also present in c and e. f B16F10 non-targeting sgRNA and B16F10 MR1 sgRNA cells were cultured with or without 10 μM of 5-OP-RU antigen for 4 h at 37 °C and 2 × 10⁵ were injected i.v. into B6-MAITcast MR1 WT mice. Tumor metastases were enumerated 14 days after inoculation. Data is presented as mean ± SEM of n = 9 (non-targeting sgRNA non-pulsed), n = 11 (non-targeting sgRNA +  5-OP-RU), n = 10 (MR1 sgRNA non-pulsed) and n = 5 (MR1 sgRNA + 5-OP-RU) independent mice and is representative of two independent experiments, One-way ANOVA. g E0771 cells were cultured with or without 10 μM of 5-OP-RU antigen for 4 h at 37 °C and 5 × 10⁵ were injected i.v. into B6-MAITcast MR1 WT mice. Tumor metastases were enumerated 14 days after inoculation. Data is presented as mean ± SEM of n = 9 (non-pulsed) or n = 13 (5-OP-RU pulsed) independent mice representing two combined experiments, two-tailed Mann–Whitney test. h B16F10 cells were cultured with or without 10 μM of 5-OP-RU antigen for 4 h at 37 °C and 2 × 10⁵ were injected i.v. into C57BL/6 mice. NK cells were depleted with anti-asialo GM-1 (αASGM1) on days –1 and 0. Tumor metastases were enumerated 14 days after inoculation. Data is presented as mean ± SEM of n = 13 (non-pulsed + αASGM1) or n = 12 (5-OP-RU-pulsed + αASGM1) independent mice representing two combined experiments, two-tailed Mann–Whitney test. **p < 0.01, ***p < 0.001, ns = non-significant.
Fig. 3
Fig. 3. MAIT cell expansion via 5-OP-RU treatment results in enhanced anti-tumor immunity.
a Schematic of experimental setup. b Proportion and absolute number of MAIT cells at day 6 post treatment following intranasal administration of 50 µL of 233 μM 5-OP-RU or PBS at days 0, 1, 2, and 4 in B6-MAITcast MR1 WT mice. Data is presented as representative flow cytometry plots and mean ± SEM of n = 16 independent mice per group from four combined experiments, two-tailed Mann–Whitney test. c Expression of indicated cell surface markers on MAIT cells following intranasal treatment of mice as per (a). Data is presented as mean ± SEM of n = 7 per group from two combined experiments, two-tailed Mann–Whitney test. d Following treatment of mice as per (a). 2 × 105 B16F10 tumor cells were injected i.v. into B6-MAITcast MR1 WT mice. Tumor cell metastases were enumerated from lungs 14 days post tumor inoculation. Data is presented as mean ± SEM of n = 19 (non-treated) and n = 24 (5-OP-RU treated) independent mice from four combined experiments, two-tailed Mann–Whitney test. e Following treatment of mice as per (a). 2 × 105 B16F10 tumor cells were injected i.v. into B6-MAITcast MR1−/− mice. Tumor cell metastases were enumerated from lungs 14 days post tumor inoculation. Data is presented as mean ± SEM of n = 11 (non-treated) and n = 8 (5-OP-RU treated) independent mice from two combined experiments, two-tailed Mann–Whitney test. f Following treatment of mice as per (a). 5 × 105 E0771 tumor cells were injected i.v. into B6-MAITcast MR1 WT mice. Tumor cell metastases were enumerated from lungs 14 days post tumor inoculation. Data is presented as mean ± SEM of n = 13 (non-treated) and n = 14 (5-OP-RU treated) independent mice from two combined experiments, two-tailed Mann–Whitney test. g Schematic of experimental setup for therapeutic model. h 5 × 105 E0771 tumor cells were injected i.v. into B6-MAITcast MR1 WT mice on day 0. Mice received 50 µL of 233 μM 5-OP-RU or PBS on days 2, 3, 4, and 6 and tumor cell metastases were enumerated from lungs 14 days post tumor inoculation. Data is presented as mean ± SEM of n = 6 (non-treated) and 7 (5-OP-RU treated) independent mice and is representative of two independent experiments, two-tailed Mann–Whitney test. *p < 0.05, **p < 0.01, ***p < 0.001, ****p < 0.0001, ns = non-significant.
Fig. 4
Fig. 4. MAIT cell expansion results in enhanced NK cell activation and anti-tumor immunity.
a B6-MAITcast MR1 WT mice were treated as per Fig. 3a. Lungs were harvested and RNA extracted from single-cell suspensions. Gene expression determined by Nanostring and differentially expressed genes with 5-OP-RU treatment compared to PBS controls were compared to the mouse gene atlas. b Absolute number and activation of F4/80+CD64+ myeloid cells from B6-MAITcast MR1 WT mice treated as per Fig. 3a. Data is presented as mean ± SEM of n = 5 mice per group from one independent experiment, two-tailed Mann–Whitney test. c Absolute number of NK cells from B6-MAITcast MR1 WT and B6-MAITcast MR1−/− mice treated as per Fig. 3a (left) and CD11b and CD27 phenotype of NK cells in B6-MAITcast MR1 WT treated with PBS or 5-OP-RU (right). Data is presented as mean ± SEM of n = 23 (non-treated B6-MAITcast MR1 WT), n = 13 (5-OP-RU treated B6-MAITcast MR1 WT), n = 17 (non-treated B6-MAITcast MR1−/−) and n = 7 (5-OP-RU-treated B6-MAITcast MR1−/−) independent mice from six combined experiments, One-way ANOVA (left). Data is presented as mean ± SEM of n = 7 independent mice per group from two combined experiments, representative of five independent experiments two-way ANOVA (right). Data from Fig. 1e. (left) also present in c. (left) present in d Absolute number of conventional T (Tconv), CD4+ and CD8+ T cells from B6-MAITcast MR1 WT mice treated as per Fig. 3a. Data is presented as mean ± SEM of n = 9 independent mice per group from two combined experiments, two-tailed Mann–Whitney test. e Expression of NKG2D, Ki67 and KLRG1 on NK cells from B6-MAITcast MR1 WT mice treated as per Fig. 3a. Data is presented as mean ± SEM of n = 5 (PBS treated) and n = 4 (5-OP-RU treated) independent mice from one independent experiment, two-tailed Mann–Whitney test. f B6-MAITcast MR1 WT and B6-MAITcast MR1−/− mice were treated as per Fig. 3a. NK cells were depleted with anti-asialo GM-1 (αASGM1) on days 6 and 7 and 2 × 105 B16F10 cells were injected i.v. on day 7. Tumor metastases were enumerated 14 days after inoculation. Data is presented as mean ± SEM of n = 8 (non-treated B6-MAITcast MR1 WT), n = 11 (αASGM1 treated B6-MAITcast MR1 WT), n = 12 (5-OP-RU treated B6-MAITcast MR1 WT), n = 11 (αASGM1 and 5-OP-RU treated B6-MAITcast MR1 WT), n = 5 (non-treated B6-MAITcast MR1−/−), n = 5 (αASGM1 treated B6-MAITcast MR1−/−), n = 4 (5-OP-RU treated B6-MAITcast MR1−/−) and n = 5 (αASGM1 and 5-OP-RU treated B6-MAITcast MR1−/−) independent mice from two combined experiments, one-way ANOVA. g C57BL/6 and NKp46Cre-Mcl-1loxp mice were treated as per Fig. 3a and 2 × 105 B16F10 cells were injected i.v. on day 7. Tumor metastases were enumerated 14 days after inoculation. Data is presented as mean ± SEM of n = 10 (non-treated C57BL/6 and), n = 10 (5-OP-RU treated C57BL/6), n = 14 (non-treated NKp46cre-Mcl-1loxp) or n = 15 (5-OP-RU treated  NKp46cre-Mcl-1loxp) independent mice from two combined experiments, one-way ANOVA. **p < 0.01, ***p < 0.001, ****p < 0.0001, ns = non-significant.
Fig. 5
Fig. 5. MAIT cell-mediated enhancement of NK cell anti-tumor function is IFN-γ dependent.
a, b B6-MAITcast MR1 WT mice were treated as per Fig. 3a. 5 × 105 B16F10 cells or PBS control were injected i.v. at day 6 and 12 h later lungs were processed. NK1.1+ NK cells were FACS sorted and RNA extracted for subsequent 3′ RNA-sequencing analysis. Cells were harvested from three mice per group and data represented as technical duplicates. Heatmaps show relative expression of genes in indicated pathways. a Differentially expressed genes were subject to hallmark pathway analysis. Indicated signatures were significantly upregulated post intranasal 5-OP-RU treatment. b Heatmaps showing expression of indicated genes in pathways identified. c B6-MAITcast MR1 WT mice were treated as per Fig. 3a. Expression of IFN-γ and TNF from MAIT cells at indicated days post 5-OP-RU expansion. Data is presented as mean ± SEM of n = 5 independent mice per group from one independent experiment, one-way ANOVA. d C57BL/6 mice were treated as per Fig. 3a, inoculated with 2 × 105 B16F10 cells and received 250 μg of anti-IFN-γ i.p. on day 0 and 1. Data is presented as mean ± SEM of n = 11 (non-treated and 5-OP-RU treated) and n = 10 (5-OP-RU + αIFN-γ treated) independent mice, from two combined experiments, one-way ANOVA. e Heatmaps showing expression of indicated genes in pathways identified from Fig. 5b. *p < 0.05, **p < 0.01, ****p < 0.0001, ns = non-significant.
Fig. 6
Fig. 6. Activated Human MAIT cells cross talk with NK cells leading to increased activation, cytokine production and cytotoxicity.
a Correlation (cor) between MAIT score and NK score as indicated for skin cutaneous melanoma (SKCM) and bladder carcinoma (BLCA). b Analysis of progression-free survival (PFS) of SKCM and BLCA patients stratified into indicated cohorts based upon high or low expression of NK and MAIT cell related genes. c PBMCs were cultured for 16 h with IL-2 (20 IU/mL) in the presence or absence of 100 nM 5-OP-RU. Production of cytokines by CD3CD56+ NK cells determined by flow cytometry. One donor (gray) was identified to have a low frequency of MAIT cells (0.80% CD19CD3+CD161+Vα7.2+ of live cells). Data is presented as mean ± SEM of triplicate cultures from 17 independent donors (IFN-γ+) or triplicate cultures from 8 independent donors (TNF+), two-tailed Paired-t test. d Isolated NK cells and MAIT (Vα7.2+) cells were cultured for 16 h with IL-2 (20 IU/mL) in the presence or absence of 100 nM 5-OP-RU. Production of cytokines by CD3CD56+ NK cells determined by flow cytometry. Each data point represents the mean ± SEM of triplicate cultures from nine independent donors (NK cells only) or triplicate culture from five independent donors (NK cells + Vα7.2+ cells), two-tailed Paired-t-test. e PBMCs were stimulated as in (c) and co-cultured with Cr51-labeled K562 target cells. PBMC: tumor ratios (E:T ratio) are as indicated. Data is represented by mean ± SEM of triplicate cultures from a representative experiment of n = 3. Percentage-specific lysis at 1:25 PBMCs: tumor targets. Data is represented by mean ± SEM of triplicate cultures from three separate donors, two-way ANOVA. f, g Tumor infiltrating lymphocytes from melanoma patients were cultured with IL-2 (20 IU/mL) in the presence or absence of 100 nM 5-OP-RU with or without additional MAIT cells isolated from healthy donor PBMCs. Expression of CD69 and percentage of IFN-γ or TNF-producing NK cells (CD3CD56+) assessed by flow cytometry. Data is presented as mean ± SEM of triplicate cultures from three independent tumor samples, two-way ANOVA. h Tumor infiltrating lymphocytes from a melanoma tumor sample were cultured as in (c) and expression of IFN-γ and TNF on NK cells were assessed. Data is presented as mean ± SEM of triplicate cultures. *p < 0.05, **p < 0.01, ***p < 0.001, ****p < 0.0001, ns = non-significant.

References

    1. Porcelli S, Yockey CE, Brenner MB, Balk SP. Analysis of T cell antigen receptor (TCR) expression by human peripheral blood CD4-8- alpha/beta T cells demonstrates preferential use of several V beta genes and an invariant TCR alpha chain. J. Exp. Med. 1993;178:1–16. doi: 10.1084/jem.178.1.1. - DOI - PMC - PubMed
    1. Tilloy F, et al. An invariant T cell receptor alpha chain defines a novel TAP-independent major histocompatibility complex class Ib-restricted alpha/beta T cell subpopulation in mammals. J. Exp. Med. 1999;189:1907–1921. doi: 10.1084/jem.189.12.1907. - DOI - PMC - PubMed
    1. Lepore M, et al. Functionally diverse human T cells recognize non-microbial antigens presented by. Elife. 2017;6:MR1. - PMC - PubMed
    1. Reantragoon R, et al. Antigen-loaded MR1 tetramers define T cell receptor heterogeneity in mucosal-associated invariant T cells. J. Exp. Med. 2013;210:2305–2320. doi: 10.1084/jem.20130958. - DOI - PMC - PubMed
    1. Gold MC, et al. Human mucosal associated invariant T cells detect bacterially infected cells. PLoS Biol. 2010;8:e1000407. doi: 10.1371/journal.pbio.1000407. - DOI - PMC - PubMed

Publication types