. 2021 Aug 6;12(1):4777.
doi: 10.1038/s41467-021-24961-5.

Arsenene-mediated multiple independently targeted reactive oxygen species burst for cancer therapy

Affiliations

Arsenene-mediated multiple independently targeted reactive oxygen species burst for cancer therapy

Na Kong et al. Nat Commun. .

Abstract

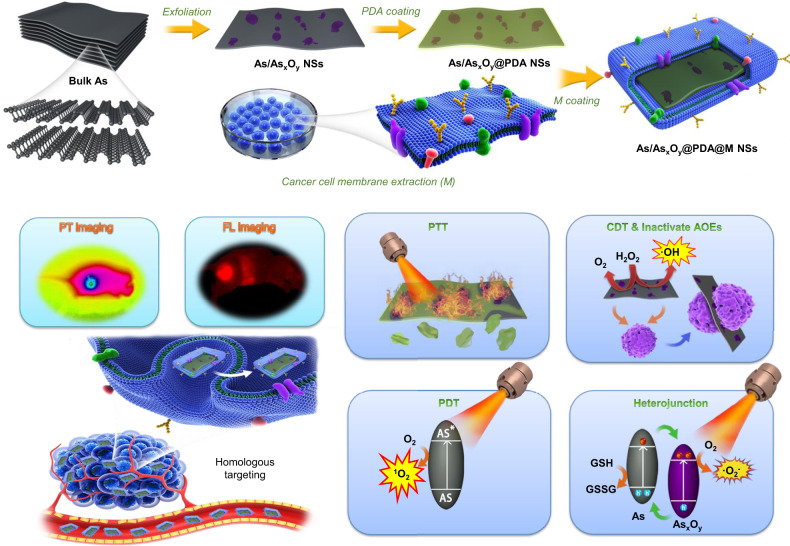
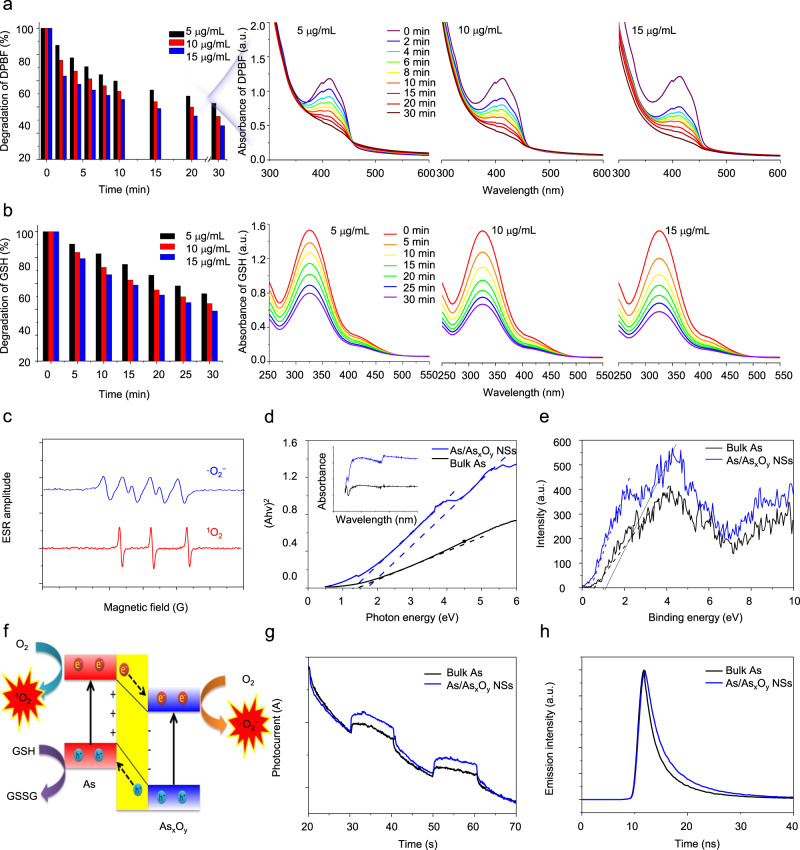
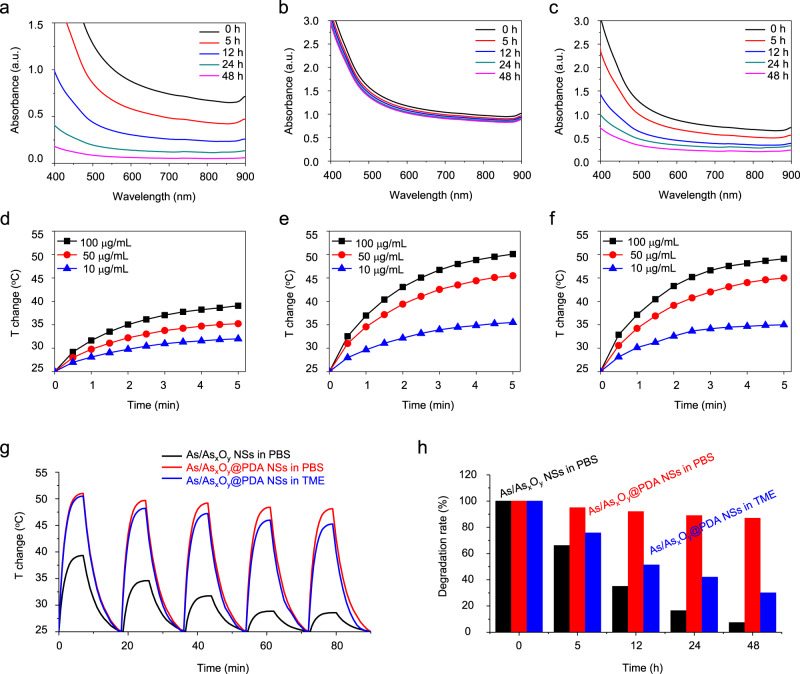
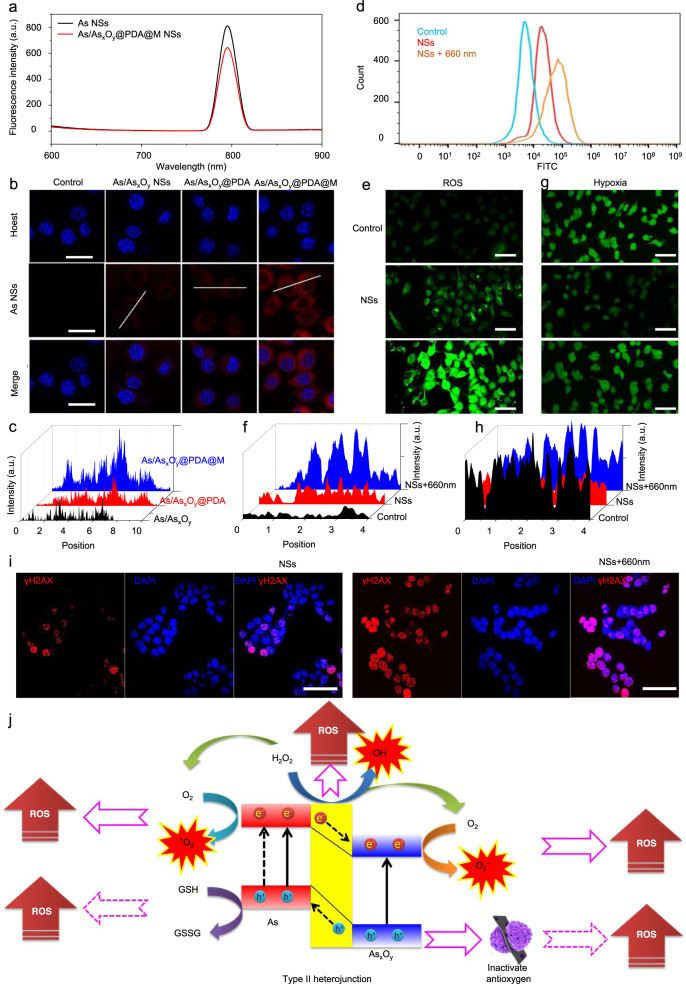
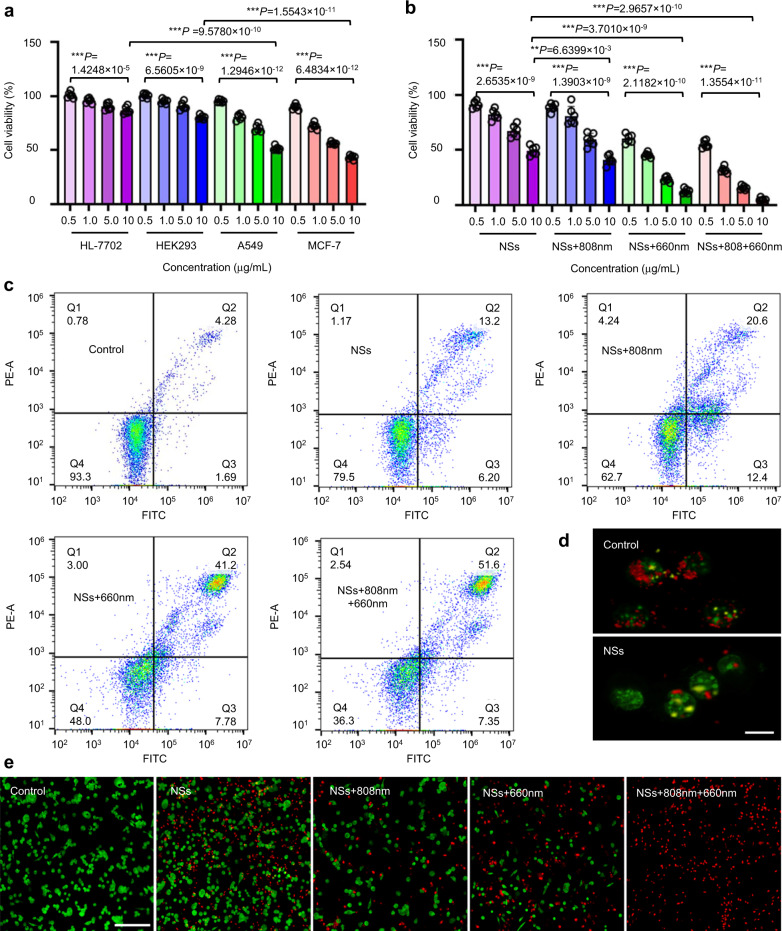
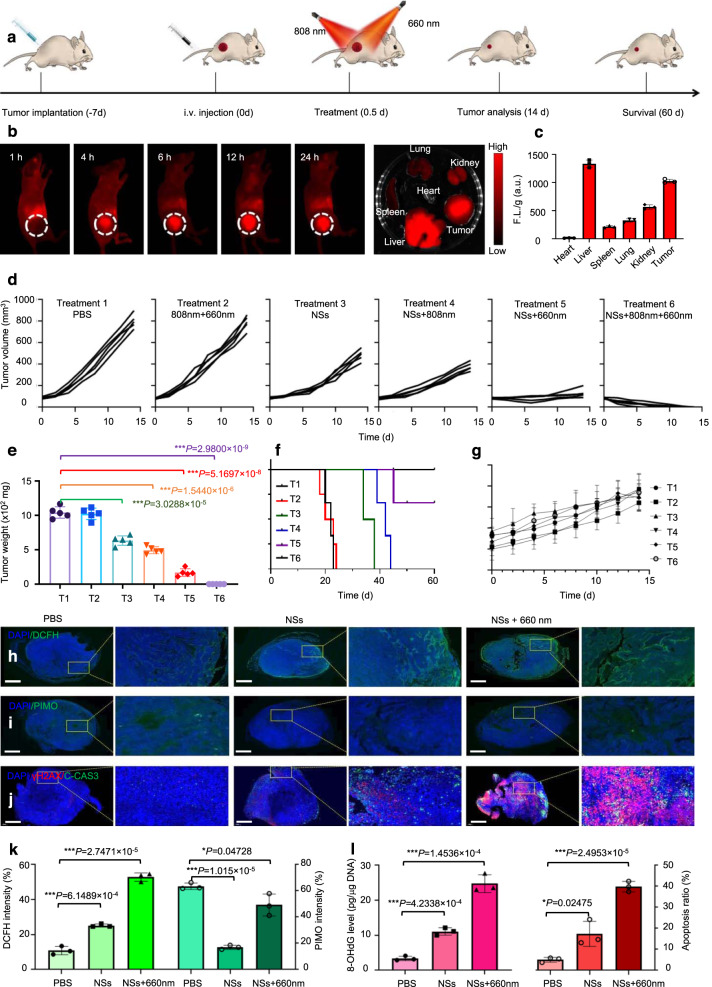
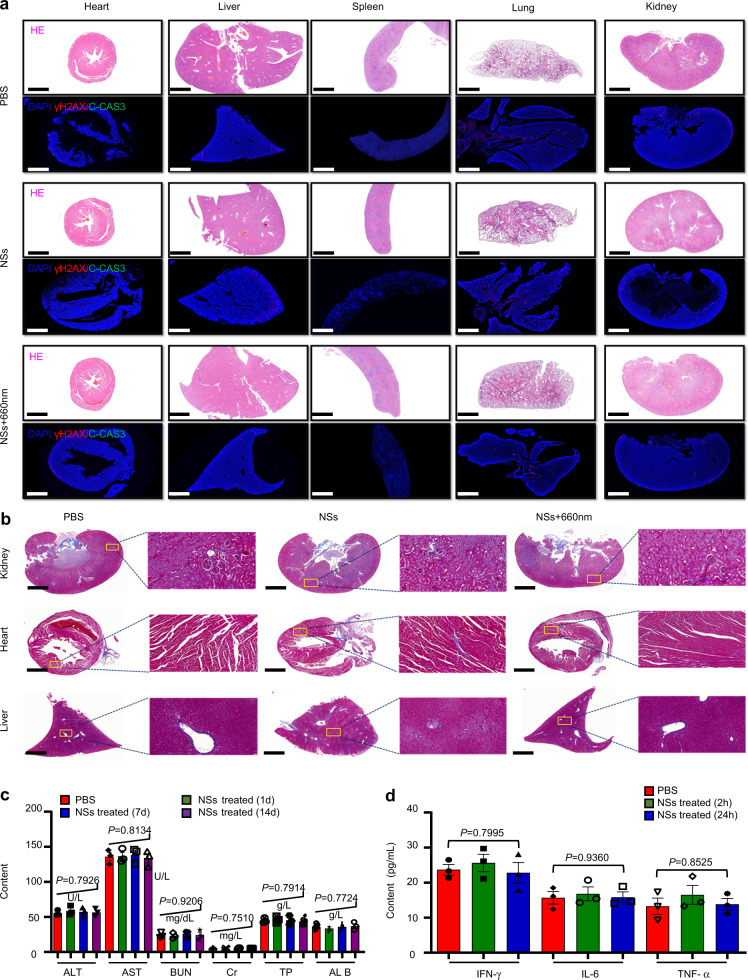
The modulation of intracellular reactive oxygen species (ROS) levels is crucial for cellular homeostasis and determination of cellular fate. A sublethal level of ROS sustains cell proliferation, differentiation and promotes tumor metastasis, while a drastic ROS burst directly induces apoptosis. Herein, surface-oxidized arsenene nanosheets (As/AsxOy NSs) with type II heterojunction are fabricated with efficient ·O2- and 1O2 production and glutathione consumption through prolonging the lifetime of photo-excited electron-hole pairs. Moreover, the portion of AsxOy with oxygen vacancies not only catalyzes a Fenton-like reaction, generating ·OH and O2 from H2O2, but also inactivates main anti-oxidants to cut off the "retreat routes" of ROS. After polydopamine (PDA) and cancer cell membrane (M) coating, the engineered As/AsxOy@PDA@M NSs serve as an intelligent theranostic platform with active tumor targeting and long-term blood circulation. Given its narrow-band-gap-enabled in vivo fluorescence imaging properties, As/AsxOy@PDA@M NSs could be applied as an imaging-guided non-invasive and real-time nanomedicine for cancer therapy.


Conflict of interest statement

The authors declare no competing interests.

Figures

Fig. 1
Fig. 1. Schematic illustration of preparation and dual-modal imaging-guided cancer theranostics using As/AsxOy@PDA@M NSs.
Surface-oxidized arsenene nanosheets (As/AsxOy NSs) with type II heterojunction were fabricated by ball-grinding and liquid exfoliation. After polydopamine (PDA) and cancer cell membrane (M) coating, the engineered As/AsxOy@PDA@M NSs serve as an intelligent theranostic platform with photothermal (PT) and fluorescence imagings guided photothermal therapy (PTT), photodynamic therapy (PDT), chemodynamic therapy (CDT), and inactivate antioxidant enzymes (AOEs).
Fig. 2
Fig. 2. Morphology and composition characterization of ultrathin 2D As/AsxOy@PDA@M NSs.
a TEM images of As/AsxOy NSs, scale bar = 100 nm. b HRTEM images of As NSs, scale bar = 1 nm. c HRTEM images of As/AsxOy NSs (red circle: lattice fringes of As; blue circle: amorphism of AsxOy), scale bar = 1 nm. d TEM images of As/AsxOy@PDA NSs, scale bar = 100 nm. e TEM images of As/AsxOy@PDA@M NSs, scale bar = 100 nm. fh AFM images of As/AsxOy NSs, As/AsxOy@PDA NSs, and As/AsxOy@PDA@M NSs, respectively, scale bar = 100 nm. i SEM-EDS mapping of As/AsxOy@PDA@M NSs: green (As), purple (C), orange (N), pink (O), and red (P), scale bar = 50 nm. For these morphology characterizations of fabricated As-based NSs, three times each experiment was repeated independently with similar results.
Fig. 3
Fig. 3. Chemical composition and structure characterization of ultrathin 2D As/AsxOy@PDA@M NSs.
a Raman shift spectra of bulk As and As/AsxOy NSs. b XRD spectra of bulk As and As/AsxOy NSs. c XPS spectra of bulk As, As/AsxOy NSs, and As/AsxOy@PDA@M NSs. d HRXPS spectra of As 3d in bulk As and As/AsxOy NSs. e HRXPS spectra of O 1s in bulk As and As/AsxOy NSs. f ESR spectra of bulk As and As/AsxOy NSs. For these chemical characterizations of fabricated As based NSs, three times each experiment was repeated independently with similar results.
Fig. 4
Fig. 4. Fenton-like reaction-catalyzed ability of As/AsxOy NSs.
a Degradation of MB caused by the generation of ·OH with different concentration of As/AsxOy NSs (5–15 μg/mL). b ESR spectra of ·OH generated by As/AsxOy NSs. c O2 generation by As/AsxOy NSs at different concentrations (5–15 μg/mL). d The mechanism of As/AsxOy NSs for generation of ·OH and O2. AsIII with high reducibility catalyzes the disproportionate reaction of H2O2 to generate ·OH, and AsV with high oxidizability catalyzes the oxidation of H2O2 to generate O2 and realizes regeneration of AsIII. Three times each experiment was repeated independently with similar results.
Fig. 5
Fig. 5. Photocatalytic performance of As/AsxOy NSs.
The degradation of a DPBF and b GSH caused by As/AsxOy NSs under 660 nm laser irradiation at 0.3 W/cm2. c ESR spectra of ·O2- and 1O2 generated by As/AsxOy NSs under 660 nm laser irradiation at 0.3 W/cm2. d UV–Vis absorbance spectra and calculated band gap of bulk As and As/AsxOy NSs. e Valence band of bulk As and As/AsxOy NSs calculated from XPS spectra. f Mechanism of type II heterojunction based on As/AsxOy NSs for ·O2 and 1O2 generation and GSH oxidation. g Photocurrent curve of bulk As and As/AsxOy NSs under 660 nm laser irradiation. For the photocurrent analysis, three electrodes were used: glassy-carbon (working), silver–silver chloride (reference), and platinum (counter) electrodes in a sodium phosphate buffer (100 mM, pH 7.0). h Time-resolved fluorescence spectra of As and As/AsxOy NSs. Three times each experiment was repeated independently with similar results.
Fig. 6
Fig. 6. Photothermal conversion and stability of As/AsxOy@PDA NSs.
UV–Vis absorbance spectra of a As/AsxOy NSs and b As/AsxOy@PDA NSs in PBS solution for different time intervals. c UV–Vis absorbance spectra of As/AsxOy@PDA NSs in TME-mimicking solution for different time periods. Photothermal conversion curves of d As/AsxOy NSs and e As/AsxOy@PDA NSs in PBS solutions. f Photothermal conversion curves of As/AsxOy@PDA NSs in TME-mimicking solution. g Photothermal conversion stability of As/AsxOy NSs and As/AsxOy@PDA NSs in PBS and in TME-mimicking solutions, respectively. h Degradation performance of As/AsxOy NSs and As/AsxOy@PDA NSs in PBS and TME-mimicking solutions, respectively. Three times each experiment was repeated independently with similar results.
Fig. 7
Fig. 7. Intracellular uptake and ROS generation.
a Fluorescence spectrum of As NSs and As/AsxOy@PDA@M NSs with the excitation wavelength at 500 nm and emission wavelength at 795 nm. b Intracellular uptake of NSs in various formations after incubation for 4 h characterized by LSCM with the excitation wavelength at 500 nm and emission wavelength at 795 nm. Scale bars = 50 μm. c Fluorescence quantitative analysis of the intracellular uptake of NSs. d Intracellular ROS generation detected by FCM. e and g Intracellular ROS and O2 generation detected by CLSM. Scale bars = 100 μm. f and h Fluorescence quantitative analysis of intracellular ROS and O2 generation. i Representative confocal microscopy images of the MCF-7 cells (scale bars, 50 μm) after different treatments. The nuclei were stained by DAPI (blue), and the γH2AX foci per nucleus were stained by anti-γH2AX antibody (red). j Mechanism of As/AsxOy@PDA@M NSs for modulating ROS burst. The engineered As/AsxOy@PDA@M NSs serve as an intelligent theranostic platform-mediated ROS burst through five pathways. For the intracellular uptake, ROS and O2 generation, and DNA damage of developed NSs, three times each experiment was repeated independently with similar results.
Fig. 8
Fig. 8. Biocompatibility and cytotoxicity of As/AsxOy@PDA@M NSs.
a Relative viability of HL-7702, HEK293, A549, and MCF-7 cells after incubation with As/AsxOy NSs for 24 h. b Relative viability of MCF-7 cells after incubation with As/AsxOy@PDA@M NSs under different treatments for 24 h. The power of 660 nm laser and 808 nm laser were 0.3 and 1.0 W cm−2, respectively. The exposure time was 10 min. Error bars = standard deviation (n = 6), n = 6 biologically independent cells. Data are presented as mean values ± SEM. Two-sided ANOVAs were performed for all other comparisons. No adjustments were made for multiple comparisons. c FCM images of MCF-7 cells after incubation with As/AsxOy@PDA@M NSs under different treatments for 12 h. d Fluorescence microscopy images of mitochondrial membrane potential change detected by JC-1 staining (Red: hyperpolarization; Green: depolarization) (scale bars = 10 μm). e Florescent images of MCF-7 cells stained with calcein AM (Green: live cells) and PI (Red: dead cells) (scale bars = 200 μm). For the mitochondrial membrane potential change and live/dead cells staining, three times each experiment was repeated independently with similar results.
Fig. 9
Fig. 9. In vivo imaging and anti-tumor performance of As/AsxOy@PDA@M NSs.
a Treatment schedule. b In vivo fluorescence images of nude mice after i.v. administration of NSs, and the ex vivo fluorescence images of the tumor and major organs at 24 h post-injection of As/AsxOy@PDA@M NSs with the excitation wavelength at 500 nm and emission wavelength at 795 nm. c Semiquantitative biodistribution of As/AsxOy@PDA@M NSs in tumor and major organs 24 h post-injection. Error bars = standard deviation (n = 3), n = 3 biologically independent samples. d Tumor growth curves of MCF-7 tumor-bearing nude mice. e Tumor weight in different groups after 14 days of treatment. Error bars = standard deviation (n = 5), n = 5 biologically independent mice. f Survival rate of mice undergoing different treatments. g Body weight of mice during treatment. Error bars = standard deviation (n = 5), n = 5 biologically independent mice. h In vivo ROS detection in the sections from tumors by dichlorodihydrofluorescein (DCFH) via fluorescence microscopy, scale bars = 1000 μm. i In vivo O2 generation in sections from tumors by pimonidazole (PIMO) via fluorescence microscopy, scale bars = 1000 μm. j Immunofluorescence (IF) staining in tumor sections after treatment with PBS, NSs, or NSs + 660 nm laser irradiation, scale bars = 1000 μm. The nucleus is stained by DAPI (blue), damaged DNA by γH2AX foci (red), and apoptotic cells by apoptosis marker C-CAS3 (green). k Quantification of the in vivo ROS and O2 signals from the tumors calculated from the section studies in h and i. l In vivo DNA damage of tumors measured by 8-OHdG assay and apoptosis ratio after different treatments. Error bars = standard deviation (n = 3), n = 3 biologically independent samples. For all statistical analysis, data are presented as mean values ± SEM. Two-sided ANOVAs were performed for all other comparisons. No adjustments were made for multiple comparisons. For the in vivo fluorescence images and tumor IF staining, three times each experiment was repeated independently with similar results.
Fig. 10
Fig. 10. Biocompatibility evaluation of As/AsxOy@PDA@M NSs.
a H&E staining and immunofluorescence (IF) staining in sections from major organs after different treatments with PBS, NSs, or NSs + 660 nm laser irradiation (irradiation performed only within tumor areas). The nucleus was stained by DAPI (blue), damaged DNA by γH2AX foci (red), and apoptotic cells by apoptosis marker C-CAS3 (green). Scale bars = 1000 μm. b Masson staining of pathological fibrous deposition in main organs (kidney, heart, and liver) from mice treated with PBS, NSs, or NSs + 660 nm laser irradiation (irradiations performed only within tumor areas). Scale bars = 1000 μm. c Blood biochemistry and hematology analysis of Balb/c mice treated with As/AsxOy@PDA@M NSs. d Serum levels IFN-γ, IL-6, and TNF-α in healthy mice at 2 or 24 h post intravenous injection of PBS or As/AsxOy@PDA@M NSs. Error bars = standard deviation (n = 3), n = 3 biologically independent mice. For all statistical analysis, data are presented as mean values ± SEM. Two-sided ANOVAs were performed for all other comparisons. No adjustments were made for multiple comparisons. For the H&E staining, IF staining, and Masson staining, three times each experiment was repeated independently with similar results.

Similar articles

Cited by

References

    1. Sies H, Jones DP. Reactive oxygen species (ROS) as pleiotropic physiological signalling agents. Nat. Rev. Mol. Cell Biol. 2020;21:363–383. doi: 10.1038/s41580-020-0230-3. - DOI - PubMed
    1. D’Autréaux B, Toledano MB. ROS as signalling molecules: mechanisms that generate specificity in ROS homeostasis. Nat. Rev. Mol. Cell Biol. 2007;8:813–824. doi: 10.1038/nrm2256. - DOI - PubMed
    1. Dickinson BC, Chang CJ. Chemistry and biology of reactive oxygen species in signaling or stress responses. Nat. Chem. Biol. 2011;7:504–511. doi: 10.1038/nchembio.607. - DOI - PMC - PubMed
    1. Nathan C, Cunningham-Bussel A. Beyond oxidative stress: an immunologist’s guide to reactive oxygen species. Nat. Rev. Immunol. 2013;13:349–361. doi: 10.1038/nri3423. - DOI - PMC - PubMed
    1. Shadel GS, Horvath TL. Horvath, mitochondrial ROS signaling in organismal homeostasis. Cell. 2015;163:560–569. doi: 10.1016/j.cell.2015.10.001. - DOI - PMC - PubMed

Publication types

MeSH terms