. 2021 Aug 6;12(1):4743.
doi: 10.1038/s41467-021-24989-7.

Responsive core-shell DNA particles trigger lipid-membrane disruption and bacteria entrapment

Affiliations

Responsive core-shell DNA particles trigger lipid-membrane disruption and bacteria entrapment

Michal Walczak et al. Nat Commun. .

Abstract

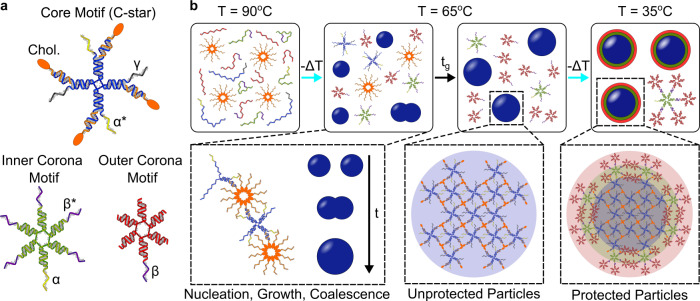
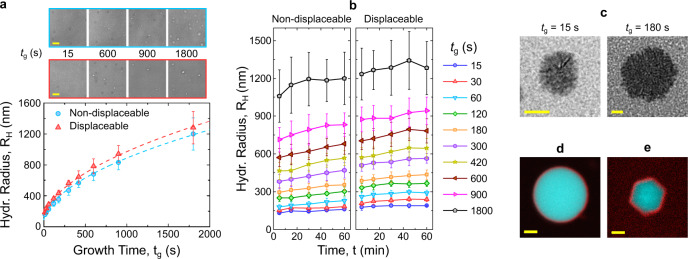
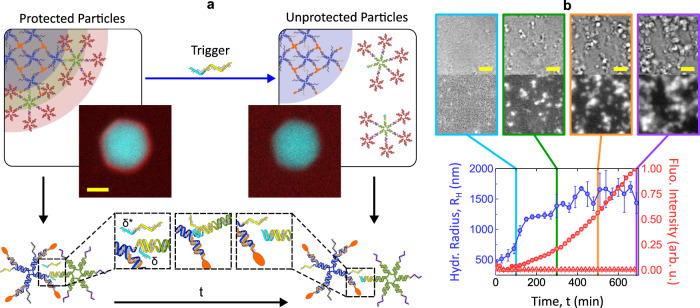
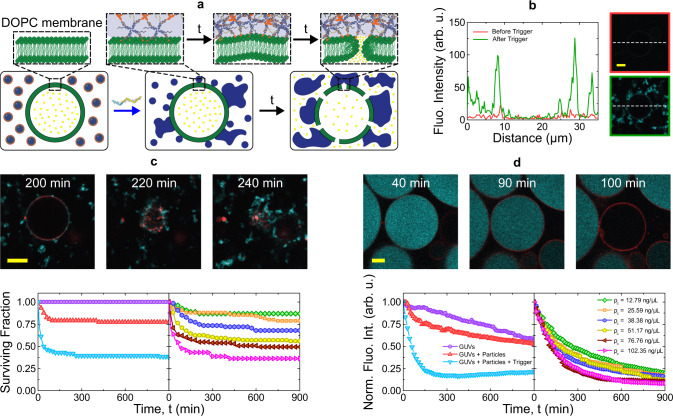
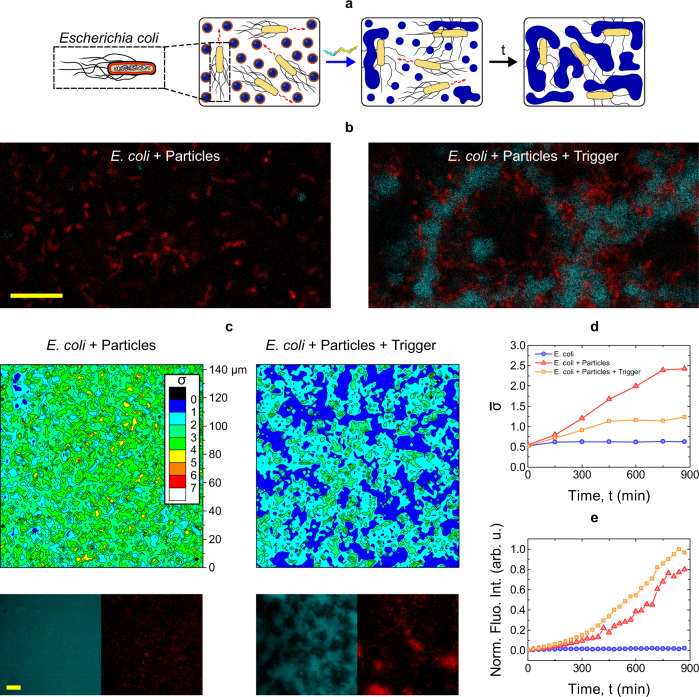
Biology has evolved a variety of agents capable of permeabilizing and disrupting lipid membranes, from amyloid aggregates, to antimicrobial peptides, to venom compounds. While often associated with disease or toxicity, these agents are also central to many biosensing and therapeutic technologies. Here, we introduce a class of synthetic, DNA-based particles capable of disrupting lipid membranes. The particles have finely programmable size, and self-assemble from all-DNA and cholesterol-DNA nanostructures, the latter forming a membrane-adhesive core and the former a protective hydrophilic corona. We show that the corona can be selectively displaced with a molecular cue, exposing the 'sticky' core. Unprotected particles adhere to synthetic lipid vesicles, which in turn enhances membrane permeability and leads to vesicle collapse. Furthermore, particle-particle coalescence leads to the formation of gel-like DNA aggregates that envelop surviving vesicles. This response is reminiscent of pathogen immobilisation through immune cells secretion of DNA networks, as we demonstrate by trapping E. coli bacteria.


Conflict of interest statement

The authors declare no competing interests.

Figures

Fig. 1
Fig. 1. Design and assembly of particle-forming DNA nanostructures.
a DNA nanostars used in the assembly of stable, size-controlled particles. Core motifs (C-stars) assemble from four different strands forming the central junction (blue) and four identical cholesterol-functionalized oligonucleotides (orange). Inner corona motifs (green) and outer corona motifs (red) each self-assemble from six different oligonucleotides. Inner corona motifs bind to the core motifs through αα* overhangs, while outer corona motifs bind to inner corona motifs through domains ββ*. In the tested design, domain γ is a non-interacting poly-T domain, which could however be replaced with a functional moiety or aptamer useful for anchoring molecular cargoes without impacting C-star self-assembly, as demonstrated in ref. . b Particle assembly pathway. All DNA strands are mixed in stoichiometric ratios. At high temperatures (T = 90 C) cholesterol-functionalized strands form micelles while the remaining oligonucleotides freely diffuse in solution. Upon fast quenching to T = 65 C, C-stars nucleate and grow as previously reported, leading to the formation of amphiphilic DNA particles whose size depends on the incubation (or growth) time tg at T = 65 C. At this stage, individual corona motifs assemble but remain detached from the particles. When rapidly cooled down to T = 35 C, corona motifs coat the particle with a two-layer hydrophilic shell, which offers steric stabilization and prevents further coalescence.
Fig. 2
Fig. 2. Multi-stage annealing protocol produces stable particles of programmable size.
a Hydrodynamic radius RH of protected particles with displaceable and non-displaceable corona (see Fig. 3a) as measured as a function of growth time tg using differential dynamic microscopy (DDM) (Bottom). Particle size can be prescribed by tuning tg. Data are shown as mean ± standard deviation calculated over 3 (non-displaceable) and 4 (displaceable) independent repeats, each point representing the RH value depicted in panel (b) at the delay time of 60 min. Dashed lines are fits to a diffusion-reaction growth model (see Supplementary Discussion 1). (Top) Bright-field snapshots from the videos used in the DDM analysis, showing visibly larger aggregates for increasing tg. Contrast has been enhanced to enable visualization. Scale bars 5 μm. b Time dependence of RH in protected particles with displaceable and non-displaceable corona as measured with DDM at room temperature. Data are shown as mean ± standard deviation as in panel (a). A limited increase in size is observed, demonstrating particle stability against coalescence. Supplementary Fig. 7 proves longer-term particle stability. c TEM micrographs of protected particles assembled at two different tg values. Selected micrographs represent data obtained in a single experiment. Scale bars 200 nm. d Confocal micrograph of a large aggregate assembled via a slow quenching protocol (see Methods), highlighting the core–shell structure. Scale bar 2 μm. e Confocal micrograph of a core–shell aggregate displaying polyhedral morphology, indicative of an underlying crystalline structure of the aggregate core, as previously demonstrated with other C-star designs. Crystallization was achieved through slow cooling at −0.01 C min−1 (see Methods). Scale bar 2 μm. In (d) and (e) core motifs are labeled with fluorescein (cyan) and outer corona motifs with Alexa Fluor 647 (red). For both (d) and (e) image acquisition was performed twice independently.
Fig. 3
Fig. 3. Triggered release of protective corona leads to particle aggregation.
a Schematic representation of the toehold-mediated strand displacement mechanism leading to isothermal release of the protective corona. A trigger strand of sequence δ*α* binds the toehold domain δ on the inner corona motifs, displacing the αα* bond between the latter and the core motif, and disrupting the protective shell. The confocal micrographs show a polyhedral core–shell particle before (left) and 1 min after trigger addition (right). Core motifs are labeled with fluorescein (cyan) and outer corona motifs with Alexa Fluor 647 (red). Note the increase in the background fluorescence from free corona motifs after the corona displacement. Scale bar 2 μm. b Corona displacement leads to the exposure of the “sticky” C-star core and subsequent particle aggregation, assessed by measuring the time-dependent hydrodynamic radius as determined via DDM (blue circles) and the normalized fluorescence intensity of labeled core motifs (red circles) after the addition of trigger strands (t = 0). The increase in RH observed upon trigger addition follows from the formation of larger aggregates, while the increase in the fluorescence trace is caused by their progressive sedimentation at the bottom of the cell, where the signal is recorded. For both observables, data are shown as mean ± standard deviation of 3 independent repeats. Red triangles indicate a control fluorescent trace measured in the absence of trigger. The constant and low value confirms the absence of spontaneous sedimentation. Top: bright field and fluorescence micrographs at different time-points after the addition of the trigger (t = 100, 300, 500, and 690 min). All scale bars 25 μm.
Fig. 4
Fig. 4. Unprotected particles trigger vesicle rupture and cargo release.
a Schematic representation of particle-induced disruption of Giant Unilamellar Vesicles (GUVs). Upon addition of the trigger strand and displacement of the hydrophilic corona, unprotected particles adhere to each other and to the GUVs owing to the hydrophobic nature of cholesterol molecules. DNA aggregates lead to GUV rupture and/or cargo release. b Confocal micrographs demonstrating the accumulation of amphiphilic DNA (fluorescein, cyan) onto a GUV before and after addition of the trigger strand. Scale bar 5 μm. Bottom: line profiles highlighting DNA accumulation onto the GUV surface. c Particle-induced GUV rupture as quantified from confocal time-lapse microscopy as the fraction of “surviving” GUVs over time. On the bottom, the left panel compares the effect of protected particles and unprotected ones exposed (at t = 0) to the trigger on otherwise stable GUVs. The right panel quantifies the effect of changing particle concentration ρc, expressed as the mass density of core C-stars. Legends as in panel d Top: confocal micrographs of membrane rupture induced by unprotected particles. Core C-stars are shown in cyan, the lipid membrane in red. Scale bar 10 μm. d Progressive leakage of fluorescein-sodium initially encapsulated in GUVs as quantified with confocal microscopy. Bottom: unprotected particles significantly increase the spontaneous leakage rate compared to control samples of unperturbed GUVs and those exposed to stabilized DNA particles. Top: Confocal micrographs demonstrating fluorescein-sodium (cyan) leakage following the adhesion of DNA particles (TXRED, red) onto GUVs. Scale bar 5 μm. Data shown in panels (b), (c), and (d) represent three and two independent experiments, respectively. The (mass) concentration of GUVs was 3.12 ± 0.16 g L−1 for the data in panels (c, d).
Fig. 5
Fig. 5. E. coli can be trapped by DNA networks formed by unprotected particles.
a Schematic representation of trigger-induced E. coli entrapment. Once activated by the addition of the trigger strand, particles assemble into a sticky DNA network. Swimming E. coli stick to, or become embedded in the aggregates, which renders them immobile. b Confocal micrographs demonstrating E. coli entrapment. Core C-stars (fluorescein) are shown in cyan, E. coli (mKate2) in red. Scale bar 10 μm. c Top: trigger-induced E. coli entrapment as quantified through a motility parameter σ (extracted from microscopy videos, see Methods and main text for definition) for samples with and without the addition of trigger. The smaller and non-uniform σ-values detected in the presence of the trigger confirm the ability of the DNA aggregates to hinder E. coli motion. See Supplementary Fig. 16 for the σ-maps extracted at different incubation stages, where the absence of significant signal from the early-time maps confirms that Brownian motion from the particles has a comparatively negligible effect on σ. Bottom: epifluorescence micrographs in the DNA (cyan) and E. coli (red) channels collected in the corresponding fields of view. Scale bar 20 μm. d Time-trace of the frame averaged motility parameter σ¯ for samples of E. coli and DNA particles (with and without trigger) and a control sample in which no DNA particles were present. The increase in σ¯ observed in the presence of particles can be ascribed to bacterial growth, as confirmed in panel e and Supplementary Fig. 17. While σ¯ continues to grow steadily in the sample with non-triggered particles, as more moving bacteria are generated, DNA-aggregation and E. coli entrapment cause the curve to plateau. e Normalized fluorescence intensity of E. coli-expressed mKate2 protein as extracted from epifluorescence images for the samples in panel (d). An increasing signal indicates bacterial growth, which occurs in the presence of DNA particles but is absent for the control DNA-only sample, suggesting that E. coli can use the DNA particles as a food source (see also Supplementary Fig. 17). Data shown in panels (be) was acquired in two independent experiments.

References

    1. Alberts, B. et al. Molecular Biology of the Cell, Parts 2 and 4 6th edn (Garland Science, 2014).
    1. Wardhan, R. & Mudgal, P. Textbook of Membrane Biology 1st edn (Springer, 2017).
    1. Beck M, Hurt E. The nuclear pore complex: understanding its function through structural insight. Nat. Rev. Mol. Cell. Biol. 2017;18:73–89. doi: 10.1038/nrm.2016.147. - DOI - PubMed
    1. Daleke DL. Regulation of transbilayer plasma membrane phospholipid asymmetry. J. Lipid Res. 2003;44:233–242. doi: 10.1194/jlr.R200019-JLR200. - DOI - PubMed
    1. Burke JE, Dennis EA. Phospholipase a2 structure/function, mechanism, and signaling. J. Lipid Res. 2009;50:S237–S242. doi: 10.1194/jlr.R800033-JLR200. - DOI - PMC - PubMed

Publication types

MeSH terms