. 2021 Aug 6;11(1):15998.
doi: 10.1038/s41598-021-94960-5.

Examining the interplay between face mask usage, asymptomatic transmission, and social distancing on the spread of COVID-19

Affiliations

Examining the interplay between face mask usage, asymptomatic transmission, and social distancing on the spread of COVID-19

Adam Catching et al. Sci Rep. .

Abstract

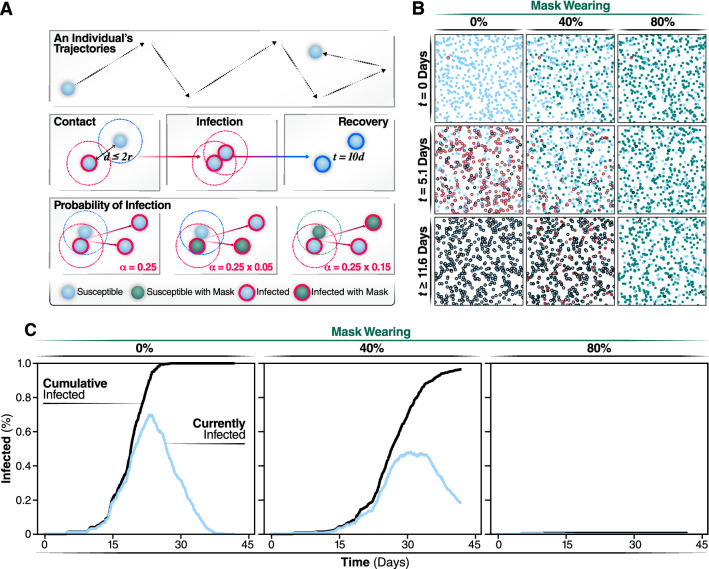
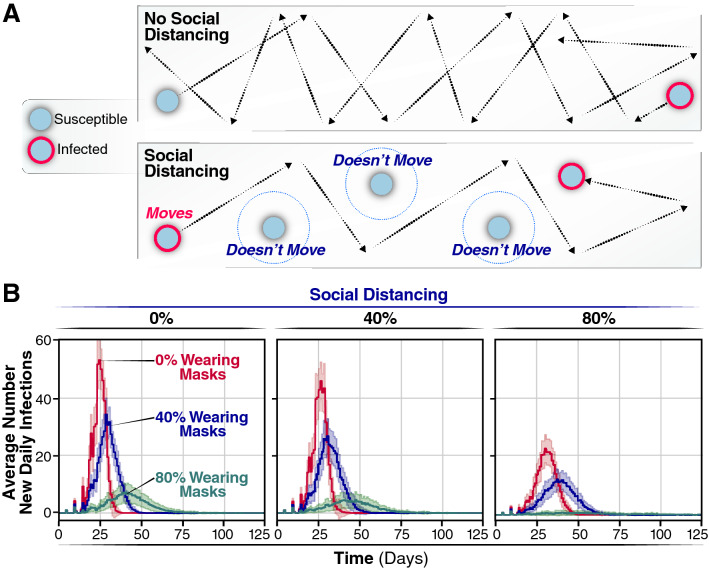
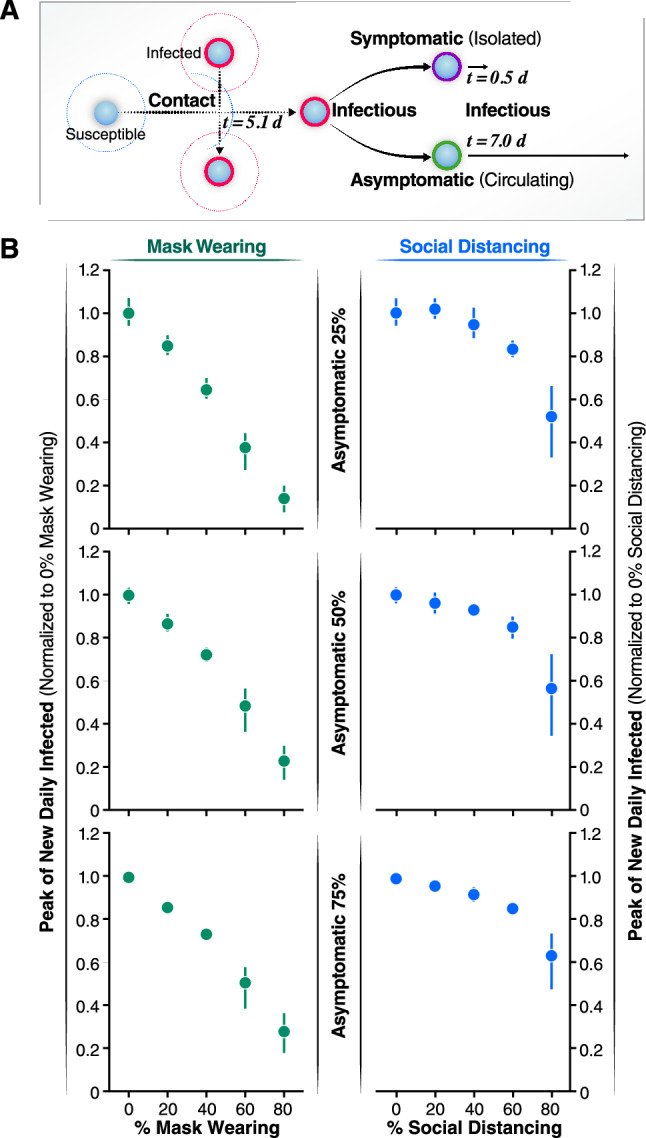
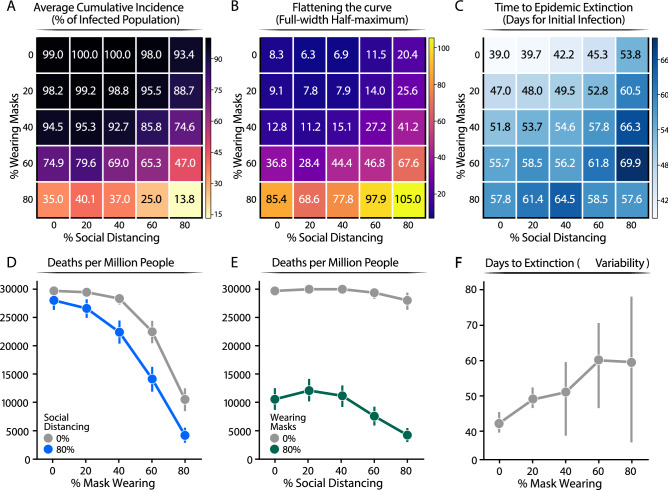
COVID-19's high virus transmission rates have caused a pandemic that is exacerbated by the high rates of asymptomatic and presymptomatic infections. These factors suggest that face masks and social distance could be paramount in containing the pandemic. We examined the efficacy of each measure and the combination of both measures using an agent-based model within a closed space that approximated real-life interactions. By explicitly considering different fractions of asymptomatic individuals, as well as a realistic hypothesis of face masks protection during inhaling and exhaling, our simulations demonstrate that a synergistic use of face masks and social distancing is the most effective intervention to curb the infection spread. To control the pandemic, our models suggest that high adherence to social distance is necessary to curb the spread of the disease, and that wearing face masks provides optimal protection even if only a small portion of the population comply with social distance. Finally, the face mask effectiveness in curbing the viral spread is not reduced if a large fraction of population is asymptomatic. Our findings have important implications for policies that dictate the reopening of social gatherings.


Conflict of interest statement

The authors declare no competing interests.

Figures

Figure 1
Figure 1
Individual states and rules of interactions. Using the same coloring system used in animated simulations, we show the different states an individual can be in during a simulation. Individuals keep the masked or not masked attribute assigned at initialization during the course of the simulation. (A) Spread of infection is caused by interactions of overlapping trajectories between infected and susceptible individuals. If the distance between individuals, d, is less than the radius of the two individuals, r, then an interaction occurs. Interactions initiate the generation of a random number that determines if transmission occurs. The chance of infection is randomly generated, based on a gamma distribution with shape parameter, alpha, of 0.25. This probability is further modulated by which individuals in the interactions are wearing face masks. (B) Agents are shown at their positions and states during snapshots of the simulation. Representative simulations of are shown of 0, 40, or 80% of the population wearing face masks. Snapshots are collected at days 0, 20, and 40 of the simulations. (C) Progression of the outbreak, the trajectory of the number of new daily infected individuals (Currently infected) and cumulatively infected from a representative simulation are graphed in light blue and black, respectively.
Figure 2
Figure 2
Average new infections per day when varying the population wearing masks and practicing social distancing. (A) SD is implemented by assigning agents to not move along a trajectory during the simulation. This lack of movement reduces the number of trajectories overlaps between agents and subsequently reduces the number of transmission events. (B) The number of new infections per day for 0, 40, or 80% of a population wearing face-masks are displayed by red, blue, or green trajectories, respectively, for 0% of the population practicing SD, for the 40% and for the 80%. Simulations were repeated 100 times for each condition, the curves and the highlighted regions around the curves represent the mean value + /- one standard deviation.
Figure 3
Figure 3
Effects of the asymptomatic population on the infected peak number. (A) Schematic representation of the asymptomatic transmission during the simulations. After 5.1 days of coming into contact with an infected individual, infectious agents can develop symptoms and after 12 h will be isolated. On the contrary, asymptomatic individuals don’t develop symptoms of the disease so they are not isolated but keep circulating thus contributing to spread the infection for 7 more days after the initial contact with an infectious agent. (B) The normalized peak of new daily infected is represented as a function of the percentage of the population wearing mask (left panels, green solid circles) and as a function of increasing the percentage of asymptomatic individuals (25% top left panel, 50% central left panel, 75% bottom left panel). The normalized peak of new daily infected is represented as a function of the percentage of the population practicing social distance (right panels, blue solid circles) and as a function of increasing the percentage of asymptomatic individuals (25% top right panel, 50% central right panel, 75% bottom right panel). Error bars represent 95% confidence intervals calculated.
Figure 4
Figure 4
Summary values from 2500 simulations of varying percentages of population wearing masks or social distancing. (A) Proportion of infected population. The average cumulative incidence is represented as a function of the population practicing SD or wearing a mask, which are given by the x and y axis, respectively. (B) The shape of the daily new infection curve. Full-width half-maximum (FWHM), denoting the number of days between the first day and last day of cases that have half the peak number of infected individuals. (C) Extinction rate of the epidemic estimated as the average number of days for which the simulation reports no new infected individuals. In the figure, the numbers represent the mean value calculated over 100 of simulations carried out for each condition. For clarity, we reported the standard deviation of the mean for each value reported in this figure in Fig. SM5. (D, E) Number of death people. Extrapolated for one million individuals from the cumulative incidence of infections estimated from our model at a mortality rate of 3%. (F) Number of days from the start of infection spread to the last infected agent recovering. Error bars represent 95% confidence intervals calculated for (D, E, F).

References

    1. Bourouiba L. Turbulent gas clouds and respiratory pathogen emissions: Potential implications for reducing transmission of COVID-19. JAMA. 2020;323:1837. doi: 10.1001/jama.2020.4756. - DOI - PubMed
    1. Miller, I. F., Becker, A. D., Grenfell, B. T. & Metcalf, C. J. E. (2020) Disease and healthcare burden of COVID-19 in the United States. Nat. Med.10.1038/s41591-020-0952-y - PubMed
    1. Bai Y, et al. Presumed asymptomatic carrier transmission of COVID-19. JAMA. 2020;323:1406. doi: 10.1001/jama.2020.2565. - DOI - PMC - PubMed
    1. Wölfel R, et al. Virological assessment of hospitalized patients with COVID-2019. Nature. 2020;581:465. doi: 10.1038/s41586-020-2196-x. - DOI - PubMed
    1. Schwartz, I. B., Kaufman, J., Hu, K. & Bianco, S. Predicting the impact of asymptomatic transmission, non-pharmaceutical intervention and testing on the spread of COVID19. BMJ. 10.1101/2020.04.16.20068387