. 2021 Dec;26(12):7661-7670.
doi: 10.1038/s41380-021-01244-5. Epub 2021 Aug 6.

Cerebrospinal fluid flow cytometry distinguishes psychosis spectrum disorders from differential diagnoses

Affiliations

Cerebrospinal fluid flow cytometry distinguishes psychosis spectrum disorders from differential diagnoses

Saskia Räuber et al. Mol Psychiatry. 2021 Dec.

Abstract

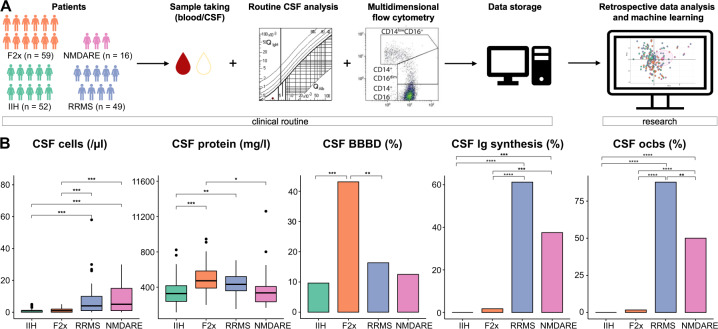
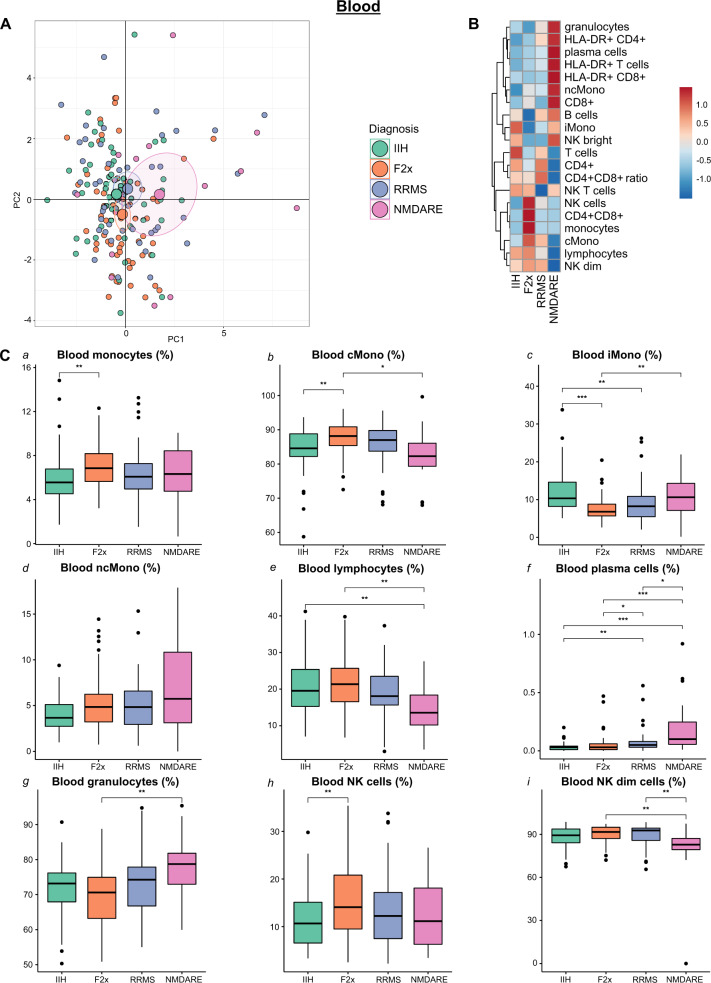
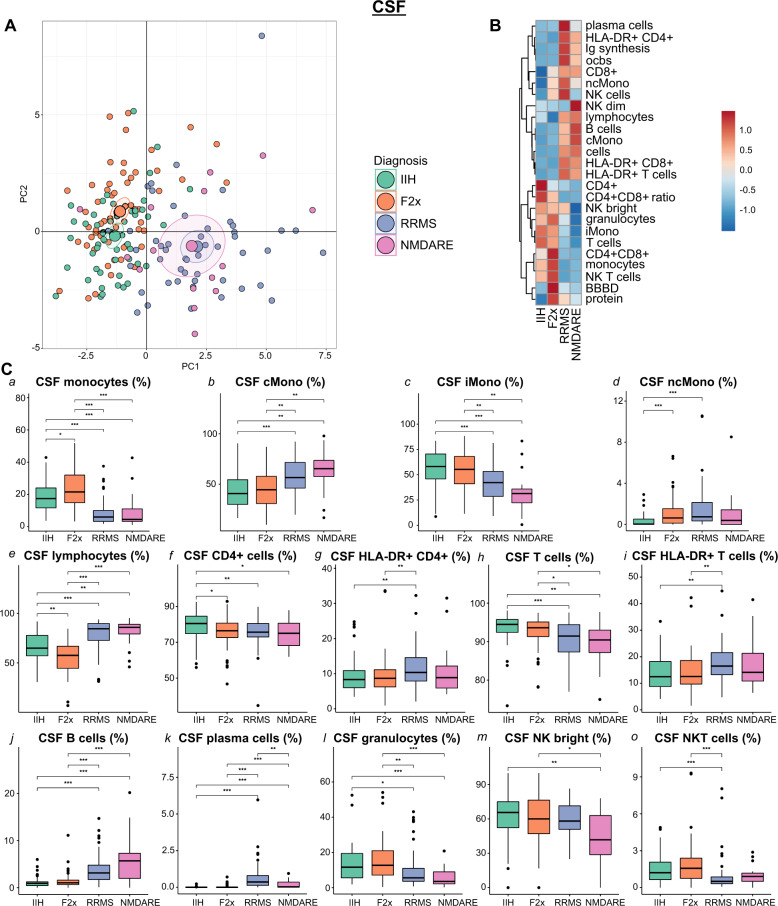
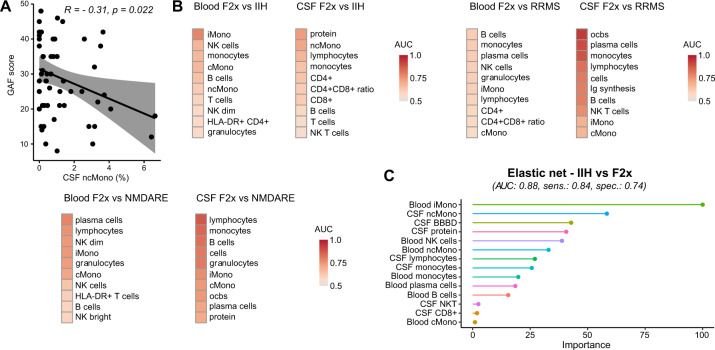
Psychotic disorders are common and disabling mental conditions. The relative importance of immune-related mechanisms in psychotic disorders remains subject of debate. Here, we present a large-scale retrospective study of blood and cerebrospinal fluid (CSF) immune cell profiles of psychosis spectrum patients. We performed basic CSF analysis and multi-dimensional flow cytometry of CSF and blood cells from 59 patients with primary psychotic disorders (F20, F22, F23, and F25) in comparison to inflammatory (49 RRMS and 16 NMDARE patients) and non-inflammatory controls (52 IIH patients). We replicated the known expansion of monocytes in the blood of psychosis spectrum patients, that we identified to preferentially affect classical monocytes. In the CSF, we found a relative shift from lymphocytes to monocytes, increased protein levels, and evidence of blood-brain barrier disruption in psychosis. In fact, these CSF features confidently distinguished autoimmune encephalitis from psychosis despite similar (initial) clinical features. We then constructed machine learning models incorporating blood and CSF parameters and demonstrated their superior ability to differentiate psychosis from non-inflammatory controls compared to individual parameters. Multi-dimensional and multi-compartment immune cell signatures can thus support the diagnosis of psychosis spectrum disorders with the potential to accelerate diagnosis and initiation of therapy.


Conflict of interest statement

The authors declare no competing interests.

Figures

Fig. 1
Fig. 1. Basic CSF characteristics are in accordance with expectations for F2x patients and controls.
A Illustration of study design B Basic CSF characteristics: cells were counted manually in a Fuchs-Rosenthal chamber; protein was assessed by nephelometry; BBBD was evaluated based on the serum/CSF albumin ratio; Ig synthesis was assessed by nephelometry; oligoclonal bands were detected by isoelectric focusing and silver nitrate staining. Box plots show the lower quartile, median and upper quartile. Whiskers depict 1.5 times the interquartile range of the box and outliers are illustrated by dots. Significance was calculated with the Kruskal Wallis test and post hoc two-sided Dunn test if the dependent variable was continuous. Fisher test was carried out for categorical dependent variables. P values were adjusted for multiple hypothesis testing with Benjamini-Hochberg’s procedure. (BBBD: blood-brain-barrier dysfunction; CSF: cerebrospinal fluid; F2x: patients with psychotic disorder, Ig: immunoglobulin; IIH: intracranial hypertension; NMDARE: anti-NMDA-receptor encephalitis; ocb: oligoclonal band; RRMS: Relapsing-Remitting Multiple Sclerosis).
Fig. 2
Fig. 2. Blood monocyte subpopulations distinguish F2x from control patients.
A PCA of blood flow cytometry parameters: Each patient is depicted as a multidimensional data point. The group means are illustrated as larger circles and the confidence intervals are shown by ellipses around each group mean point. B Heatmap of blood flow cytometry parameters: The mean of each parameter was calculated, scaled, centered, and clustered hierarchically. C Box plots of selected individual blood flow cytometry parameters: Lower quartile, median and upper quartile are shown by boxes. Whiskers depict 1.5 times the interquartile range of the box and outliers are illustrated by dots. The Kruskal Wallis tests with post hoc two-sided Dunn test and Benjamini-Hochberg’s adjusted p values were used to determine the significance. (cMono: classical monocytes; F2x: patients with psychotic disorder; IIH: intracranial hypertension; iMono: intermediate monocytes; NK: natural killer cells; ncMono: non-classical monocytes; NMDARE: anti-NMDA-receptor encephalitis; PC: principal component; PCA: principal component analysis; RRMS: Relapsing-Remitting Multiple Sclerosis).
Fig. 3
Fig. 3. A unique pattern of CSF leukocytes differentiates F2x patients from diverse control patients.
A PCA of CSF basic and flow cytometry parameters: Each patient is depicted as a multidimensional data point. The group means are illustrated as larger circles and the confidence intervals are shown by ellipses around each group mean point. B Heatmap of CSF basic and flow cytometry parameters: The mean of each parameter was calculated, scaled, centered, and clustered hierarchically. C Box plots of selected individual CSF flow cytometry parameters: Lower quartile, median and upper quartile are shown by boxes. Whiskers depict 1.5 times the interquartile range of the box and outliers are illustrated by dots. The Kruskal Wallis tests with post hoc two-sided Dunn test and Benjamini-Hochberg’s adjusted p values were used to calculate the significance. (BBBD: blood-brain-barrier dysfunction; cMono: classical monocytes; CSF: cerebrospinal fluid; F2x: patients with psychotic disorder; Ig: immunoglobulin; IIH: intracranial hypertension; iMono: intermediate monocytes; NK: natural killer cells; ncMono: non-classical monocytes; NMDARE: anti-NMDA-receptor encephalitis; ocb: oligoclonal band; PC: principal component; PCA: principal component analysis; RRMS: Relapsing-Remitting Multiple Sclerosis).
Fig. 4
Fig. 4. Non-classical monocytes in CSF correlate with psychosis severity and multiparametric models distinguish F2x from control patients.
A Disease severity was assessed by the GAF. Correlation analysis was performed with the Pearson correlation coefficient (R) and linear regression analysis. The gray areas show the confidence interval. B ROC analysis of F2x, IIH, RRMS and NMDARE patients with basic CSF, blood, and CSF flow cytometry parameters: AUC values were calculated, sorted by value, and depicted in a heatmap. C Blood and CSF parameters were combined, and the most powerful parameters were identified by different machine learning approaches. Feature selection methods were applied to reduce the numbers of predictors. We used the distance metric from perfect sensitivity and specificity as the performance metric. Different models were trained to minimize the distance and the final models were benchmarked based on AUC, sensitivity, and specificity (Supplementary Fig. 4). The top performing machine learning approaches were chosen. The variable importance of the best performing machine learning approaches are shown. When comparing IIH to F2x, F2x was defined as positive and IIH as negative. (AUC: area under the curve; BBBD: blood-brain-barrier dysfunction; cMono: classical monocytes; CSF: cerebrospinal fluid; F2x: patients with psychotic disorder; Ig: immunoglobulin; IIH: intracranial hypertension; iMono: intermediate monocytes; LDA RFE: recursive feature elimination based on linear discriminant analysis; NB: naive bayes; NK: natural killer cells; ncMono: non-classical monocytes; NMDARE: anti-NMDA-receptor encephalitis; ocb: oligoclonal band; ROC: receiver operating characteristic; RRMS: Relapsing-Remitting Multiple Sclerosis; Sens: sensitivity; Spec: specificity).

Similar articles

Cited by

References

    1. National Collaborating Centre for Mental Health (UK . Psychosis and schizophrenia in adults: treatment and management: updated edition 2014. London: National Institute for Health and Care Excellence (UK); 2014. - PubMed
    1. Carpenter WT, Strauss JS, Bartko JJ. The diagnosis and understanding of schizophrenia. Part I. Use of signs and symptoms for the identification of schizophrenic patients. Schizophr Bull. 1974;11:37–49. - PubMed
    1. Saha S, Chant D, Welham J, McGrath J. A systematic review of the prevalence of schizophrenia. PLoS Med. 2005;2:e141. - PMC - PubMed
    1. Chong HY, Teoh SL, Wu DB-C, Kotirum S, Chiou C-F, Chaiyakunapruk N. Global economic burden of schizophrenia: a systematic review. Neuropsychiatr Dis Treat. 2016;12:357–73. - PMC - PubMed
    1. Dean K, Murray RM. Environmental risk factors for psychosis. Dialogues Clin Neurosci. 2005;7:69–80. - PMC - PubMed

Publication types