. 2021 Oct;40(40):5938-5949.
doi: 10.1038/s41388-021-01957-5. Epub 2021 Aug 6.

FBP1 regulates proliferation, metastasis, and chemoresistance by participating in C-MYC/STAT3 signaling axis in ovarian cancer

Affiliations

FBP1 regulates proliferation, metastasis, and chemoresistance by participating in C-MYC/STAT3 signaling axis in ovarian cancer

Haoran Li et al. Oncogene. 2021 Oct.

Abstract

Fructose-1,6-bisphosphatase (FBP1) is a rate-limiting enzyme in gluconeogenesis and an important tumor suppressor in human malignancies. Here, we aimed to investigate the expression profile of FBP1 in ovarian cancer, the molecular mechanisms that regulate FBP1 expression and to examine how the FBP1 regulatory axis contributes to tumorigenesis and progression in ovarian cancer. We showed that FBP1 expression was significantly decreased in ovarian cancer tissues compared with normal ovarian tissues, and low-FBP1 expression predicted poor prognosis in patients with ovarian cancer. The enhanced expression of FBP1 in ovarian cancer cell lines suppressed proliferation and 2-D/3-D invasion, reduced aerobic glycolysis, and sensitized cancer cells to cisplatin-induced apoptosis. Moreover, DNA methylation and C-MYC binding at the promoter inhibited FBP1 expression. Furthermore, through physical interactions with signal transducer and activator of transcription 3 (STAT3), FBP1 suppressed nuclear translocation of STAT3 and exerted its non-metabolic enzymatic activity to induce the dysfunction of STAT3. Thus, our study suggests that FBP1 may be a valuable prognostic predictor for ovarian cancer. C-MYC-dependent downregulation of FBP1 acted as a tumor suppressor via modulating STAT3, and the C-MYC/FBP1/STAT3 axis could be a therapeutic target.


Conflict of interest statement

The authors declare no competing interests.

Figures
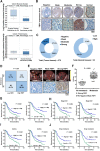
Fig. 1
Fig. 1. FBP1 inhibits the nuclear translocation of STAT3 via an enzymatic activity-dependent mechanism.
A Box plots comparing FBP1 mRNA expression levels in the Bonome cohort and TCGA cohort were download from the Oncomine database. B Representative images from ovarian cancer and normal ovarian biopsy samples with various levels of FBP1 immunohistochemical staining (4× and 400×). C FBP1 expression in human ovarian carcinoma sections (n = 375, left) and normal ovarian tissues (n = 23, right). D Relationship of FBP1 expression with ovarian cancer chemotherapeutic resistance (χ2 test). E Representative 18F-FDG PET/CT images from ovarian cancer patients with negative (left), weak (middle), or high (right) FBP1 expression (all 400×). F SUVmax of ovarian cancer patients with low-FBP1 expression and metastasis or high-FBP1 expression and no metastasis (n = 100). G Kaplan–Meier DFS and OS curves (log-rank tests) for patients with high and low expression of FBP1 based on IHC staining scores. H Kaplan–Meier DFS and OS curves for patients with high or low-FBP1 expression levels in patients stratified by the tumor stage. I Kaplan–Meier DFS and OS curves for patients with high or low-FBP1 expression levels stratified by present of ascites. J Kaplan–Meier DFS and OS curves for patients with high or low-FBP1 expression levels stratified by present of drug resistance status.
Fig. 2
Fig. 2. FBP1 overexpression sensitizes ovarian cancer cells to cisplatin.
A IF staining of the representative human ovarian cancer organoid lines with PAX8, FBP1, and DAPI (DNA) as indicated. B CCK-8 assays showed the effect of empty vector and FBP1 OE on the chemosensitivity of ovarian cancer cells to the cytotoxic effect of cisplatin. C The percentage of apoptotic cells in indicated group after cisplatin treatment. Cells were stained with annexin V–fluorescein isothiocyanate (FITC) and propidium iodide (PI) to detect cells in early apoptosis (annexin V+ PI–) and late apoptosis (annexin V+ PI+). Representative pictures are shown. D The expression levels of Bcl-2 and BAX in vector control (Vec) and FBP1 overexpressing (FBP1 OE) ovarian cancer cells were examined by western blotting. E Representative images showed the representative number of spheres counted each day over a period of 7 days for A2780 cells stably expressing empty vector (Vec) or FBP1 (FBP1 OE). F, G The percentage of ALDH-positive ovarian cancer cells in the vector and FBP1 OE groups were determined by flow cytometry and statistically analyzed. H Immunoblotting analysis of the apoptosis-associated proteins SOX2, OCT4 and NANOG. Data are shown as the means ± SD. *P < 0.05, **P < 0.01.
Fig. 3
Fig. 3. Influence of FBP1 on the progression and chemosensitivity of ovarian cancer in vivo.
A Representative luciferase image of nude mice bearing tumors formed by FBP1-overexpressing A2780 or SKOV3 cells or transfected with empty vector (Vec) or FBP1 (FBP1 OE) (n = 5). B Representative image of nude mice bearing tumors formed by A2780 and SKOV3 cells. C The average tumor volume after cisplatin treatment. D The average tumor weight after cisplatin treatment. E Gross image (left panels) and representative luciferase image (right panels) of the intraperitoneal dissemination of tumors formed by A2780 and SKOV3 cells expressing empty vector (Vec) or FBP1 (FBP1 OE). Red arrows show the position of tumors in the nude mice. F The average tumor weight after intraperitoneal injection. G Average body weight of mice after intraperitoneal injection. Error bars = 95% CIs. *P < 0.05, **P < 0.01.
Fig. 4
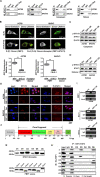
Fig. 4. FBP1 directly interacts with STATS and inhibits STAT3 expression and phosphorylation in ovarian cancer cells.
A Interaction between FBP1 and STAT3 detected by co-immunoprecipitation assay. B Interaction between FBP1 and STAT3 by FRET-FLIM upon transient coexpression in A2780 and SKOV3 cells. FE, FRET efficiency. Asterisks indicate a statistically significant difference (**P value < 0.01), according to the Student’s t test. C, D The influence of induction of FBP1 on the distribution and expression of STAT3 and p-STAT3 (Tyr705) protein in the nucleus and cytoplasm. E Representative immunofluorescence staining (×1000) images showing that FBP1 inhibited the expression of STAT3 in the cell nucleus (red). Blue dye (DAPI) indicates the nucleus. F Schematic image of functional domains of STAT3. G Western blot analysis indicated proteins ectopically expressed six regions of STAT3 and seven exons of FBP1. H Co-immunoprecipitation analysis indicated the interaction between STAT3 domains and FBP1 exons. I RT-PCR results of ChIP. The experiments were conducted in triplicate, and a representative experiment is shown.
Fig. 5
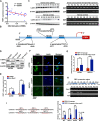
Fig. 5. FBP1 was regulated directly by C-MYC in ovarian cancer cells.
A The correlation between FBP1 mRNA expression level and the degree of methylation. B Enrichment of C-MYC at the promoter of FBP1, figure was download from UCSC Genome Bioinformatics Site (http://genome.ucsc.edu/). C Representative images of methylation-specific PCR results from ovarian cancer patients and healthy women. D Western blotting analysis of FBP1 protein expression in cells with the silencing of c-myc. E RT-qPCR analysis of FBP1 mRNA expression in cells with the silencing of c-myc. F Representative immunofluorescence staining images (×1000) showing that C-MYC inhibited the expression of FBP1 in the cytoplasm (green). Blue dye (DAPI) indicates the nucleus. G Luciferase reporter assay in A2780 and SKOV3 cell lines with c-myc downregulated. H The results of ChIP analysis showed that C-MYC can bind to the FBP1 promoter region. I Luciferase reporter assay of C-MYC mutant sites in the promoter region of FBP1. *P < 0.05, **P < 0.01.
Fig. 6
Fig. 6. Immunohistochemical staining of C-MYC, STAT3, and p-STAT3 in ovarian cancer.
A Representative images of biopsies containing negative, weak, moderate, and strong expression of C-MYC, STAT3, and p-STAT3 (all 400×). B Survival analysis of patients by Kaplan–Meier plots and log-rank tests. Patients were categorized as having high or low expression of C-MYC, STAT3, and p-STAT3 on the basis of IHC staining scores. H high; L low. Only IHC scores ≥3 were considered high. C Correlation of IHC scores between FBP1 and C-MYC, STAT3, and p-STAT3. D Schematic model showing the role of C-MYC-FBP1-STAT3 signaling axis in the regulation of cell proliferation, metastasis, and chemosensitivity.

Similar articles

Cited by

References

    1. Siegel RL, Miller KD, Jemal A. Cancer statistics, 2016. CA: Cancer J Clin. 2016;66:7–30. - PubMed
    1. Gonzalez de Castro D, Clarke PA, Al-Lazikani B, Workman P. Personalized cancer medicine: molecular diagnostics, predictive biomarkers, and drug resistance. Clin Pharmacol Ther. 2013;93:252–9. doi: 10.1038/clpt.2012.237. - DOI - PMC - PubMed
    1. Warburg O. On the origin of cancer cells. Science. 1956;123:309–14. doi: 10.1126/science.123.3191.309. - DOI - PubMed
    1. Vander Heiden MG, Cantley LC, Thompson CB. Understanding the Warburg effect: the metabolic requirements of cell proliferation. Science. 2009;324:1029–33. doi: 10.1126/science.1160809. - DOI - PMC - PubMed
    1. DeBerardinis RJ. Is cancer a disease of abnormal cellular metabolism? New angles on an old idea. Genet Med. 2008;10:767–77. doi: 10.1097/GIM.0b013e31818b0d9b. - DOI - PMC - PubMed

Publication types