. 2021 Dec;178(23):4708-4725.
doi: 10.1111/bph.15651. Epub 2021 Sep 9.

Metabolomics reveals biomarkers in human urine and plasma to predict cytochrome P450 2D6 (CYP2D6) activity

Affiliations

Metabolomics reveals biomarkers in human urine and plasma to predict cytochrome P450 2D6 (CYP2D6) activity

Gaëlle Magliocco et al. Br J Pharmacol. 2021 Dec.

Abstract

Background and purpose: Individualized assessment of cytochrome P450 2D6 (CYP2D6) activity is usually performed through phenotyping following administration of a probe drug to measure the enzyme's activity. To avoid any iatrogenic harm (allergic drug reaction, dosing error) related to the probe drug, the development of non-burdensome tools for real-time phenotyping of CYP2D6 could significantly contribute to precision medicine. This study focuses on the identification of markers of the CYP2D6 enzyme in human biofluids using an LC-high-resolution mass spectrometry-based metabolomic approach.

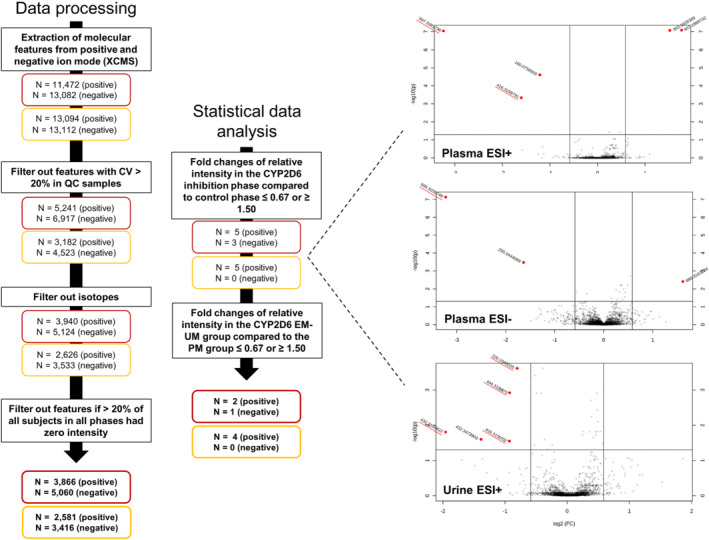
Experimental approach: Plasma and urine samples from healthy volunteers were analysed before and after intake of a daily dose of paroxetine 20 mg over 7 days. CYP2D6 genotyping and phenotyping, using single oral dose of dextromethorphan 5 mg, were also performed in all participants.

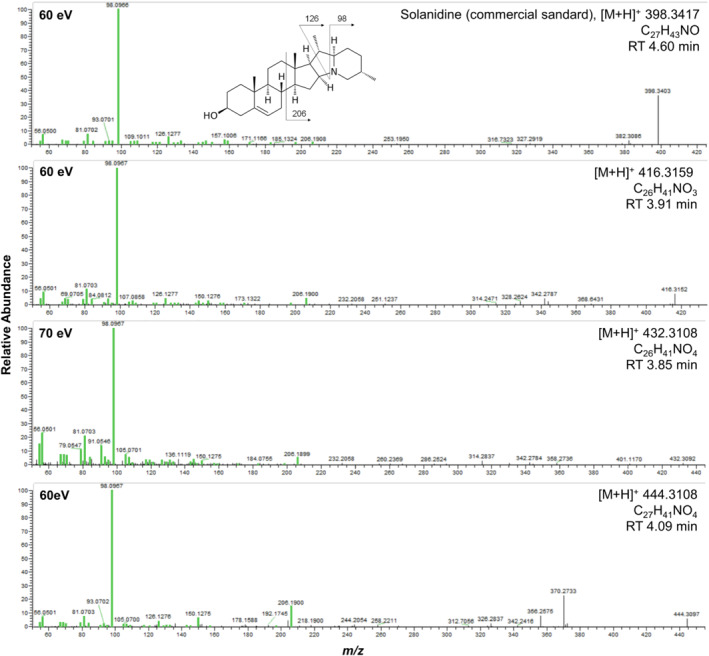
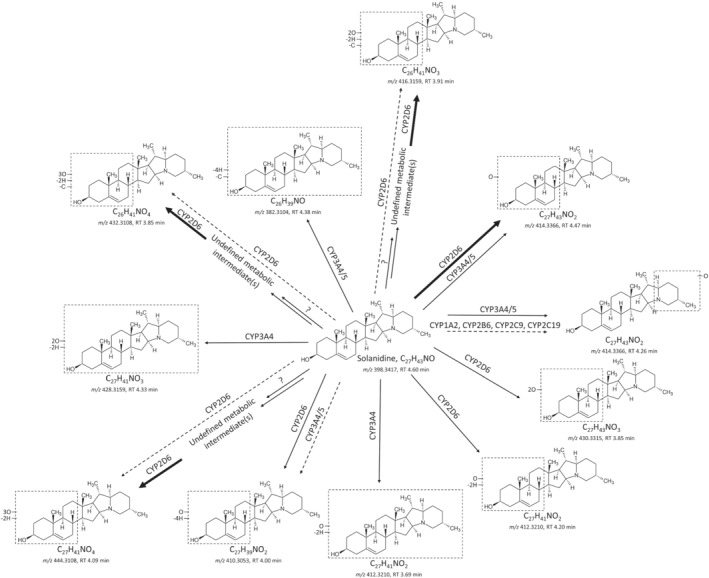
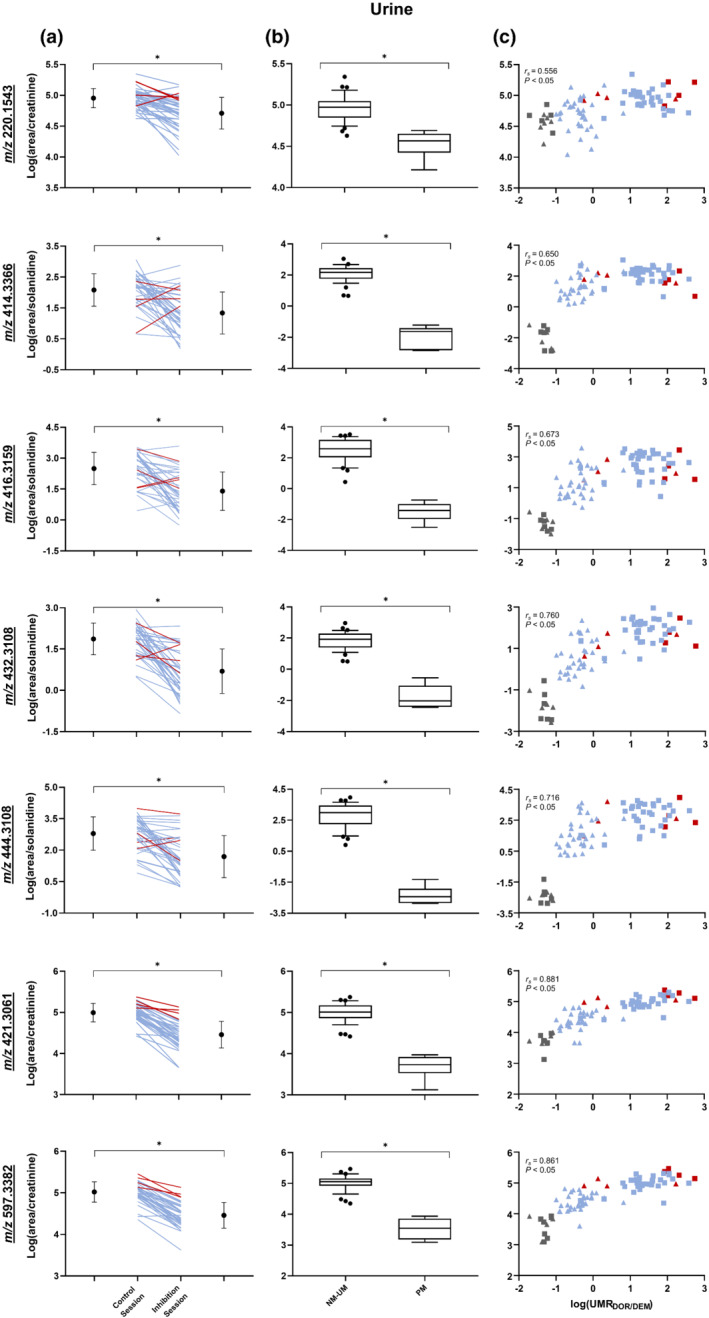
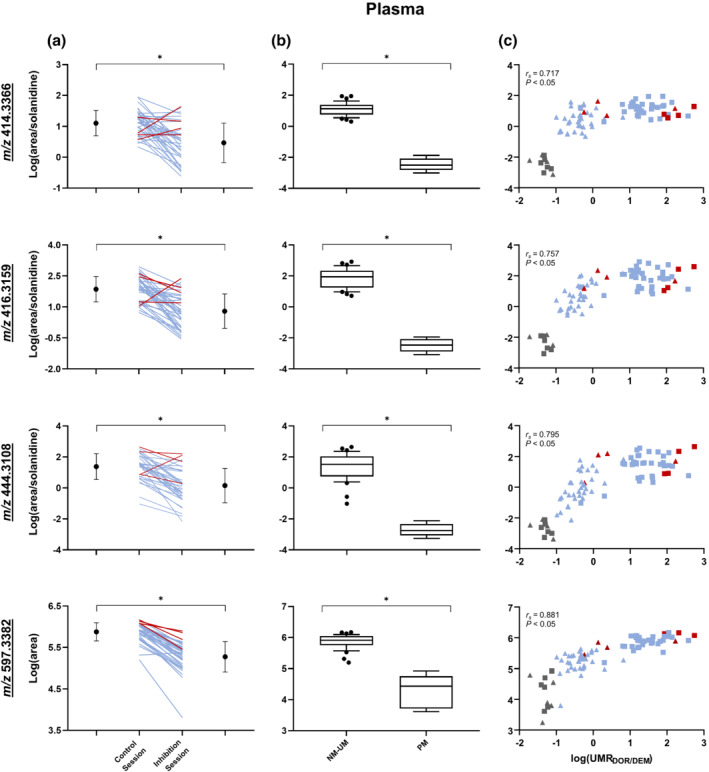
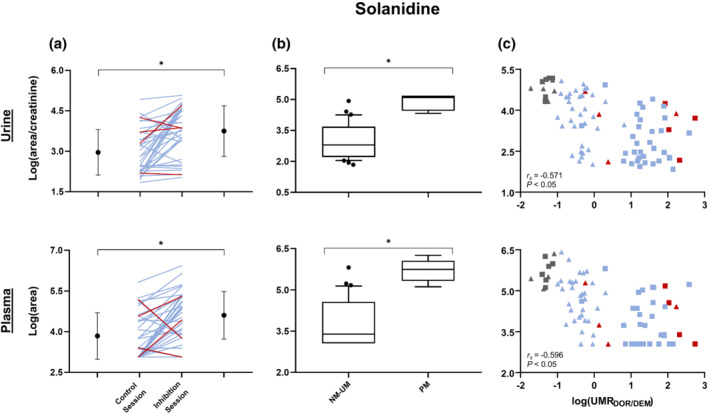
Key results: We report four metabolites of solanidine and two unknown compounds as possible novel CYP2D6 markers. Mean relative intensities of these features were significantly reduced during the inhibition session compared with the control session (n = 37). Semi-quantitative analysis showed that the largest decrease (-85%) was observed for the ion m/z 432.3108 normalized to solanidine (m/z 398.3417). Mean relative intensities of these ions were significantly higher in the CYP2D6 normal-ultrarapid metabolizer group (n = 37) compared with the poor metabolizer group (n = 6). Solanidine intensity was more than 15 times higher in CYP2D6-deficient individuals compared with other volunteers.

Conclusion and implications: The applied untargeted metabolomic strategy identified potential novel markers capable of semi-quantitatively predicting CYP2D6 activity, a promising discovery for personalized medicine.

Keywords: CYP2D6; CYP450; biomarker; metabolomics; phenotyping.


Conflict of interest statement

The authors declare no conflict of interest.

Figures

FIGURE 1
FIGURE 1
(left) Flowchart of the non‐targeted metabolomics approach to identify biomarkers reflecting CYP2D6 activity. N represents the number of metabolic features after each step with plasma biomarkers in red and urinary biomarkers in yellow. (right) Volcano plot representations obtained from the metabolomic analysis showing statistical significance against fold change between the inhibition session and the control session
FIGURE 2
FIGURE 2
Targeted selected ion monitoring/data‐dependent‐MS2 of solanidine and the ions m/z 416.3159, 432.3108 and 444.3108 in ESI+ mode. The common fragments between the compounds are shown in green
FIGURE 3
FIGURE 3
Preliminary scheme of the metabolic pathway of solanidine. Bold arrows indicate major routes. Dotted arrows indicate minor pathways. Multiple arrows indicate that the number of enzymatic steps is unknown
FIGURE 4
FIGURE 4
Log(area/creatinine) or log(area/solanidine) in urine of potential CY2D6 markers measured with parallel reaction monitoring (a) before and after paroxetine intake, including means and SDs on each side. Ultrarapid metabolizers (n = 4) are shown in red and normal metabolizers (n = 33) in blue. (b) Normal metabolizer (NM)–ultrarapid metabolizers (UM) subjects (n = 37) versus poor metabolizer (PM) subjects (n = 6) with whiskers indicating the 10th and 90th percentiles. (c) Correlation with log (urinary metabolic ratio (UMR) dextrorphan(DOR)/dextromethorphan(DEM)). Control session (n = 43) is represented by square, and inhibition session (n = 42) by triangle. Ultrarapid metabolizers are shown in red, normal metabolizers in blue and poor metabolizers in grey. All P < 0.05
FIGURE 5
FIGURE 5
Log(area) or log(area/solanidine) in plasma of potential CY2D6 markers measured with parallel reaction monitoring (a) before and after paroxetine intake, including means and SDs on each side. Ultrarapid metabolizers (n = 4) are shown in red, and normal metabolizers (n = 33) in blue. (b) Normal metabolizer (NM)–ultrarapid metabolizers (UM) subjects (n = 37) versus poor metabolizer (PM) subjects (n = 6) with whiskers indicating the 10th and 90th percentiles. (c) Correlation with log(urinary metabolic ratio (UMR)dextrorphan(DOR)/dextromethorphan(DEM)). Control session (n = 43) is represented by square, and inhibition session (n = 42) by triangle. Ultrarapid metabolizers are shown in red, normal metabolizers in blue and poor metabolizers in grey. All P < 0.05
FIGURE 6
FIGURE 6
Log(area/creatinine) or log(area) in urine and plasma, respectively, of solanidine measured with parallel reaction monitoring (a) before and after paroxetine intake, including means and SDs on each side. Ultrarapid metabolizers (UM) (n = 4) are shown in red, and normal metabolizers (n = 33) in blue. (b) Normal metasbolizer (NM)–UM subjects (n = 37) versus poor metabolizer (PM) subjects (n = 6) with whiskers indicating the 10th and 90th percentiles. (c) Correlation with log(urinary metabolic ratio (UMR)dextrorphan (DOR)/dextromethorphan (DEM)). Control session (n = 43) is represented by square, and inhibition session (n = 42) by triangle. Ultrarapid metabolizers are shown in red, normal metabolizers in blue and poor metabolizers in grey. All P < 0.05

Similar articles

Cited by

References

    1. Alexander, S. P. H. , Fabbro, D. , Kelly, E. , Mathie, A. , Peters, J. A. , Veale, E. L. , Armstrong, J. F. , Faccenda, E. , Harding, S. D. , Pawson, A. J. , Sharman, J. L. , Southan, C. , Davies, J. A. , & CGTP Collaborators (2019). The Concise Guide to PHARMACOLOGY 2019/20: Enzymes. British Journal of Pharmacology, 176, S297–S396. 10.1111/bph.14752 - DOI - PMC - PubMed
    1. Alonso, A. , Marsal, S. , & Julià, A. (2015). Analytical methods in untargeted metabolomics: State of the art in 2015. Frontiers in Bioengineering and Biotechnology, 3, 23. 10.3389/fbioe.2015.00023 - DOI - PMC - PubMed
    1. Beger, R. D. , Dunn, W. , Schmidt, M. A. , Gross, S. S. , Kirwan, J. A. , Cascante, M. , Brennan, L. , Wishart, D. S. , Oresic, M. , Hankemeier, T. , & Broadhurst, D. I. (2016). Metabolomics enables precision medicine: ‘A white paper, community perspective’. Metabolomics, 12, 149. 10.1007/s11306-016-1094-6 - DOI - PMC - PubMed
    1. Blaženović, I. , Kind, T. , Ji, J. , & Fiehn, O. (2018). Software tools and approaches for compound identification of LC‐MS/MS data in metabolomics. Metabolites, 8, 31. 10.3390/metabo8020031 - DOI - PMC - PubMed
    1. Chen, L. , Zhong, F. , & Zhu, J. (2020). Bridging targeted and untargeted mass spectrometry‐based metabolomics via hybrid approaches. Metabolites, 10, 348. 10.3390/metabo10090348 - DOI - PMC - PubMed

Publication types