. 2021 Aug 19;184(17):4447-4463.e20.
doi: 10.1016/j.cell.2021.07.026. Epub 2021 Aug 6.

Human TBK1 deficiency leads to autoinflammation driven by TNF-induced cell death

Affiliations

Human TBK1 deficiency leads to autoinflammation driven by TNF-induced cell death

Justin Taft et al. Cell. .

Abstract

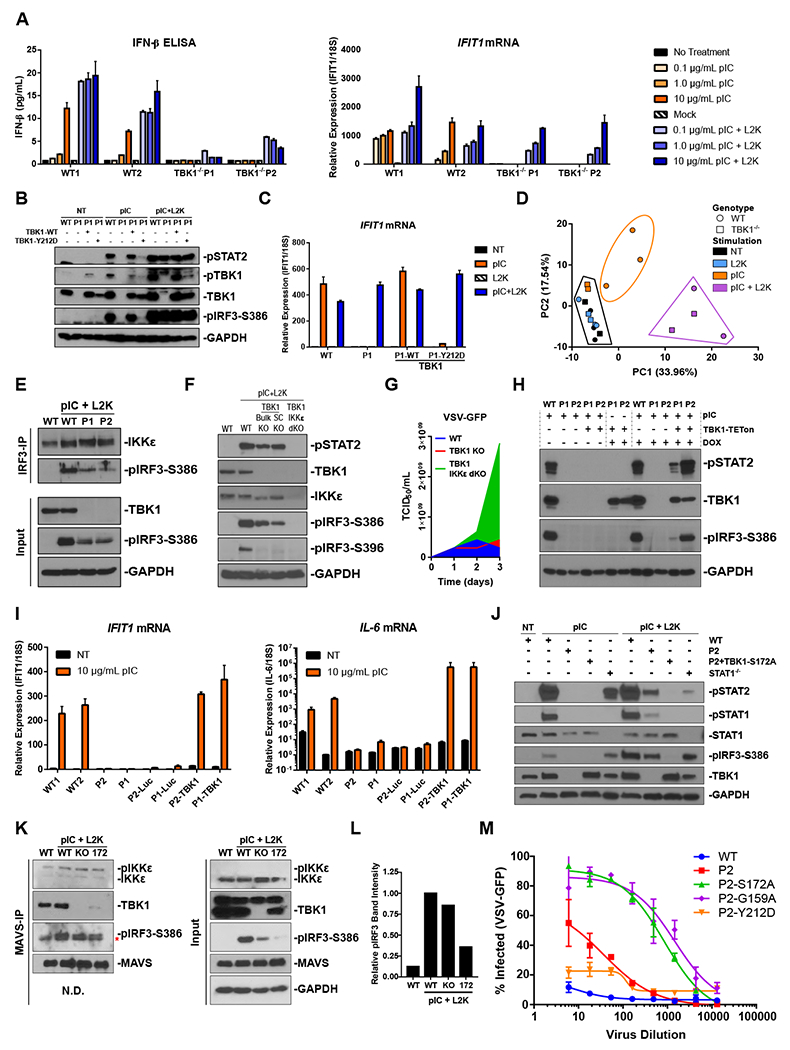
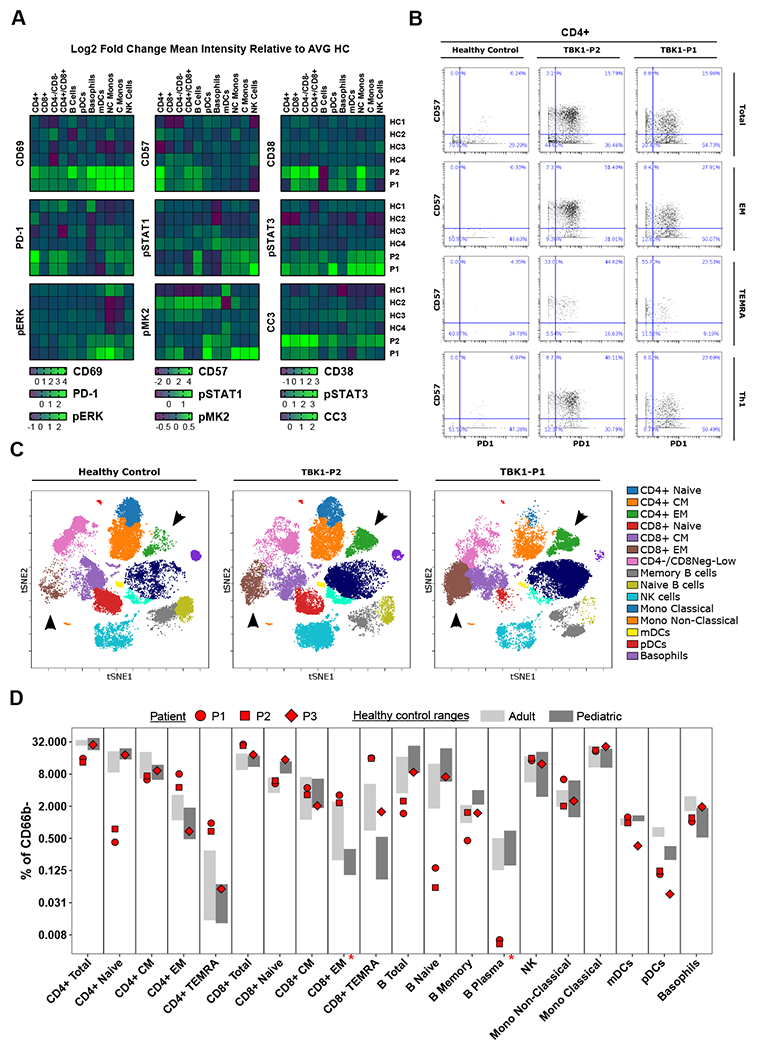
TANK binding kinase 1 (TBK1) regulates IFN-I, NF-κB, and TNF-induced RIPK1-dependent cell death (RCD). In mice, biallelic loss of TBK1 is embryonically lethal. We discovered four humans, ages 32, 26, 7, and 8 from three unrelated consanguineous families with homozygous loss-of-function mutations in TBK1. All four patients suffer from chronic and systemic autoinflammation, but not severe viral infections. We demonstrate that TBK1 loss results in hypomorphic but sufficient IFN-I induction via RIG-I/MDA5, while the system retains near intact IL-6 induction through NF-κB. Autoinflammation is driven by TNF-induced RCD as patient-derived fibroblasts experienced higher rates of necroptosis in vitro, and CC3 was elevated in peripheral blood ex vivo. Treatment with anti-TNF dampened the baseline circulating inflammatory profile and ameliorated the clinical condition in vivo. These findings highlight the plasticity of the IFN-I response and underscore a cardinal role for TBK1 in the regulation of RCD.

Keywords: IKKE; IRF3; RIPK1; TBK1 deficiency; TNF alpha; autoinflammation; interferon type I; viral susceptibility.


Conflict of interest statement

Declaration of interests D.B. is the founder of Lab11 Therapeutics.

Figures

Figure 1.
Figure 1.. 3 families with homozygous LoF variants in TBK1
A) Patient family pedigrees and P1, P2, (W619*), P3 (Y212D), and P4 (R440*) variant locations within a schematic of the TBK1 protein. B – C) Patient-derived hTERTs assessed for baseline TBK1 mRNA expression by qPCR (n = 3) and C) protein expression by western blot. D) 293Ts 24 hrs after transfection with the TBK1 alleles under study assessed by western blot and E – G) qPCR (n = 3).
Figure 2.
Figure 2.. Complete loss of TBK1 is not a complete loss of the IFN system, and inactive TBK1 interferes with IKKε-mediated IFN-I activation.
A) hTERTs stimulated with pIC overnight either in the endosome (TLR3) or transfected into the cytoplasm (RIG-I/MDA5) with L2K (n = 3). B) P1 hTERTs stably expressing either DOX-inducible WT or Y212D TBK1 4 hps C) or after an overnight stimulation (n = 3). D) PCA of sample variance determined by RNAseq on P1 and P2 hTERTs compared to 3 HC-derived lines following overnight stimulation with endosomal (10 μg/mL) or cytoplasmic (transfected) (0.1 μg/mL) pIC. E) Immunoprecipitation of IRF3 from hTERTs stimulated with cytoplasmic pIC (1 μg/mL) for 4 hrs. F) CRISPR generated TBK1 and TBK1/IKKε dKO A549s stimulated with cytoplasmic pIC (1 μg/mL) for 4 hrs. G) VSV-GFP titrated on A549s. To calculate the TCID50, infected wells were considered GFP+ if they displayed a mean intensity above the mean of the uninfected wells. H) hTERTs transduced with DOX-inducible TBK1 exposed to endosomal pIC (10 μg/mL) for 4 hrs following a 2-day DOX pre-treatment. IFN-I signaling was assessed by western blot. I) hTERTs complemented with WT TBK1 were stimulated with endosomal pIC (10 μg/mL) for 4 hrs and assessed by qPCR (n = 3). J) P2-derived hTERTs complemented with phospho-inactive S172A TBK1 were stimulated with endosomal (10 μg/mL) or cytoplasmic pIC (0.1 μg/mL) for 4 hrs. K) Immunoprecipitation of MAVS from TBK1 KO A549s complimented with phospho-inactive S172A TBK1. Cells were transfected with 1 μg/mL pIC for 4 hrs. The asterisk indicates a non-specific band in the pIRF3 blot of the IP. L) Band intensity quantification of pIRF3 that co-IPed with MAVS in B (left panel, upper band). Values are relative to WT pIC+L2K. M) hTERTs transfected with pIC (0.1 μg/mL) 6 hrs before an overnight VSV-GFP infection (n = 3).
Figure 3.
Figure 3.. TNF-driven RIPK1-mediated cell death is a source of autoinflammation in TBK1 deficiency.
A) Cartoon depicting the pro-survival and pro-death arms of the TNF signaling pathway. B) FLAG IP of the TNFR-SC in hTERTs following a 15 min stimulation with 1 μg/mL FLAG-TNF. C) hTERTs stimulated with TNF over 24 hrs (n = 3). D) hTERTs stimulated with TNF assessed for loss of pCYLD. Phosphorylation at this site decreases deubiquitinase activity. E) hTERTs pretreated for 30 min with either birinapant and zVAD, or birinapant, zVAD, and Nec-1 were exposed to TNF for 24 hrs. Relative viability was measured by resazurin reduction (n = 3). F – G) hTERTs complemented with DOX-inducible TBK1 were pretreated for 30 min as indicated and then stimulated with TNF (5 ng/mL) for 24 hrs. Relative viability was measured by resazurin reduction (F n = 3, G n = 6).
Figure 4.
Figure 4.. TBK1 and IKKε regulate cell death via CYLD.
A) CYLD overexpressed with WT or kinase-dead K38A TBK1 in 293EBNAs. B) CYLD overexpressed with TBK1 or IKKε in 293EBNAs. C – E) WT or NEMO-null Jurkats pretreated for 30 min with MRT and then stimulated with TNF for C) 15 min, D) 0-4 hrs E) 24 hrs (n = 3). F) CYLD knocked down in WT or NEMO-null Jurkats by shRNAs. Cells were pretreated with zVAD and MRT for 30 min before stimulation with TNF for 24 hrs (n = 3). G) Murine ear fibroblasts were treated with zVAD and MRT for 30 min before a 24 hr TNF stimulation (n = 3). H) CYLD knocked down in NEMO-null Jurkats by shRNAs. Cells were pretreated for 30 min with zVAD, MRT, and Nec-1 before TNF stimulation for 24 hrs (n = 3). Significance was evaluated by T-tests, **p≤0.01, ***p≤0.001.
Figure 5.
Figure 5.. Baseline immunophenotype of blood from TBK1-deficient individuals.
CyTOF immunophenotyping of whole blood from TBK1-deficient patients and HCs. The data in A and D is from a separate experiment from the data in B and C. The experiment that generated B and C had 1 HC. A) Mean intensity of inflammatory markers relative to the average of 4 HCs. B) Manually gated CD4 T cells and subsets from P1 and P2 compared to HC. C) Unsupervised clustering of agranulocytes (CD66b-) displayed on a multidimensional tSNE plot. D) Immune cell subsets at baseline represented as percent of agranulocytes (CD66b-). HC range n = 4, Pediatric HC range n = 5. An asterisk indicates the cell type was not identified in P3.
Figure 6.
Figure 6.. Single-cell RNA sequencing of patient PBMCs supports cellular death and hints at anti-apoptotic cell death signaling pathways.
A) UMAP of the integrated dataset of 9833 PBMCs from the two TBKT−/− patients and the HC. Points are colored by the results of unsupervised graph-based clustering. B) Major immune cell populations and their subsets annotated according to marker gene expression patterns. C) UMAP from A colored by patient identity. D) Global PBMC differential gene expression between TBK1−/− patients and the HC reveals elevated levels of mitochondrial-related genes. Labeled points and flagged genes represent mitochondrial genes with adjusted p-value < 10−100. E) Clusters in the myeloid cell compartment exhibit increased levels of mitochondrial gene expression in TBK1−/− patients. F) Expression feature plot of the top DEG, MTRNR2L1, expressed exclusively in TBK1−/− myeloid cells.
Figure 7.
Figure 7.. Anti-TNF therapy quells inflammation in TBK1 deficiency.
CyTOF immunophenotyping of whole blood from P1 collected pre (day 0) and post (day 131) administration of anti-TNF treatment (Infliximab) compared to 4 HCs. A) Immune cell subsets represented as percent of agranulocytes (CD66b-). B) Eosinophils as a percent of granulocytes (CD66b+). C) Mean intensity of inflammatory markers relative to the average of 4 HCs.

References

    1. Ahmad L, Zhang SY, Casanova JL, and Sancho-Shimizu V (2016). Human TBK1: A Gatekeeper of Neuroinflammation. Trends Mol. Med 22, 511–527. - PMC - PubMed
    1. Amin P, Florez M, Najafov A, Pan H, Geng J, Ofengeim D, Dziedzic SA, Wang H, Barrett VJ, Ito Y, et al. (2018). Regulation of a distinct activated RIPK1 intermediate bridging complex I and complex II in TNFα-mediated apoptosis. Proc. Natl. Acad. Sci. U. S. A 115, E5944–E5953. - PMC - PubMed
    1. Annibaldi A, Wicky John S, Vanden Berghe T, Swatek KN, Ruan J, Liccardi G, Bianchi K, Elliott PR, Choi SM, Van Coillie S, et al. (2018). Ubiquitin-Mediated Regulation of RIPK1 Kinase Activity Independent of IKK and MK2. Mol. Cell 69, 566–580.e5. - PMC - PubMed
    1. Van der Auwera GA, Carneiro MO, Hartl C, Poplin R, Del Angel G, Levy-Moonshine A, Jordan T, Shakir K, Roazen D, Thibault J, et al. (2013). From FastQ data to high confidence variant calls: the Genome Analysis Toolkit best practices pipeline. Curr. Protoc. Bioinforma 43, 11.10.1–11.10.33. - PMC - PubMed
    1. Bogunovic D, Byun M, Durfee LA, Abhyankar A, Sanal O, Mansouri D, Salem S, Radovanovic I, Grant AV, Adimi P, et al. (2012). Mycobacterial disease and impaired IFN-γ immunity in humans with inherited ISG15 deficiency. Science 337, 1684–1688. - PMC - PubMed

Publication types

MeSH terms

LinkOut - more resources