. 2021 Oct 15:304:198532.
doi: 10.1016/j.virusres.2021.198532. Epub 2021 Aug 5.

Mutation hotspots and spatiotemporal distribution of SARS-CoV-2 lineages in Brazil, February 2020-2021

Affiliations

Mutation hotspots and spatiotemporal distribution of SARS-CoV-2 lineages in Brazil, February 2020-2021

Vinícius Bonetti Franceschi et al. Virus Res. .

Abstract

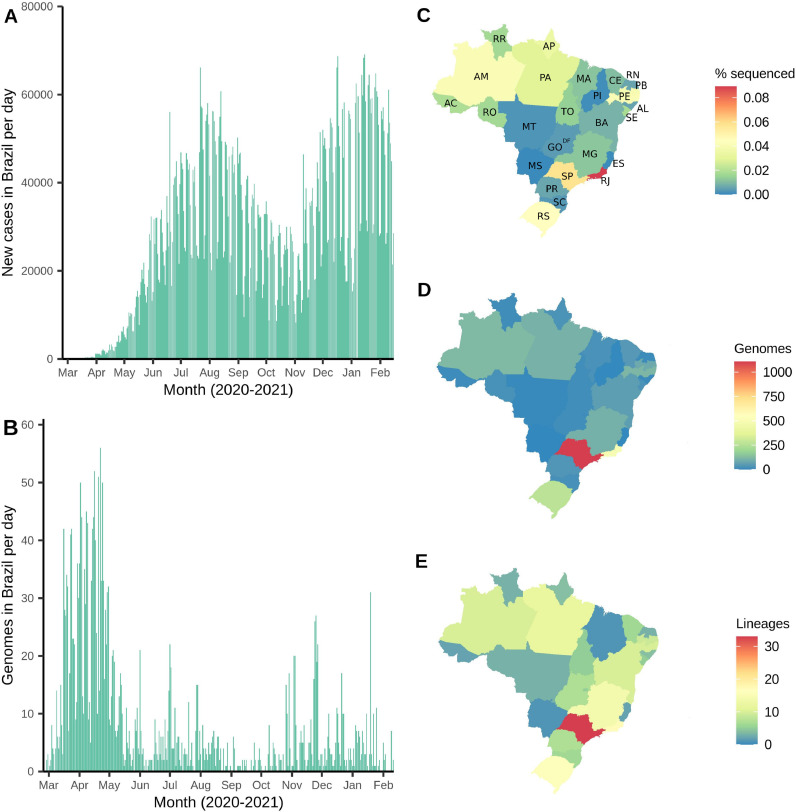
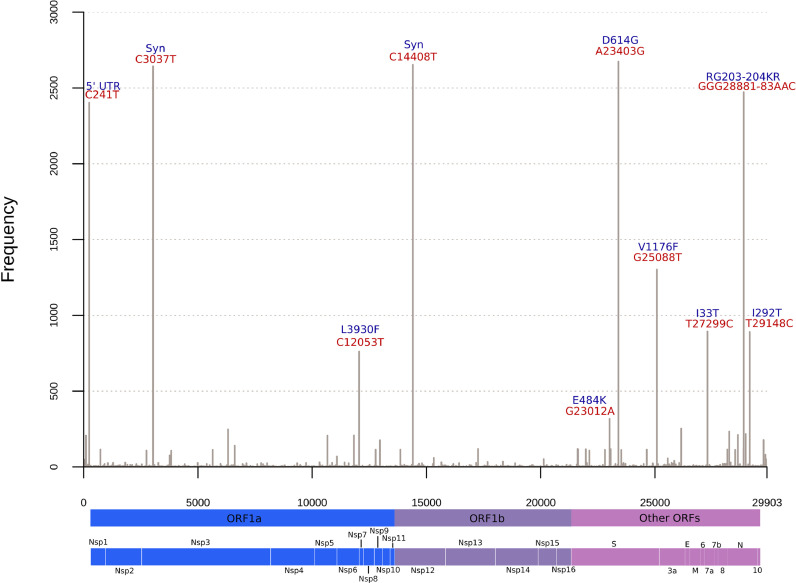
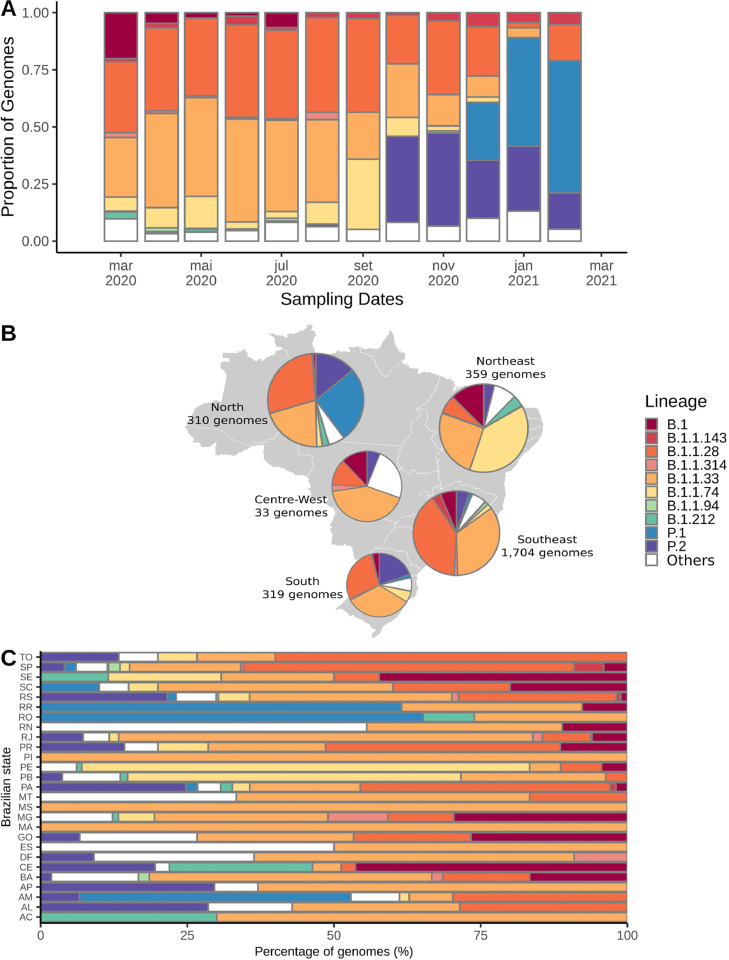
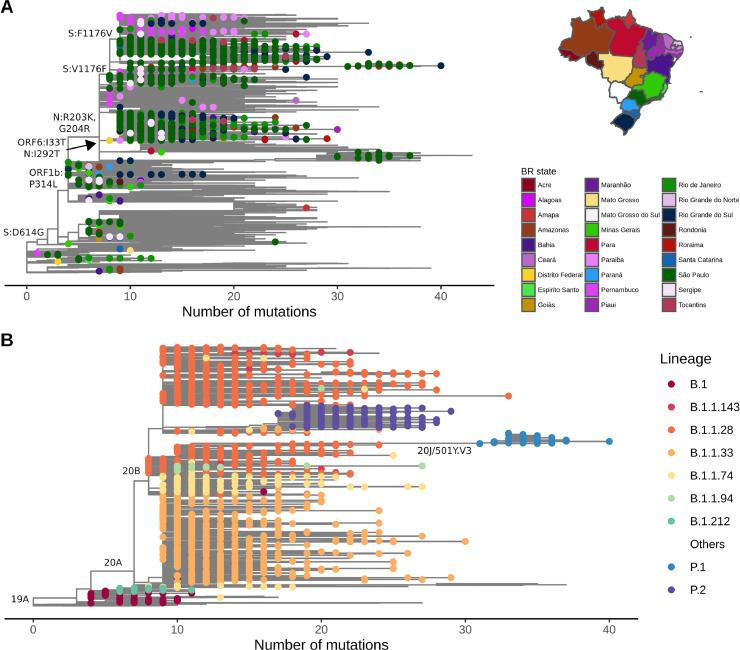
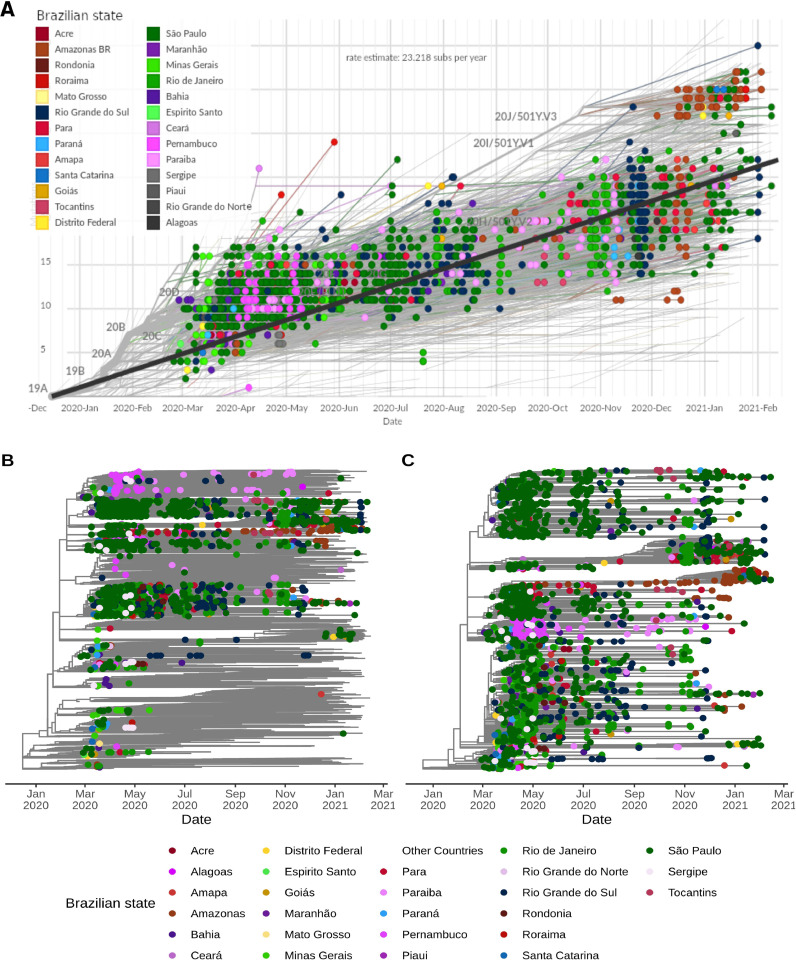
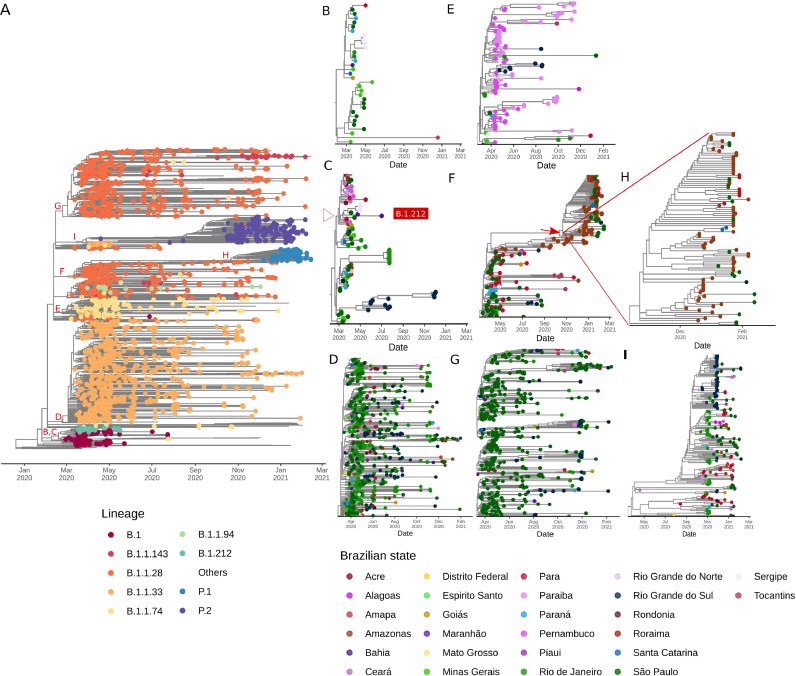
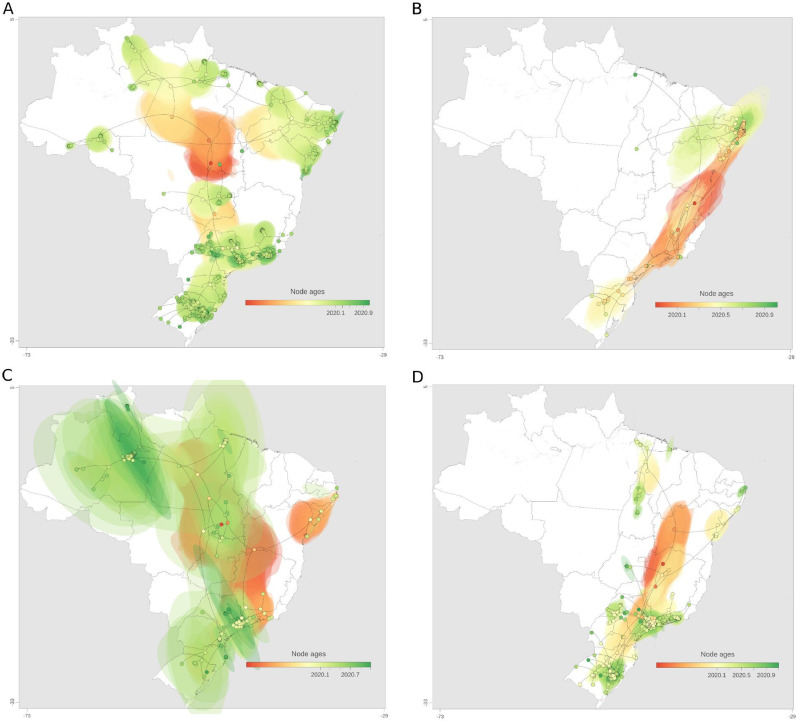
The COVID-19 pandemic has already reached more than 110 million people and is associated with 2.5 million deaths worldwide. Brazil is the third worst-hit country, with approximately 10.2 million cases and 250 thousand deaths. International efforts have been established to share information about Severe acute respiratory syndrome coronavirus 2 (SARS-CoV-2) epidemiology and evolution to support the development of effective strategies for public health and disease management. We aimed to analyze the high-quality genome sequences from Brazil from February 2020-2021 to identify mutation hotspots, geographical and temporal distribution of SARS-CoV-2 lineages by using phylogenetics and phylodynamics analyses. We describe heterogeneous sequencing efforts, the progression of the different lineages along time, evaluating mutational spectra and frequency oscillations derived from the prevalence of specific lineages across different Brazilian regions. We found at least seven major (1-7) and two minor clades related to the six most prevalent lineages in the country and described its spatial distribution and dynamics. The emergence and recent frequency shift of lineages (P.1 and P.2) carrying mutations of concern in the spike protein (e. g., E484K, N501Y) draws attention due to their association with immune evasion and enhanced receptor binding affinity. Improvements in genomic surveillance are of paramount importance and should be extended in Brazil to better inform policy makers about better decisions to fight the COVID-19 pandemic.

Keywords: COVID-19; High-Throughput Nucleotide Sequencing; Infectious diseases; Molecular Epidemiology; Phylogeography; Severe acute respiratory syndrome coronavirus 2.


Conflict of interest statement

The authors declare no competing interests.

Figures

Fig 1
Fig. 1
Distribution of Brazilian genomes through time (end-February 2020 to mid-February 2021) and space (Brazilian states). (A) Number of new cases per day in Brazil over time. (B) Number of genomes (sequenced cases) in Brazil over time (date of sample collection). (C) Fraction of genomes sequenced related to number of cases per Brazilian state. (D) Total number of genomes deposited per Brazilian state. (E) Total number of different SARS-CoV-2 lineages detected per Brazilian state. State abbreviations: AC=Acre; AL=Alagoas; AM=Amazonas; Amapá=AP; BA=Bahia; CE=Ceará; DF=Distrito Federal; ES=Espírito Santo; GO=Goiás; MA=Maranhão; MG=Minas Gerais; MS=Mato Grosso do Sul; MT=Mato Grosso; PA=Pará; PE=Pernambuco; PB=Paraíba; PI=Piauí; PR=Paraná; RJ=Rio de Janeiro; RN=Rio Grande do Norte; RO=Rondônia; RR=Roraima; RS=Rio Grande do Sul; SC=Santa Catarina; SE=Sergipe; SP=São Paulo; TO=Tocantins.
Fig 2
Fig. 2
High frequent mutations across Brazilian sequences. Nucleotide replacements occurring in >250 genomes are indicated in red and associated amino acid substitutions in blue. Other mutations occurring in less than 250 genomes but more than 100 are indicated in Table 1. Syn: Synonymous.
Fig 3
Fig. 3
Distribution of the 10 most prevalent SARS-CoV-2 lineages (n>25) inside Brazil from end-February 2020 to mid-February 2021. (A) Frequency of these lineages through time in the entire Brazil. (B) Map showing the fraction of each of these lineages across all five Brazilian regions. (C) Distribution of these lineages across all Brazilian states, proportional to the number of sequenced genomes.
Fig 4
Fig. 4
Evolutionary distribution of SARS-CoV-2 genomes from Brazil. (A) Maximum likelihood phylogenetics tree of 2,346 Brazilian sequences and 8,227 additional global representative genomes. States belonging to each specific Brazilian region are colored using similar colors depicted in the map (Centre-West: yellow; North: red; Northeast: purple and pink; South: blue; Southeast: green). Key mutations are represented in the respective branches. (B) Maximum likelihood phylogenetics tree dropping sequences from other countries and highlighting the most frequent Brazilian lineages presented in Fig. 3. Nextstrain clades are represented in key branches. Evolutionary rate is represented by the number of mutations (divergences) related to SARS-CoV-2 reference sequence (NC_045512.2).
Fig 5
Fig. 5
Molecular clock estimates of SARS-CoV-2 genomes from Brazil. (A) Root-to-tip regression of genetic distances (in number of mutations) against sampling dates filtered by Brazilian sequences. States belonging to each specific Brazilian region are colored using similar colors (Centre-West: yellow; North: red; Northeast: pink and gray; South: blue; Southeast: green). Nextstrain clades are represented in key branches. (B) Time-resolved Maximum Likelihood phylogenetics tree of the 10,573 worldwide genomes included colored by Brazilian states. (C) Maximum likelihood phylogenetics tree considering only the dynamics inside Brazil. In (B) and (C), state colorings follow the same scheme as (A), except for Northeast, where purple and pink colors define sequences from this region. Tree topology remains the same for these two trees, but node ordering is slightly different.
Fig 6
Fig. 6
Zoom-in on clades corresponding to the major six Brazilian lineages. (A) Time-resolved ML tree of Brazilian sequences colored by PANGO lineages. Letters around clades are augmented in the respective figures and colored by Brazilian states. (B) Clade 1 is represented by sequences from the B.1 lineage. (C) Clade 2 has sequences from the B.1 and B.1.212 lineages (D) Clade 3 corresponds to the B.1.1.33 lineage. (E) Clade 4 is represented by B.1.1.74 genomes. (F) Clade 5 harbor sequences from B.1.1.28 and P.1. (G) Clade 6 has sequences from the B.1.1.28 lineage. (H) Zoom-in on P.1 sequences from Clade 5. (I) Clade 7 corresponds to the P.2 lineage. From (B) to (I), states belonging to each specific Brazilian region are colored using similar colors (Centre-West: yellow; North: red; Northeast: purple and pink; South: blue; Southeast: green).
Fig 7
Fig. 7
Spatiotemporal reconstruction of the dispersal history of SARS-CoV-2 in Brazil in the first year of the COVID-19 pandemic. Reconstructions of (A) Clade 3, (B) Clade 4, (C) Clade 5, and (D) Clade 6 are represented. MCC trees and 80% HPD regions are based on 1,000 trees subsampled from the posterior distribution of a continuous phylogeographic analysis. Nodes of the MCC tree are coloured according to their time of occurrence. 80% HPD regions were computed for successive time layers and then superimposed using the same colour scale reflecting time

References

    1. Ayres D.L., Darling A., Zwickl D.J., Beerli P., Holder M.T., Lewis P.O., Huelsenbeck J.P., Ronquist F., Swofford D.L., Cummings M.P., Rambaut A., Suchard M.A. BEAGLE: an application programming interface and high-performance computing library for statistical phylogenetics. Syst. Biol. 2012;61:170–173. doi: 10.1093/sysbio/syr100. https://doi.org/ - DOI - PMC - PubMed
    1. Bartolini B., Rueca M., Gruber C.E.M., Messina F., Carletti F., Giombini E., Lalle E., Bordi L., Matusali G., Colavita F., Castilletti C., Vairo F., Ippolito G., Capobianchi M.R., Caro A.D. SARS-CoV-2 Phylogenetic analysis, Lazio Region, Italy, February–March 2020. Emerg. Infect. Dis. 2020;26 doi: 10.3201/eid2608.201525. https://doi.org/ - DOI - PMC - PubMed
    1. Baum A., Fulton B.O., Wloga E., Copin R., Pascal K.E., Russo V., Giordano S., Lanza K., Negron N., Ni M., Wei Y., Atwal G.S., Murphy A.J., Stahl N., Yancopoulos G.D., Kyratsous C.A. Antibody cocktail to SARS-CoV-2 spike protein prevents rapid mutational escape seen with individual antibodies. Science. 2020;369:1014–1018. doi: 10.1126/science.abd0831. https://doi.org/ - DOI - PMC - PubMed
    1. Bielejec F., Baele G., Vrancken B., Suchard M.A., Rambaut A., Lemey P. SpreaD3: interactive visualization of spatiotemporal history and trait evolutionary processes. Mol. Biol. Evol. 2016;33:2167–2169. doi: 10.1093/molbev/msw082. https://doi.org/ - DOI - PMC - PubMed
    1. Buss L.F., Prete C.A., Abrahim C.M.M., Mendrone A., Salomon T., Almeida-Neto C.de, França R.F.O., Belotti M.C., Carvalho M.P.S.S., Costa A.G., Crispim M.A.E., Ferreira S.C., Fraiji N.A., Gurzenda S., Whittaker C., Kamaura L.T., Takecian P.L., Peixoto P.da S., Oikawa M.K., Nishiya A.S., Rocha V., Salles N.A., Santos A.A.de S., Silva M.A.da, Custer B., Parag K.V., Barral-Netto M., Kraemer M.U.G., Pereira R.H.M., Pybus O.G., Busch M.P., Castro M.C., Dye C., Nascimento V.H., Faria N.R., Sabino E.C. Three-quarters attack rate of SARS-CoV-2 in the Brazilian Amazon during a largely unmitigated epidemic. Science. 2020 doi: 10.1126/science.abe9728. https://doi.org/ - DOI - PMC - PubMed

Publication types

Substances