. 2021 Sep:285:114215.
doi: 10.1016/j.socscimed.2021.114215. Epub 2021 Jul 31.

Emergence of knowledge communities and information centralization during the COVID-19 pandemic

Affiliations

Emergence of knowledge communities and information centralization during the COVID-19 pandemic

Pier Luigi Sacco et al. Soc Sci Med. 2021 Sep.

Abstract

Background: As COVID-19 spreads worldwide, an infodemic - i.e., an over-abundance of information, reliable or not - spreads across the physical and the digital worlds, triggering behavioral responses which cause public health concern.

Methods: We study 200 million interactions captured from Twitter during the early stage of the pandemic, from January to April 2020, to understand its socio-informational structure on a global scale.

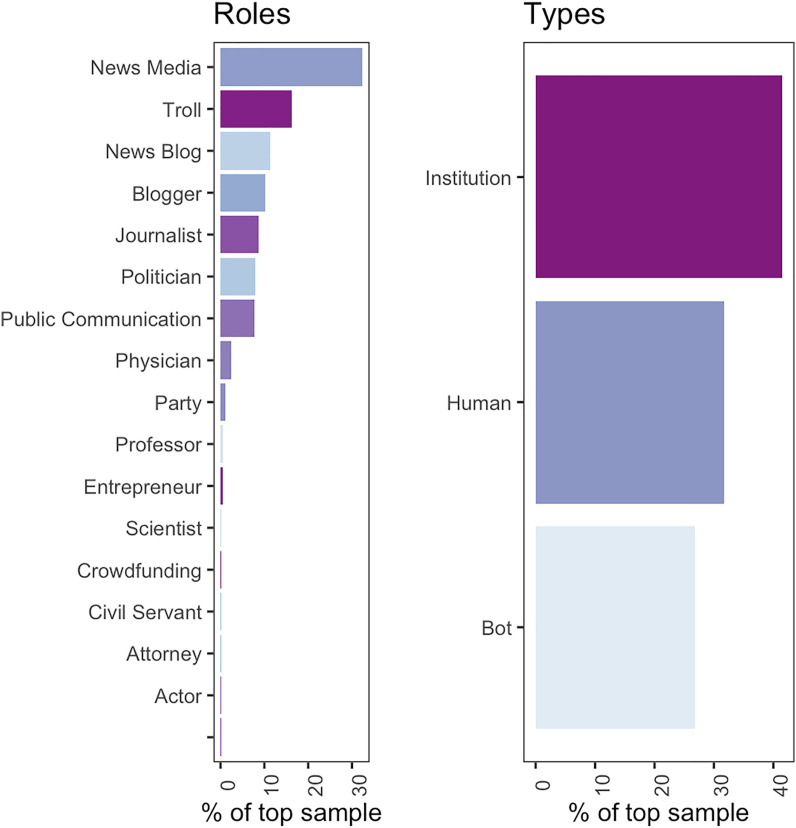
Findings: The COVID-19 global communication network is characterized by knowledge groups, hierarchically organized in sub-groups with well-defined geo-political and ideological characteristics. Communication is mostly segregated within groups and driven by a small number of subjects: 0.1% of users account for up to 45% and 10% of activities and news shared, respectively, centralizing the information flow.

Interpretation: Contradicting the idea that digital social media favor active participation and co-creation of online content, our results imply that public health policy strategies to counter the effects of the infodemic must not only focus on information content, but also on the social articulation of its diffusion mechanisms, as a given community tends to be relatively impermeable to news generated by non-aligned sources.

Keywords: Global Communication; Infodemic; Public Health.


Conflict of interest statement

The authors declare no competing financial interests and no conflict of interests.

Figures

Fig. 1
Fig. 1
Map of the online global COVID-19 communication network on Twitter. We display a web of about 1.1 million social interactions about COVID-19 observed worldwide between 22 January and April 16, 2020. Nodes represent about 0.4 million user accounts and links encode their social interactions aggregated over the observational period. Nodes are colored according to their social group inferred using the Louvain method. Only nodes belonging to groups which are at least 0.1% of system size are colored, i.e., the smallest colored group consists of about 400 accounts. A label with the account name is shown for extremely active users, the one with an overall social activity of at least 3500 interactions (either active or passive). The network exhibits a highly heterogeneous, modular and hierarchical organization, confirmed by our quantitative measurements. See text for details.
Fig. 2
Fig. 2
Mesoscale organization of the COVID-19 communication network. Accounts shown in Fig. 1 are clustered together into a supernode, denoting their group, and interactions across groups are aggregated to build a map of intercommunity communications. Sectors are labeled by the corresponding group identifier (see Table 1) and colored accordingly. Note that 0 here encodes the group of all accounts belonging to groups smaller than 0.1% of system size, i.e., with less than 400 users, and we are showing only the 10% strongest interactions for sake of clarity. The network of groups exhibits a non-trivial connectivity pattern, typical of communication systems.
Fig. 3
Fig. 3
Functional organization of the COVID-19 communication network. User accounts are enriched by the type of information they share, quantified from the classification of URLs appended to their messages during the observational period. We have two types of information: one, shown in the top panel, related to the media source classification provided by human experts in terms of: mainstream media, science, political, fake/hoax, conspiracy/junk science, clickbait and satire; another one, shown in the bottom panel, providing a finer classification of political media sources in terms of ideological orientation (left, left-center, neutral (least biased), right and right-center).
Fig. 4
Fig. 4
Social activities and information sharing is highly centralized rather than decentralized. Left: The fraction of social activities versus the fraction of unique users they involve is shown by box plots encoding the distribution across distinct groups and transparent points encoding the empirical values. The analysis reveals that a median of about 20% of activities involves only 0.1% of accounts, whereas up to 50% of activities are accounted for by 1% of users, denoting a striking centralization of actions. The inset shows the distribution of the Gini coefficient, an independent measure to quantify distribution inequality, with an average of 0.72 which is dramatically high. Right: as for the left panel but considering the fraction of news shared instead of social actions. Again, a high centralization is observed, with 1% of users accounting for up to 25% of circulating news (median of about 20%), and an average Gini coefficient of 0.65, still very high.
Fig. 5
Fig. 5
Connectivity patterns of the communication network are not trivial. The structure of the communication network is tested against its configuration model, preserving its connectivity distribution while washing out topological correlations. For each group separately, we measure average local and global transitivity (quantifying the tendency of accounts to local triadic closure); assortative mixing (quantifying the tendency of accounts to connect to accounts with similar number of connections); and modularity (quantifying the organization of accounts in groups within the group). Values estimated for the observed groups are encoded by solid dark points, whereas values obtained from null models (a baseline equivalent to the system studied where most correlations are destroyed) and averaged across 20 independent realizations are shown with lighter markers and segment denoting the 95% variation around the expected values. The vertical dashed lines encode median values across groups. Overall, the results indicate that some measured features are not observed by chance: most of the groups are characterized by a lack of triadic relationships and a stronger organization into sub-groups, a hallmark of hierarchical organization.
Fig. 6
Fig. 6
Aggregated statistics of the roles and types of the top 20 most active accounts for each group. Thanks to our annotation (see Methods) we gain insights on the most active users leading the Twitter conversation about COVID-19 in different communities. Users are labeled according to the different role played (left panel) and their types (right panel): i) institutional (e.g., public communication, news media agencies); ii) human (e.g., bloggers, journalists, politicians, physicians and trolls); and iii) bots functional (news blogs and automated trolls). Official accounts of institutional news media are the most present, followed by trolls (about 90% are bots) and accounts handled by communication professionals (automated news blogs, human bloggers, journalists, politicians and public communication agencies). A very minor role is played by health and science experts (physicians, professors and scientists). Note that the last row in the left panel refers to non-annotated users.
Fig. 7
Fig. 7
Statistics of the geographical origin of the top 20 most active accounts for a selection of groups. The 20 groups, whose most active influencers belong to more than a single country, are shown. For graphical reasons we excluded the group 105 “Germany”, with 19 influencers from Germany and one from Mongolia, while all other 23 groups have only a single country represented (see Supplementary Materials). The donut charts show the distribution of accounts' nationalities for each group, where INTER stands for international. In some cases the distribution is heterogeneous, like for groups discussing international news. Discussion around Venezuela politics also involves various influencers from Latin America. The peculiar community of K-Pop fans, while centered around a large fraction of South Korean influencers, breaks cultural and linguistic borders being, together with the “Nigeria news” group, the community with the most diverse influencer origins. Notice how the most heterogeneous groups often present highly peculiar mixes of countries that seem to reflect complex geopolitical patterns.
figs1
figs1
figs2
figs2

References

    1. Abel G.J., Sander N. Quantifying global international migration flows. Science. 2014;343:1520–1522. - PubMed
    1. Allen D. University of Chicago Press; 2016. Education and Equality.
    1. E. Bakshy, B. Karrer, L. A. Adamic, Social influence and the diffusion of usercreated content, in: Proceedings of the 10th ACM Conference on Electronic Commerce, pp. 325–334.
    1. Barber′a P., Jost J.T., Nagler J., Tucker J.A., Bonneau R. Tweeting from left to right: is online political communication more than an echo chamber? Psychol. Sci. 2015;26:1531–1542. - PubMed
    1. Bergstrom A., Jervelycke Belfrage M. News in social media: incidental consumption and the role of opinion leaders. Digital Journalism. 2018;6:583–598.

Publication types