. 2021 Sep 20;49(16):9264-9279.
doi: 10.1093/nar/gkab683.

A cascade of transcriptional repression determines sexual commitment and development in Plasmodium falciparum

Affiliations

A cascade of transcriptional repression determines sexual commitment and development in Plasmodium falciparum

Xiaomin Shang et al. Nucleic Acids Res. .

Abstract

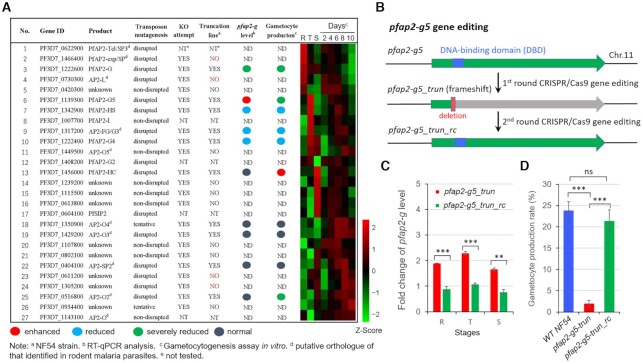
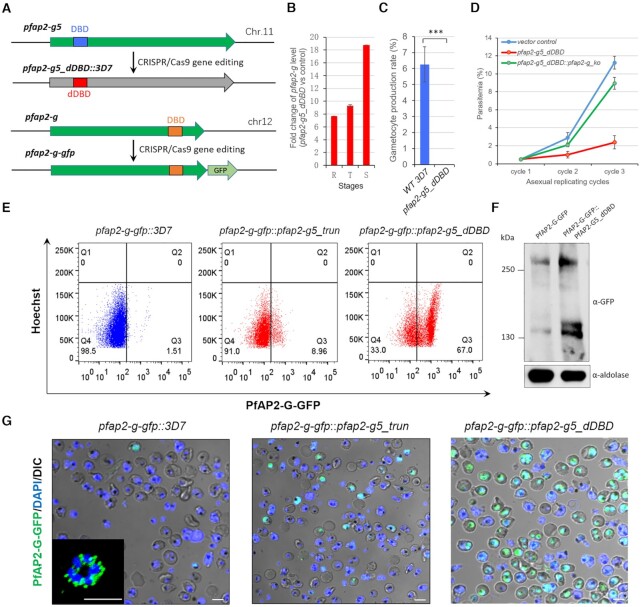
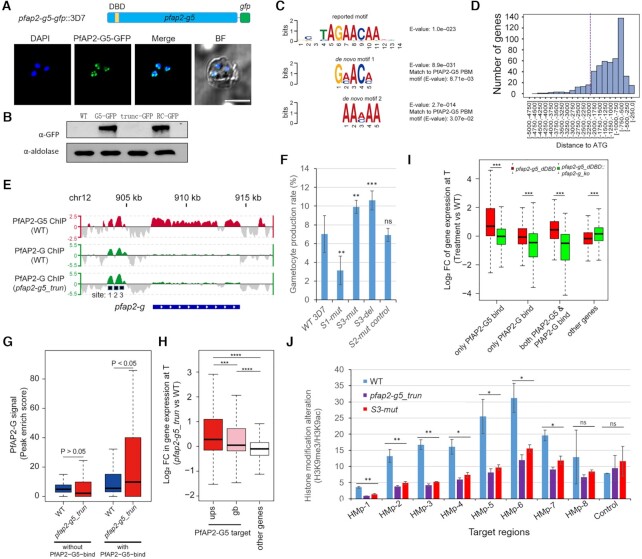
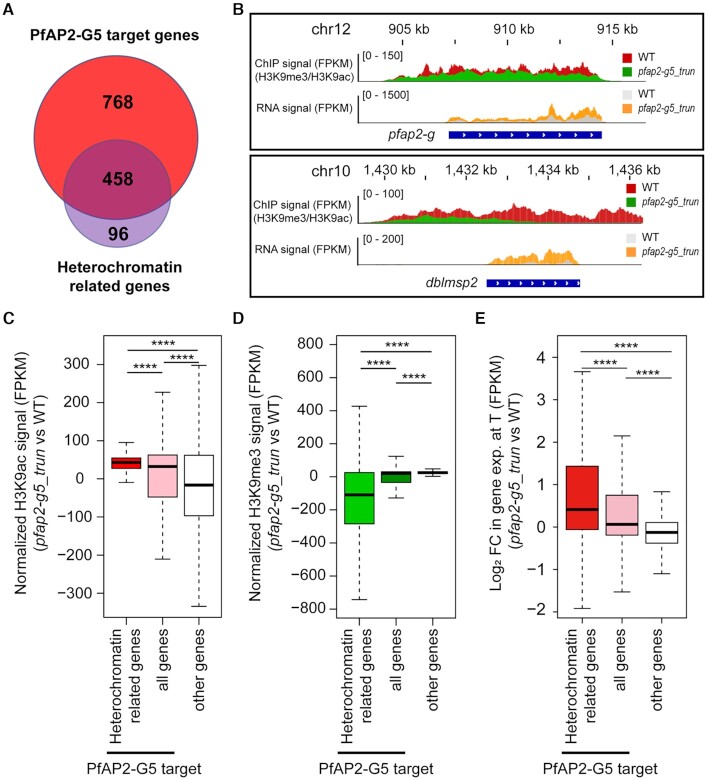
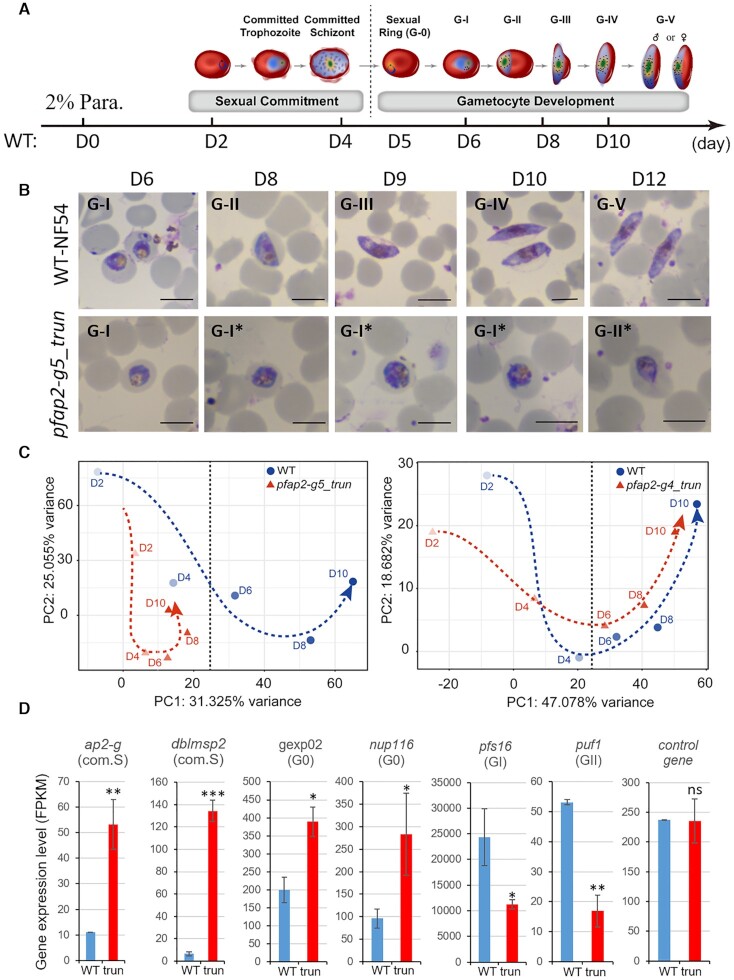
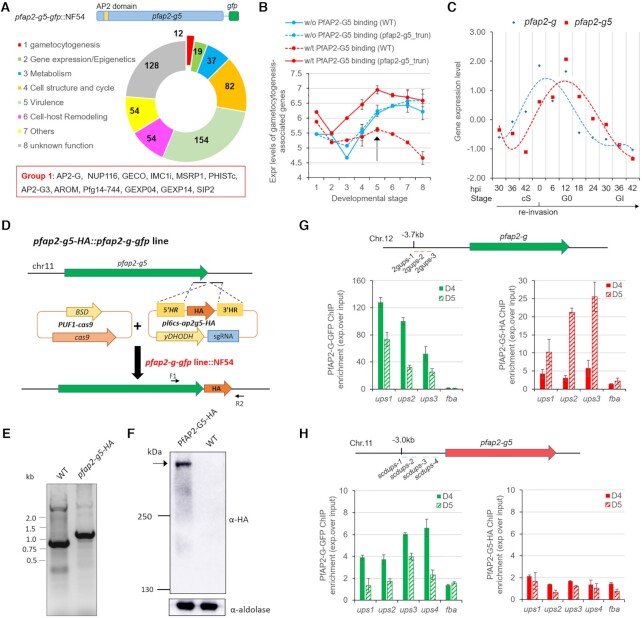
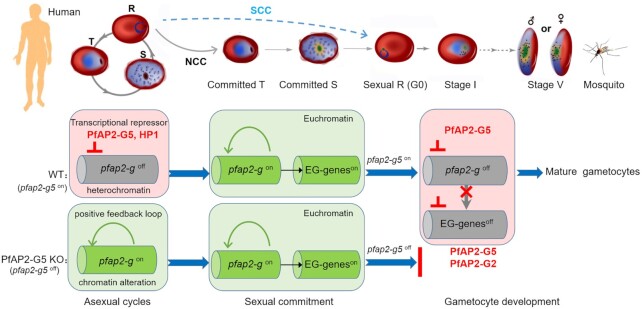
Gametocytogenesis, the process by which malaria parasites produce sexual forms that can infect mosquitoes, is essential for the transmission of malaria. A transcriptional switch of the pfap2-g gene triggers sexual commitment, but how the complex multi-step process is precisely programed remains largely unknown. Here, by systematic functional screening of a panel of ApiAP2 transcription factors, we identify six new ApiAP2 members associated with gametocytogenesis in Plasmodium falciparum. Among these, PfAP2-G5 (PF3D7_1139300) was found to be indispensable for gametocytogenesis. This factor suppresses the transcriptional activity of the pfap2-g gene via binding to both the upstream region and exonic gene body, the latter is linked to the maintenance of local heterochromatin structure, thereby preventing initiation of sexual commitment. Removal of this repressive effect through pfap2-g5 knockout disrupts the asexual replication cycle and promotes sexual commitment accompanied by upregulation of pfap2-g expression. However, the gametocytes produced fail to mature fully. Further analyses show that PfAP2-G5 is essential for gametocyte maturation, and causes the down-regulation of pfap2-g and a set of early gametocyte genes activated by PfAP2-G prior to gametocyte development. Collectively, our findings reveal a regulation cascade of gametocyte production in malaria parasites, and provide a new target for transmission blocking interventions.


Figures

Figure 1.
Figure 1.
Functional screening of ApiAP2 family for gametocyte production. (A) Phenotype summary of a CRISPR–Cas9 knockout screen of ApiAP2 genes in NF54 strains. The transcriptional abundancies of the pfap2-g gene were measured by RT-qPCR analysis for three biological replicates for each transgenic parasite line at 30–40 hpi. Gametocyte production rates were quantified by measuring the proportion of all gametocytes among infected RBCs, when mature forms were observed. Expression data of individual stages including asexual rings (R), trophozoites (T) and schizonts (S), and continuous timepoints over the course of gametocytogenesis (see Figure 5A) were measured by RNA-seq. RNA-seq data was normalized as Z-Scores. Conflicting results between transposon mutagenesis and frameshift-based KO approaches are indicated in red font, and the days on the top of the heatmap indicate the stages during gametocytogenesis. For detailed information, see Supplementary Table S2. (B) Schematic representation of the constructs of pfap2-g5_trun and pfap2-g5_trun_rc lines. The pfap2-g5_trun line was used a parental line for the 2nd transfection. (C) Fold-change in pfap2-g transcription of pfap2-g5_trun::NF54 or pfap2-g5_trun_rc::NF54 lines over WT NF54 line in ring (R), trophozoite (T), schizont (S). The data are from two replicates of RNA-seq analysis. (D) Gametocyte formation rate in NF54, pfap2-g5_trun::NF54 and pfap2-g5_trun_rc::NF54 line. The statistical analysis: ***P< 0.001, **P< 0.01, *P< 0.05, ‘ns’: not significant (unpaired two-tailed Student's t-test). The error bars represent s.e.m. for two replicates (C) or three replicates (D).
Figure 2.
Figure 2.
Loss of PfAP2-G5 promotes sexual commitment by activating pfap2-g gene but abolishes gametocyte production. (A) Schematic representation of pfap2-g5_dDBD line (upper) and pfap2-g-gfp line (bottom). DBD: DNA-binding domain. (B) Fold-change in pfap2-g transcription of pfap2-g5_dDBD over 3D7 line in asexual stages. The data are from RNA-seq analysis with two independent replicates. (C) Gametocyte formation rate in pfap2-g5_dDBD and 3D7 lines. (D) Growth rate analysis of pfap2-g5_dDBD, pfap2-g5_dDBD::pfap2-g_ko and vector control lines. (E) FACS assays of PfAP2-G-positive sub-population signal with late-stage parasites (30–40 hpi) from 3D7, pfap2-g5_trun, pfap2-g5_dDBD lines carrying PfAP2-G-GFP fusion protein. The detailed gating strategy is shown in Supplementary Figure S6. The nuclei are stained with Hoechst. (F) Western-blot analysis of PfAP2-G-GFP in pfap2-g-gfp and pfap2-g-gfp::pfap2-g5_dDBD lines by using anti-GFP antibody. The Pfaldolase was used as an internal control. (G) Live-cell fluorescence assays of PfAP2-G signal (green) with late stage parasites (30–40 hpi) from 3D7, pfap2-g5_trun, pfap2-g5_dDBD lines carrying PfAP2-G-GFP fusion protein. The nuclei are stained with DAPI (blue). Scale bar: 5 μm. The statistical analysis: ***P< 0.001, **P< 0.01, *P< 0.05, ns: not significant (unpaired two-tailed Student's t-test). The error bars represent s.e.m. for two biological replicates (B), or three replicates (C, D).
Figure 3.
Figure 3.
PfAP2-G5 represses PfAP2-G expression via targeting the URR for maintenance of the integrity of local heterochromatin structure surrounding pfap2-g gene. (A) Upper: Schematic representation of the construct of pfap2-g5-gfp::3D7. Bottom: Live-cell fluorescence assay of PfAP2-G5-GFP (green). Nuclei are stained with DAPI (blue). Scale bar: 5 μm. (B) Western-blot analysis of pfap2-g5-gfp, pfap2-g5_trun-gfp, pfap2-g5_trun-rc-gfp lines at schizont stage. The Pfaldolase was used as an internal control. (C) DREME logos for the de novo motif enriched within trophozoite-stage PfAP2-G5 binding sites upstream of its target genes in vivo and the matching reported ApiAP2 binding motif (the top one) in vitro identified by Tomtom (39). (D) The distribution of PfAP2-G5-binding sites relative to the start codon of target genes. (E) Track view of the normalized signals (Log2-transformed ChIP/input ratio) at the pfap2-g gene locus for PfAP2-G5 in WT parasites (upper; red) and PfAP2-G in WT and pfap2-g5_trun parasites (bottom; green) in asexual trophozoites. One of the two biological replicates is shown. Three sites with mutations are indicated by black squares at the bottom. (F) Gametocyte production in parasites lines shown in the motif mutagenesis analysis (Supplementary Figure S10). (G) Box plots showing PfAP2-G binding signal (peak enrich score calculated from MACS2; higher score means higher enrichment) on the PfAP2-G5 target genes or non-target genes in WT and pfap2-g5_trun parasites in asexual trophozoites. The average values from two independent replicates are shown. P value: unpaired Wilcoxon rank test. (H) Box plots showing fold change (log2) in transcriptional levels of pfap2-g5_trun over WT parasites of target genes bound by PfAP2-G5 at upstream (ups) regions or gene body (gb) regions and non-target genes in asexual trophozoites by RNA-seq (the detailed transcriptomes are shown in Supplementary Table S5). The average values from two independent replicates are shown. P value: unpaired Wilcoxon rank test. (I) Box plots showing fold change (log2) in transcriptional levels of pfap2-g5_dDBD over WT parasites (red) or pfap2-g5_dDBD::pfap2-g_ko: over WT parasites of different groups of target genes, i.e. only PfAP2-G5-binding at upstream (ups) regions, only PfAP2-G-binding at upstream (ups) regions, both PfAP2-G5 and PfAP2-G-binding at upstream (ups) regions, and other non-binding genes for the two factors in asexual trophozoites by RNA-seq (the detailed transcriptomes are provided in Supplementary Table S9). The average values from two independent replicates were shown. P value: paired Wilcoxon rank test. (J) ChIP-qPCR analysis of histone modification changes (H3K9me3 over H3K9ac) at the pfap2-g gene locus in WT, pfap2-g5_trun, and S3-mut lines. The target regions for amplification are shown in Supplementary Figure S10G. Control gene: fba. In the (G-I): Boxes indicate the 25th to 75th percentiles. The horizontal lines within the boxes are the median values. The statistical analysis: ****P< 0.0001, ***P< 0.001, **P< 0.01, *P< 0.05, ns: not significant (unpaired two-tailed Student's t-test). The error bars represent s.e.m. for three replicates (F, J).
Figure 4.
Figure 4.
PfAP2-G5 regulates heterochromatic genes via chromatin alteration. (A) Venn diagram showing overlap between target genes bound by PfAP2-G5 in asexual trophozoites and heterochromatic genes (Supplementary Tables S5, S10 and S11). (B) Track view of the histone modification signal (H3K9me3/H3K9ac ratio) and in transcriptional levels (FPKM) in WT or pfap2-g5_trun parasites at the pfap2-g gene locus (upper) and dblmsp2 gene locus (bottom) in asexual trophozoites. (CD) Box plots showing the change of H3K9ac (C) and H3K9me3 (D) of pfap2-g5_trun subtract WT parasites of heterochromatin related genes bound by PfAP2-G5, all target genes bound by PfAP2-G5 and other non-target genes in asexual trophozoites by ChIP-seq. The average values from two independent replicates were shown. P value: unpaired Wilcoxon rank test. (E) Box plots showing fold change (log2) in transcriptional levels of pfap2-g5_trun over WT parasites of heterochromatin related genes bound by PfAP2-G5, all target genes bound by PfAP2-G5 and other non-target genes in asexual trophozoites by RNA-seq. The average values from two independent replicates are shown. P value: unpaired Wilcoxon rank test. In the (C–E) Boxes indicate the 25th to 75th percentiles. The horizontal lines within the boxes are the median values. The statistical analysis: ****P< 0.0001, ***P< 0.001, **P< 0.01, *P< 0.05, ns: not significant.
Figure 5.
Figure 5.
PfAP2-G5 is essential for the development of early-stage gametocytes. (A) A schematic model of the continuous developmental stages of parasites from sexual commitment to mature gametocytes. The transition from sexual commitment (committed schizont) to developmental stage (sexual ring) is indicated by a dashed vertical line. The sampling time points (day) for transcriptome analysis of WT line are indicated at the bottom. Abbreviation indicate parasitemia (Para.). Parasite drawings were plotted with Adobe Illustrator software commercially licensed to Tongji University. (B) Representative images of Giemsa's solution stained thin smears of WT NF54 and pfap2-g5_trun parasites during gametocytogenesis in vitro (D6–D12). The asexual forms were killed by NAG treatment for 5 consecutive days from G0 stage (D5). Scale bar: 5 μm. *: dying parasites with abnormal morphology. More images are also shown in Supplementary Figure S12. (C) PCA analysis showing transcriptomic profiles of pfap2-g5_trun::NF54 versus NF54 and pfap2-g4_trun::NF54 versus NF54 parasite lines over the course of gametocytogenesis measured by RNA-seq. The KO lines are shown with dashed red lines and WT with blue lines. Dashed black vertical lines indicate the transition from committed schizonts and sexual rings. (D) Gene expression levels of some representative gametocytogenesis-associated marker genes in WT and pfap2-g5_trun lines detected by RNA-seq. Control: seryl-tRNA synthetase (PF3D7_0717700). ***P< 0.001, **P< 0.01, *P< 0.05, ns: not significant (unpaired two-tailed Student's t-test). The error bars represent s.e.m. for two biological replicates of RNA-seq anlaysis.
Figure 6.
Figure 6.
Reciprocal regulation between PfAP2-G5 and PfAP2-G is involved in the dynamic expression of EG genes at the early gametocyte stages. (A) Upper: schematic representation of the construct of pfap2-g5-gfp::NF54. Middle: functional categorization of the 540 PfAP2-G5-bound genes at the time point D5 approximately corresponding to G0. Gene numbers are shown in the circular graph. Bottom: gene list of the gametocytogenesis group in the red rectangle. The full list of PfAP2-G5 target genes is shown in Supplementary Table S12. (B) Transcriptional dynamics of all reported gametocytogenesis-associated genes in pfap2-g5_trun and WT NF54 lines measured by RNA-seq. These genes are classified into two groups bound by PfAP2-G5 (red lines) or not (blue lines) in their upstream regions. The arrow indicates the timepoint when PfAP2-G5-bound gametocytogenesis genes are precipitously down-regulated. ***P < 0.001, unpaired Wilcoxon rank test. ns: not significant. (C) Transcriptional profiles of pfap2-g (blue line) and pfap2-g5 (red line) genes across the sexual commitment and early gametocyte development from the microarray data of Josling et al. (9). The timepoints corresponding to the stage of committed schizonts (cS), sexual rings (G0) and gametocyte I (GI) are indicated below the axis x. (D) Schematic representation of the generation of pfap2-g5-HA::pfap2-g-gfp line in the NF54 line. The location of individual PCR primer for gDNA PCR validation are indicated in this gene locus (primer sequences are listed in Supplementary Table S1). (E) PCR validation of the HA-fusion genes in pfap2-g-gfp and WT lines. (F) Western-blot analysis of PfAP2-G5-HA in pfap2-g-gfp line by using anti-HA antibody. The Pfaldolase was used as an internal control. The full-length PfAP2-G5-HA protein is indicated by an arrow. (GH) ChIP-qPCR analysis of PfAP2-G (anti-GFP) and PfAP2-G5 (anti-HA) for the binding levels within the upstream region of pfap2-g or pfap2-g5 gene. For pfap2-g gene, only the URR region was measured as shown in Supplementary Figure S10. The samples were harvested in D4 or D5 (see Figure 5A) for PfAP2-G5-HA::PfAP2-G-GFP::NF54 line. The fba (PF3D7_1444800) gene was used as negative control. The error bars represent s.e.m. for two biological replicates of RNA-seq analysis (B) or three replicates of ChIP-qPCR (G, H).
Figure 7.
Figure 7.
A model of how PfAP2-G5 programs the regulation cascade for gametocytogenesis in P. falciparum parasites. In the asexual cycle, PfAP2-G5 suppresses the pfap2-g gene to prevent the initiation of sexual commitment (left) via maintenance of the HP1-dependent heterochromatin structure at the pfap2-g gene locus. When it is removed from the upstream regulatory region of pfap2-g, sexual commitment is triggered by either NCC or SCC pathway upon pfap2-g gene activation, which is accompanied with local chromatin alteration. Subsequently, pfap2-g activates a set of early gametocyte (EG) genes (middle), but their transcription activities including pfap2-g itself will be suppressed by PfAP2-G5 during early gametocyte development, or parasite development is arrested (right).

References

    1. Josling G.A., Llinás M.. Sexual development in Plasmodium parasites: knowing when it's time to commit. Nat. Rev. Microbiol. 2015; 13:573–587. - PubMed
    1. Josling G.A., Williamson K.C., Llinás M.. Regulation of sexual commitment and gametocytogenesis in malaria parasites. Annu. Rev. Microbiol. 2018; 72:501–519. - PMC - PubMed
    1. Kafsack B.F.C., Rovira-Graells N., Clark T.G., Bancells C., Crowley V.M., Campino S.G., Williams A.E., Drought L.G., Kwiatkowski D.P., Baker D.A.et al. .. A transcriptional switch underlies commitment to sexual development in malaria parasites. Nature. 2014; 507:248–252. - PMC - PubMed
    1. Sinha A., Hughes K.R., Modrzynska K.K., Otto T.D., Pfander C., Dickens N.J., Religa A.A., Bushell E., Graham A.L., Cameron R.et al. .. A cascade of DNA-binding proteins for sexual commitment and development in Plasmodium. Nature. 2014; 507:253–257. - PMC - PubMed
    1. Poran A., Notzel C., Aly O., Mencia-Trinchant N., Harris C.T., Guzman M.L., Hassane D.C., Lemento O.E., Kafsack B.F.C.. Single-cell RNA sequencing reveals a signature of sexual commitment in malaria parasites. Nature. 2017; 551:95–99. - PMC - PubMed

Publication types

MeSH terms