. 2021 Aug 9;19(1):191.
doi: 10.1186/s12916-021-02056-8.

One-year follow-up of chest CT findings in patients after SARS-CoV-2 infection

Affiliations

One-year follow-up of chest CT findings in patients after SARS-CoV-2 infection

Yanfei Chen et al. BMC Med. .

Abstract

Background: Knowledge about the 1-year outcome of COVID-19 is limited. The aim of this study was to follow-up and evaluate lung abnormalities on serial computed tomography (CT) scans in patients with COVID-19 after hospital discharge.

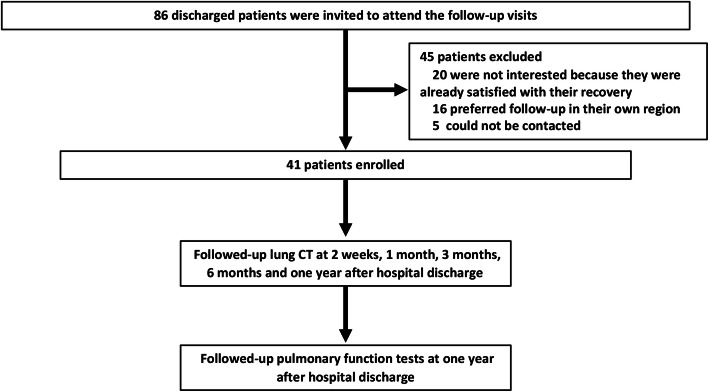
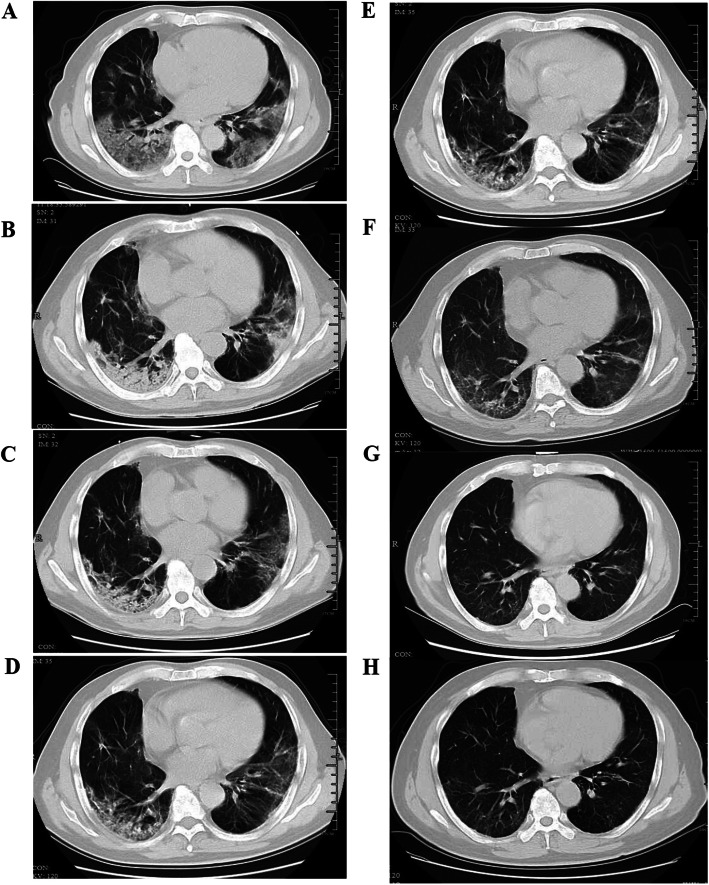
Methods: A prospective cohort study of patients with COVID-19 from the First Affiliated Hospital, Zhejiang University School of Medicine was conducted, with assessments of chest CT during hospitalization and at 2 weeks, 1 month, 3 months, 6 months, and 1 year after hospital discharge. Risk factors of residual CT opacities and the influence of residual CT abnormalities on pulmonary functions at 1 year were also evaluated.

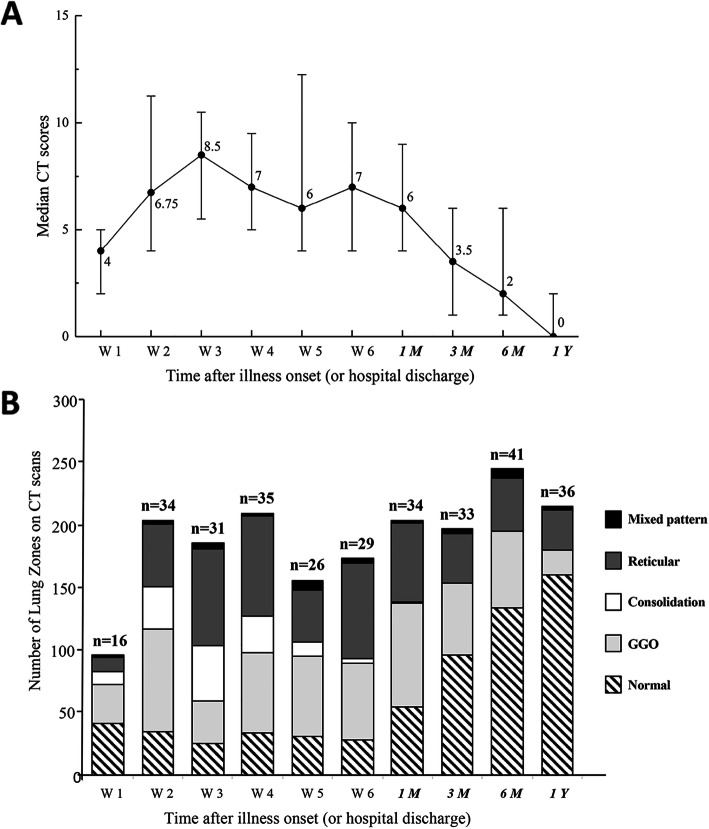
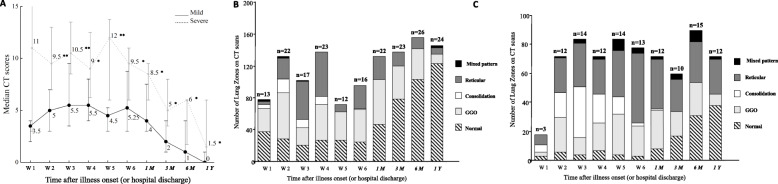
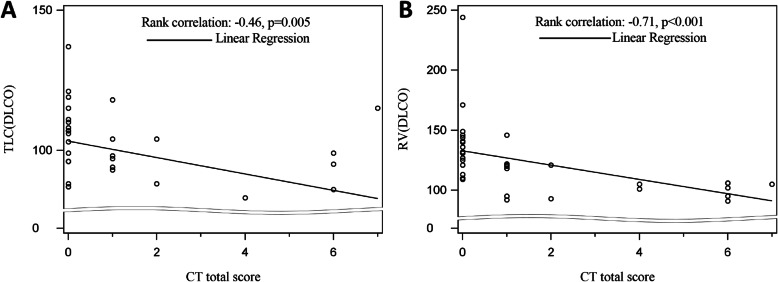
Results: A total of 41 patients were followed in this study. Gradual recovery after hospital discharge was confirmed by the serial CT scores. Around 47% of the patients showed residual aberration on pulmonary CT with a median CT score of 0 (interquartile range (IQR) of 0-2) at 1 year after discharge, with ground-glass opacity (GGO) with reticular pattern as the major radiologic pattern. Patients with residual radiological abnormalities were older (p = 0.01), with higher rate in current smokers (p = 0.04), higher rate in hypertensives (p = 0.05), lower SaO2 (p = 0.004), and higher prevalence of secondary bacterial infections during acute phase (p = 0.02). Multiple logistic regression analyses indicated that age was a risk factor associated with residual radiological abnormalities (OR 1.08, 95% CI 1.01-1.15, p = 0.02). Pulmonary functions of total lung capacity (p = 0.008) and residual volume (p < 0.001) were reduced in patients with residual CT abnormalities and were negatively correlated with CT scores.

Conclusion: During 1-year follow-up after discharge, COVID-19 survivors showed continuous improvement on chest CT. However, residual lesions could still be observed and correlated with lung volume parameters. The risk of developing residual CT opacities increases with age.

Keywords: Convalescence; Lung function; Pulmonary radiography; Risk factors; SARS-CoV-2; Yanfei Chen, Cheng Ding, and Ling Yu contributed equally to the manuscript..


Conflict of interest statement

The authors declare that they have no competing interests.

Figures

Fig. 1
Fig. 1
Scheme demonstrating the enrollment of COVID-19 participants and follow-up schedule
Fig. 2
Fig. 2
A Line graph demonstrating the median CT scores at various time points in weeks after symptoms onset. B Stacked-bar graph showing the distribution of different patterns of lung changes on CT scans at various time points from the onset of symptoms. Black color indicates bronchiectasis, dark gray indicates reticular pattern, white indicates consolidation, light gray indicates ground-glass opacities, and striped indicates normal. The time points in italics indicate the time after hospital discharge (1M, 3M, 6M, and 1Y indicated 1 month, 3 months, 6 months, and 1 year after hospital discharge, respectively). The number of patients at each sampling point was listed on the top of the bar
Fig. 3
Fig. 3
Transverse CT scans of a 72-year-old man with severe COVID-19. He was presented with fever and cough on January 29, 2020, confirmed with SARS-CoV-2 infection on February 1, then admitted to the hospital on the same day, and was treated with corticosteroid and high flow nasal cannula during hospitalization. A Scan obtained on day 7 showing diffuse subpleural GGO. B Scan obtained on day 14 showing subpleural GGO with partial consolidation. C Scan obtained on day 21 of illness showing subpleural GGO, and consolidation partly absorbed. D Scan obtained on day 28 of illness showing irregular linear opacities that developed in the areas of GGO. E Scan obtained on 1 month after discharge (day 62 of illness) demonstrating irregular linear opacities and subpleural reticulation. F Scan obtained on 3 months after discharge (day 112 of illness) showing subpleural reticulation. G Scan obtained at 6 months after discharge (day 210 of illness) showing slight irregular linear opacities and reticulation on the basis of GGO. H Scan obtained at 1 year after discharge (day 390 of illness) showing subtle irregular linear opacities and reticulation on the basis of GGO
Fig. 4
Fig. 4
A Line graph demonstrating the median CT scores of mild and severe patients at various time points after onset of symptoms. Solid line mild patients; dotted line severe patients. B Stacked-bar graph showing the distribution of different patterns of lung changes in mild patients on CT scans at various time points. C Stacked-bar graph showing the distribution of different patterns of lung changes in severe patients on CT scans at various time points. Black color indicates bronchiectasis, dark gray indicates reticular pattern, white indicates consolidation, light gray indicates the ground-glass opacities, and striped indicates normal. The time points in italics were time after hospital discharge (1m, 3m, and 6m indicated 1 month, 3 months, and 6 months after hospital discharge, respectively). The number of patients at each sampling point was listed on the top of the bar
Fig. 5
Fig. 5
A Scatter-plot showing significant correlation between CT score and total lung capacity (TLC) at 1 year after hospital discharge. B Scatter-plot showing significant correlation between CT score and residual volume (RV) at 1 year after hospital discharge

References

    1. WHO Coronavirus Disease (COVID-19) Dashboard. https://covid19.who.int. Accessed 1 Nov 2020.
    1. Hui DS, Joynt GM, Wong KT, Gomersall CD, Li TS, Antonio G, Ko FW, Chan MC, Chan DP, Tong MW, Rainer TH, Ahuja AT, Cockram CS, Sung JJ. Impact of severe acute respiratory syndrome (SARS) on pulmonary function, functional capacity and quality of life in a cohort of survivors. Thorax. 2005;60(5):401–409. doi: 10.1136/thx.2004.030205. - DOI - PMC - PubMed
    1. Hui DS, Wong KT, Ko FW, Tam LS, Chan DP, Woo J, Sung JJY. The 1-year impact of severe acute respiratory syndrome on pulmonary function, exercise capacity, and quality of life in a cohort of survivors. Chest. 2005;128(4):2247–2261. doi: 10.1378/chest.128.4.2247. - DOI - PMC - PubMed
    1. Ngai JC, Ko FW, Ng SS, To K-W. Tong M, Hui DS. The long-term impact of severe acute respiratory syndrome on pulmonary function, exercise capacity and health status. Respirology. 2010;15(3):543–550. doi: 10.1111/j.1440-1843.2010.01720.x. - DOI - PMC - PubMed
    1. Park WB, Jun KI, Kim G, Choi J-P, Rhee J-Y, Cheon S, Lee CH, Park JS, Kim Y, Joh JS, Chin BS, Choe PG, Bang JH, Park SW, Kim NJ, Lim DG, Kim YS, Oh MD, Shin HS. Correlation between pneumonia severity and pulmonary complications in Middle East respiratory syndrome. J Korean Med Sci. 2018;33(24):e169. doi: 10.3346/jkms.2018.33.e169. - DOI - PMC - PubMed

Publication types