. 2021;83(2):833-852.
doi: 10.3233/JAD-215008.

A Super-Resolved View of the Alzheimer's Disease-Related Amyloidogenic Pathway in Hippocampal Neurons

Affiliations

A Super-Resolved View of the Alzheimer's Disease-Related Amyloidogenic Pathway in Hippocampal Neurons

Yang Yu et al. J Alzheimers Dis. 2021.

Abstract

Background: Processing of the amyloid-β protein precursor (AβPP) is neurophysiologically important due to the resulting fragments that regulate synapse biology, as well as potentially harmful due to generation of the 42 amino acid long amyloid β-peptide (Aβ42), which is a key player in Alzheimer's disease.

Objective: Our aim was to clarify the subcellular locations of the fragments involved in the amyloidogenic pathway in primary neurons with a focus on Aβ42 and its immediate substrate AβPP C-terminal fragment (APP-CTF). To overcome the difficulties of resolving these compartments due to their small size, we used super-resolution microscopy.

Methods: Mouse primary hippocampal neurons were immunolabelled and imaged by stimulated emission depletion (STED) microscopy, including three-dimensional three-channel imaging, and quantitative image analyses.

Results: The first (β-secretase) and second (γ-secretase) cleavages of AβPP were localized to functionally and distally distinct compartments. The β-secretase cleavage was observed in early endosomes in soma, where we were able to show that the liberated N- and C-terminal fragments were sorted into distinct vesicles budding from the early endosomes. Lack of colocalization of Aβ42 and APP-CTF in soma suggested that γ-secretase cleavage occurs in neurites. Indeed, APP-CTF was, in line with Aβ42 in our previous study, enriched in the presynapse but absent from the postsynapse. In contrast, full-length AβPP was not detected in either the pre- or the postsynaptic side of the synapse. Furthermore, we observed that endogenously produced and endocytosed Aβ42 were localized in different compartments.

Conclusion: These findings provide critical super-resolved insight into amyloidogenic AβPP processing in primary neurons.

Keywords: Alzheimer’s disease; Aβ42; amyloid-β protein precursor; stimulated emission depletion microscopy; synapse.


Conflict of interest statement

Authors’ disclosures available online (https://www.j-alz.com/manuscript-disclosures/21-5008).

Figures

Fig. 1
Fig. 1
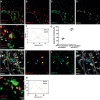
STED images of APP-CT in clathrin-coated pits and clathrin-coated vesicles in soma and neurites. Immunolabeling and 2-channel STED imaging was used to visualize the subcellular localization of APP-CT and clathrin in hippocampal neurons. A third, confocal, channel was used to image the actin cytoskeleton (phalloidin staining). Scale bar for all pictures: 500 nm. A-D) APP-CT (red) and clathrin (green) in soma. The border of the cell is marked in white. Images show, from left to right, A) both channels, B) APP-CT, and C) clathrin, respectively. D) The areas with colocalization of APP-CT and clathrin in (A) is shown in yellow. E) Zoomed-in image of the region marked with a yellow square in (A). Small vesicles with APP-CT staining partially colocalized with clathrin are marked with white arrows, while APP-CT enclosed by a coat of clathrin in a half-spherical shape is marked with a yellow line. F) Plot intensity analysis of the signal along the yellow line in (E). G) Percentage of total APP-CT staining in soma that colocalized with clathrin and of total clathrin staining in soma that colocalized with APP-CT. Data were quantified from 3 samples, cultured from different batches of mice embryos. All error bars represent mean±sd. Analysis was done by “particle analyze” in ImageJ. Threshould “Moments” was applied for the Aβ42 channel. Threshould “Triangle” was applied for the clathrin channel. H-J) APP-CT (red) and clathrin (green) in neurites, combined with actin staining in white to show the outline of the neurites (the latter imaged by confocal microscopy). Images show, from left to right, H) all channels, I) APP-CT, and J) clathrin. Some spots of colocalization for APP-CT and clathrin are marked with blue arrows, while structures containing clathrin but not APP-CT are marked with yellow arrows. K) Colocalization of APP-CT and clathrin are shown in yellow. L) Zoomed-in image of the structure marked by the yellow square in (H). The brightness was increased by ImageJ in order to see the weak signal. M) Plot intensity analysis of the signal along the yellow line in (L).
Fig. 2
Fig. 2
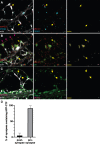
STED images of APP fragments in early endosomes. Immunolabeling and 2- or 3-channel STED microscopy was used to visualize the subcellular localization of APP-CT and/or APP-NT and the early endosome marker EEA1 in hippocampal neurons. 2-channel STED imaging was combined with a third confocal channel to image the actin cytoskeleton (phalloidin staining). Scale bar for all pictures: 500 nm. A) 3-channel STED images of APP-CT (red), APP-NT (cyan) and EEA1 (green) in soma. B) Zoomed-in field and separate channels. Yellow arrows point at vesicles containing APP-CT but not APP-NT. Magenta arrows point at vesicles containing APP-NT but not APP-CT. Blue arrows point at vesicles containing both APP-CT and APP-NT. C) 3-channel STED images of zoomed-in early endosomes visualizing EEA1 (green), APP-CT (red) and APP-NT (cyan) showed in merged and separate channels. D) Quantification of APP-CT and/or APP-NT in EEA1-positive early endosomes (n = 70). E) Quantification of the size (diameter) of EEA1-positive vesicles. Data were quantified from 5 different batches of hippocampal neurons. All error bars represent mean±sd. F) Quantification of the intensity of EEA1 and APP-CT staining in soma (n = 70). G) 2-channel STED images of APP-CT (red) and EEA1 (green) in neurites overlayed with actin shown in a confocal channel. Images show, from left to right, all channels, APP-CT and EEA1, colocalization of APP-CT and EEA1. Lack of colocalization in two synaptic regions are marked by yellow circles. The yellow arrow points out the large EEA1-containing vesicle.
Fig. 3
Fig. 3
3D STED images of APP fragments in early endosomes in soma. Immunolabeling and 3D 3-channel STED microscopy was used to visualize AβPP and AβPP fragments in early endosomes in hippocampal neurons. Scale bars for A, C and E: 500 nm; scale bars for B, D and F: 100 nm. A, B) APP-CT and EEA1. C, D) APP-CT and APP-NT. E, F) APP-NT and EEA1. Using Huygens analysis software, a filter that can remove all non-overlapping vesicles was applied to show only the early endosomes that contain AβPP or AβPP fragments in A, C, and, E. Zoomed-in images of the regions marked by a yellow square in the left panel of A, C, and, E are shown in the middle panel and the selected vesicles marked by a yellow square in the middle panel are shown from two directions (xy, xz) in the right panel (B, D, and F). APP-CT budding from the early endosomes are marked by white arrows. APP-NT in the same early endosomes are marked by magenta arrows. All analyses were based on 3D data, which means that voxel-based practical colocalization analysis was applied. G) Schematic picture showing the sorting of AβPP fragments in early endosome.
Fig. 4
Fig. 4
STED images of APP-CTF and synaptic markers in neurites. Immunolabeling and 2-channel STED imaging was used to visualize APP-CTF and synaptic markers in neurites of hippocampal neurons. A third, confocal, channel was used to image the actin cytoskeleton (phalloidin staining). Scale bar for all pictures: 500 nm. A) APP-CT (red), PSD95 (cyan) and actin in a confocal channel (white). Synapses showing PSD95 at the postsynaptic spines and APP-CT at the presynaptic side are marked with yellow arrows. Images show, from left to right, all channels, APP-CT and PSD95 and colocalization of APP-CT and PSD95, respectively. The absence of yellow color indicates no colocalization. B) APP-CTF (red), synaptophysin (syn; green) and actin in a confocal channel (white). Synapses showing synaptophysin and APP-CT at the presynaptic side close to postsynaptic spines are shown by yellow arrows. Magenta arrows mark the staining of APP-CT in the “free” axon. Images show, from left to right, all channels, APP-CT and synaptophysin, colocalization of APP-CT and synaptophysin. C) APP-NT (magenta), VAMP2 (green) and actin in a confocal channel (white). The presynaptic side of two synapses is marked by yellow arrows. Images show, from left to right, all channels, APP-NT and VAMP2 and colocalization of APP-NT and VAMP2. D) Quantification of APP-CT in pre- or post-synaptic side. Data were quantified from 3 different batches of hippocampal neurons, 20 synapses for each. All error bars represent mean±sd.
Fig. 5
Fig. 5
STED images of Aβ42 and subcellular markers in soma. A) 3-color STED image of Aβ42 (red), EEA1 (green), and Rab9 (cyan). (B-G) 2-channel STED imaging combined with actin staining (white) in a confocal channel. The zoomed-in pictures are shown to the right. B) Aβ42 (red) and Rab7 (green). C) Aβ42 (red) and LC3A (green). D) Aβ42 (red) and Rab26 (green). E) Aβ42 (red) and flotillin-1 (FLOT1, green). Yellow arrows point at areas rich in flotillin-1 containing vesicles. F) Aβ42 (red) and clathrin (green). The white line marks the edge of soma. G) Colocalization between Aβ42 and clathrin is shown in yellow. Scale bars for all pictures: 500 nm. H) Quantification of Aβ42-containing vesicles in soma (n = 20 for each subcellular marker). Data were quantified from 3 different preparations of hippocampal neurons for each subcellular marker. All error bars represent mean±sd. Analysis was done by “particle analyze” in ImageJ. Threshold “Moments” was applied for the Aβ42 channel. Threshold “Triangle” was applied for subcellular markers channel. I) Quantification of the size (diameter) of vesicles containing Aβ42 at the rim in soma. Data were quantified from 3 different batches of hippocampal neurons. Vesicles containing Aβ42 at the rim were selected manually and 41 vesicles were quantified in total.
Fig. 6
Fig. 6
Airyscan images of Aβ42 and live cell labeled endosomes/lysosomes in soma. Cells were treated with live endosomal/cell markers, fixed, immuno-stained for Aβ42 and imaged by confocal microscopy with an Airyscan detector. A) Aβ42 (red) and SiR-lysosome (green). Scale bars: 2μm. B) Aβ42 (red), late endosome-GFP (LE-GFP) (green), early endosome-RFP (EE-RFP) (cyan). Colocalization is marked by yellow arrows. Scale bars: 500 nm.
Fig. 7
Fig. 7
STED images of Aβ42 and subcellular markers in neurites. 2-channel STED imaging combined with actin staining (white) in a confocal channel. The colocalization between Aβ42 and subcellular markers is shown to the right in yellow. A) Aβ42 (red) and clathrin (green). B, C) Aβ42 (red) and EEA1 (green). D) Staining of Aβ42 (red) and Rab9 (green). E) Aβ42 (red) and Rab7 (green). F) Aβ42 (red) and Rab26 (green). Scale bars for all pictures: 500 nm. G) Distribution of Aβ42 staining in neurites. Data were quantified from 3 different batches of hippocampal neurons for each subcellular marker. All error bars represent mean±sd. Analysis was done by “particle analyze” in ImageJ. Threshold “Moments” was applied for the Aβ42 channel. Threshold “Triangle” was applied for the subcellular markers channel.
Fig. 8
Fig. 8
Scheme of subcellular localization of full-length AβPP, CTFs, and/or Aβ42 in hippocampal neurons. The subcellular localization of full-length AβPP (FL-APP), APP-C-terminal fragments (APP-CTF), and Aβ42 in the endocytic-lysosomal system, based on STED imaging of hippocampal neurons, is shown. Early endosome antigen 1 (EEA1); clathrin coated vesicle (CCV); Early endosome (EE); Multi-vesicular body (MVB); Late endosome (LE); Autophagosome (AP); Synaptic vesicle (SV).

Similar articles

Cited by

References

    1. Söderberg L, Bogdanovic N, Axelsson B, Winblad B, Naslund J, Tjernberg LO (2006) Analysis of single Alzheimer solid plaque cores by laser capture microscopy and nanoelectrospray/tandem mass spectrometry. Biochemistry 45, 9849–9856. - PubMed
    1. Muller UC, Deller T, Korte M (2017) Not just amyloid: Physiological functions of the amyloid precursor protein family. Nat Rev Neurosci 18, 281–298. - PubMed
    1. Andrew RJ, Kellett KA, Thinakaran G, Hooper NM (2016) A Greek tragedy: The growing complexity of Alzheimer amyloid precursor protein proteolysis. J Biol Chem 291, 19235–19244. - PMC - PubMed
    1. Steiner H, Fluhrer R, Haass C (2008) Intramembrane proteolysis by gamma-secretase. J Biol Chem 283, 29627–29631. - PMC - PubMed
    1. Jan A, Hartley DM, Lashuel HA (2010) Preparation and characterization of toxic Abeta aggregates for structural and functional studies in Alzheimer’s disease research. Nat Protoc 5, 1186–1209. - PubMed

Publication types

Substances