. 2020 Jul 2;30(27):2002299.
doi: 10.1002/adfm.202002299. Epub 2020 May 4.

A Combination of Cowpea Mosaic Virus and Immune Checkpoint Therapy Synergistically Improves Therapeutic Efficacy in Three Tumor Models

Affiliations

A Combination of Cowpea Mosaic Virus and Immune Checkpoint Therapy Synergistically Improves Therapeutic Efficacy in Three Tumor Models

Chao Wang et al. Adv Funct Mater. .

Abstract

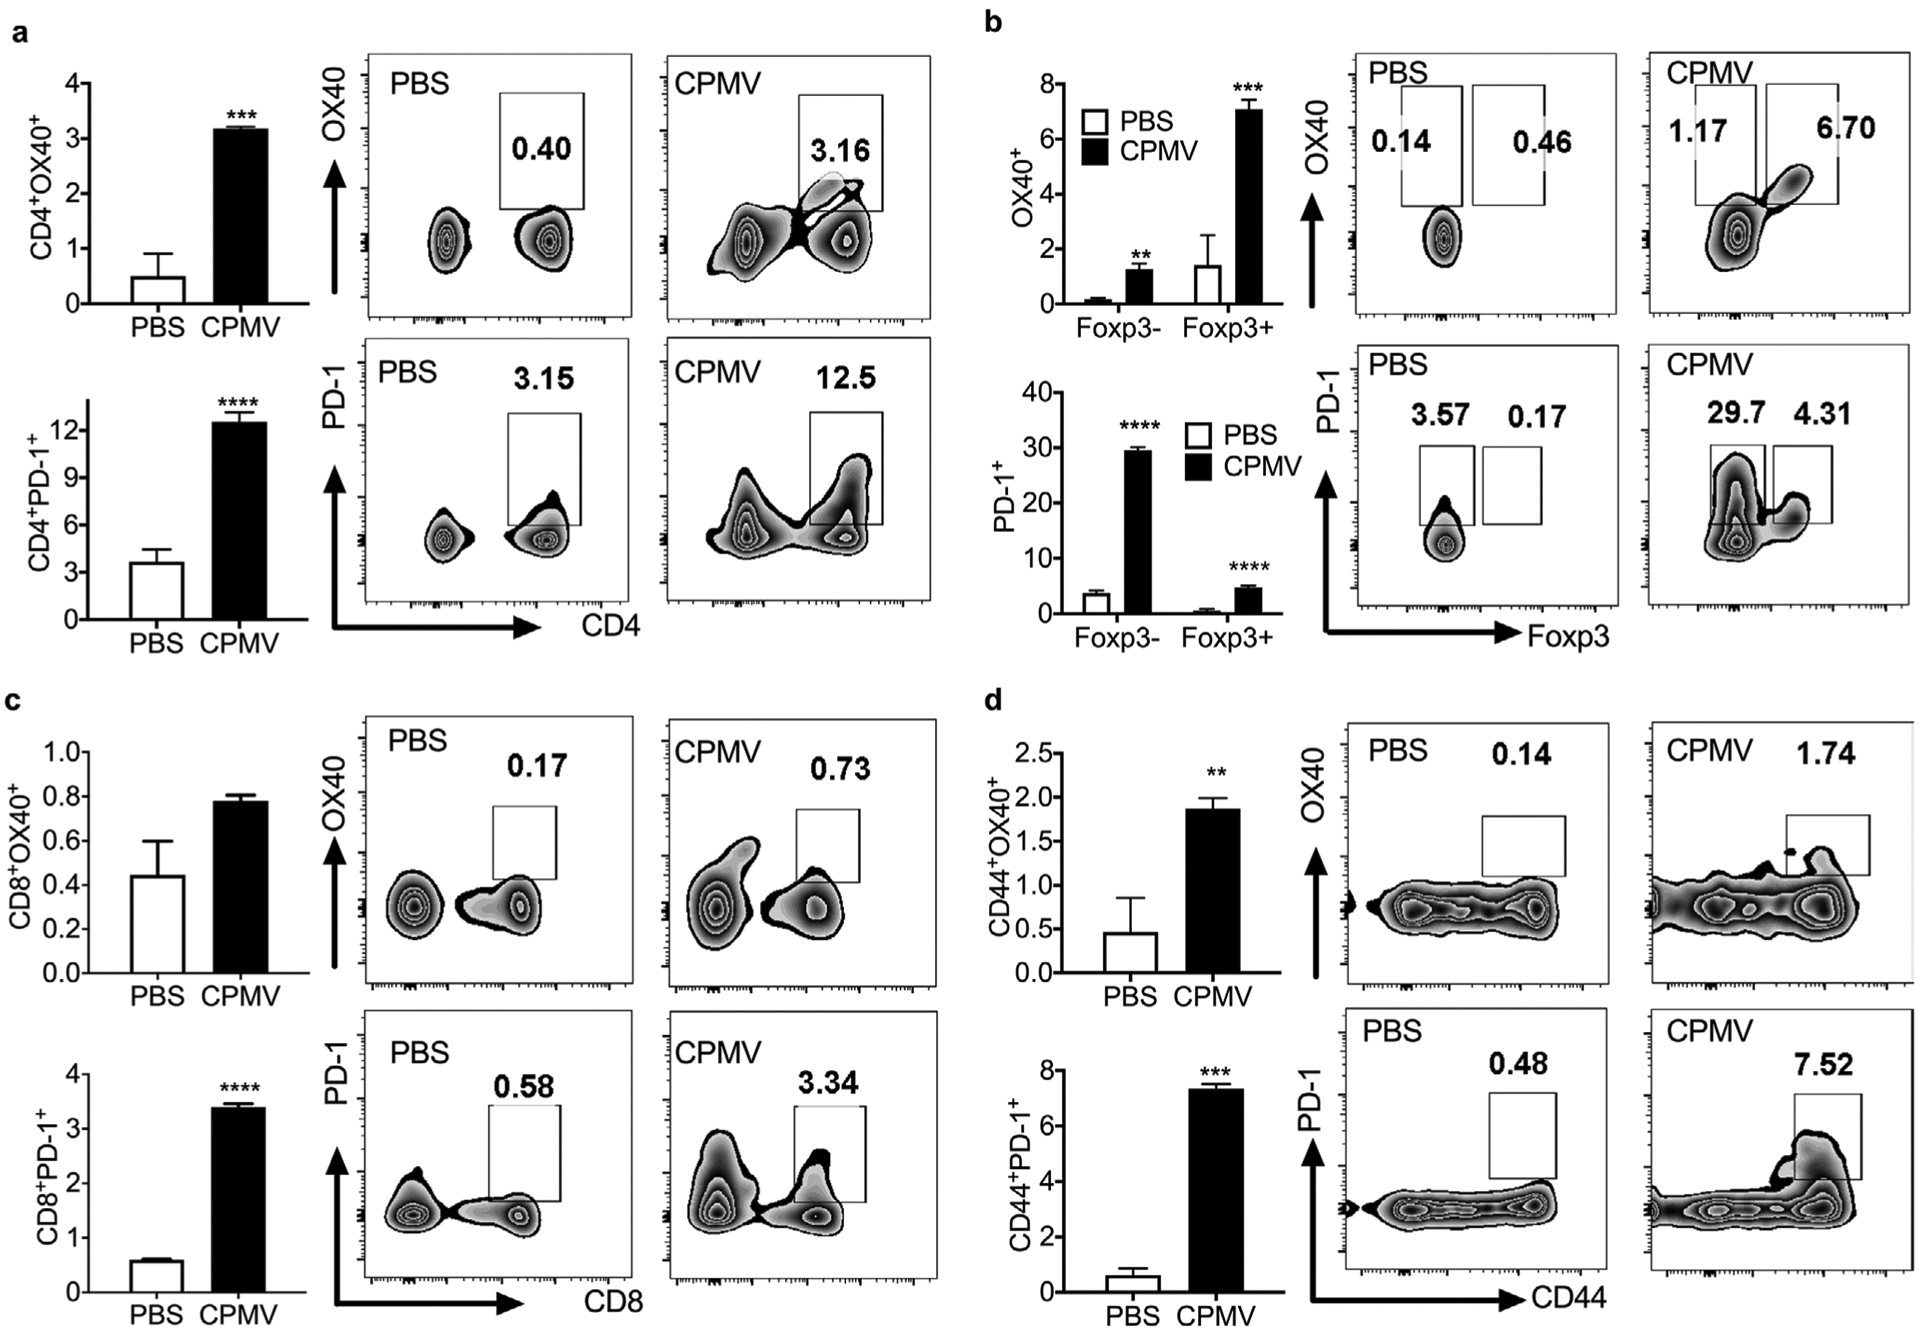
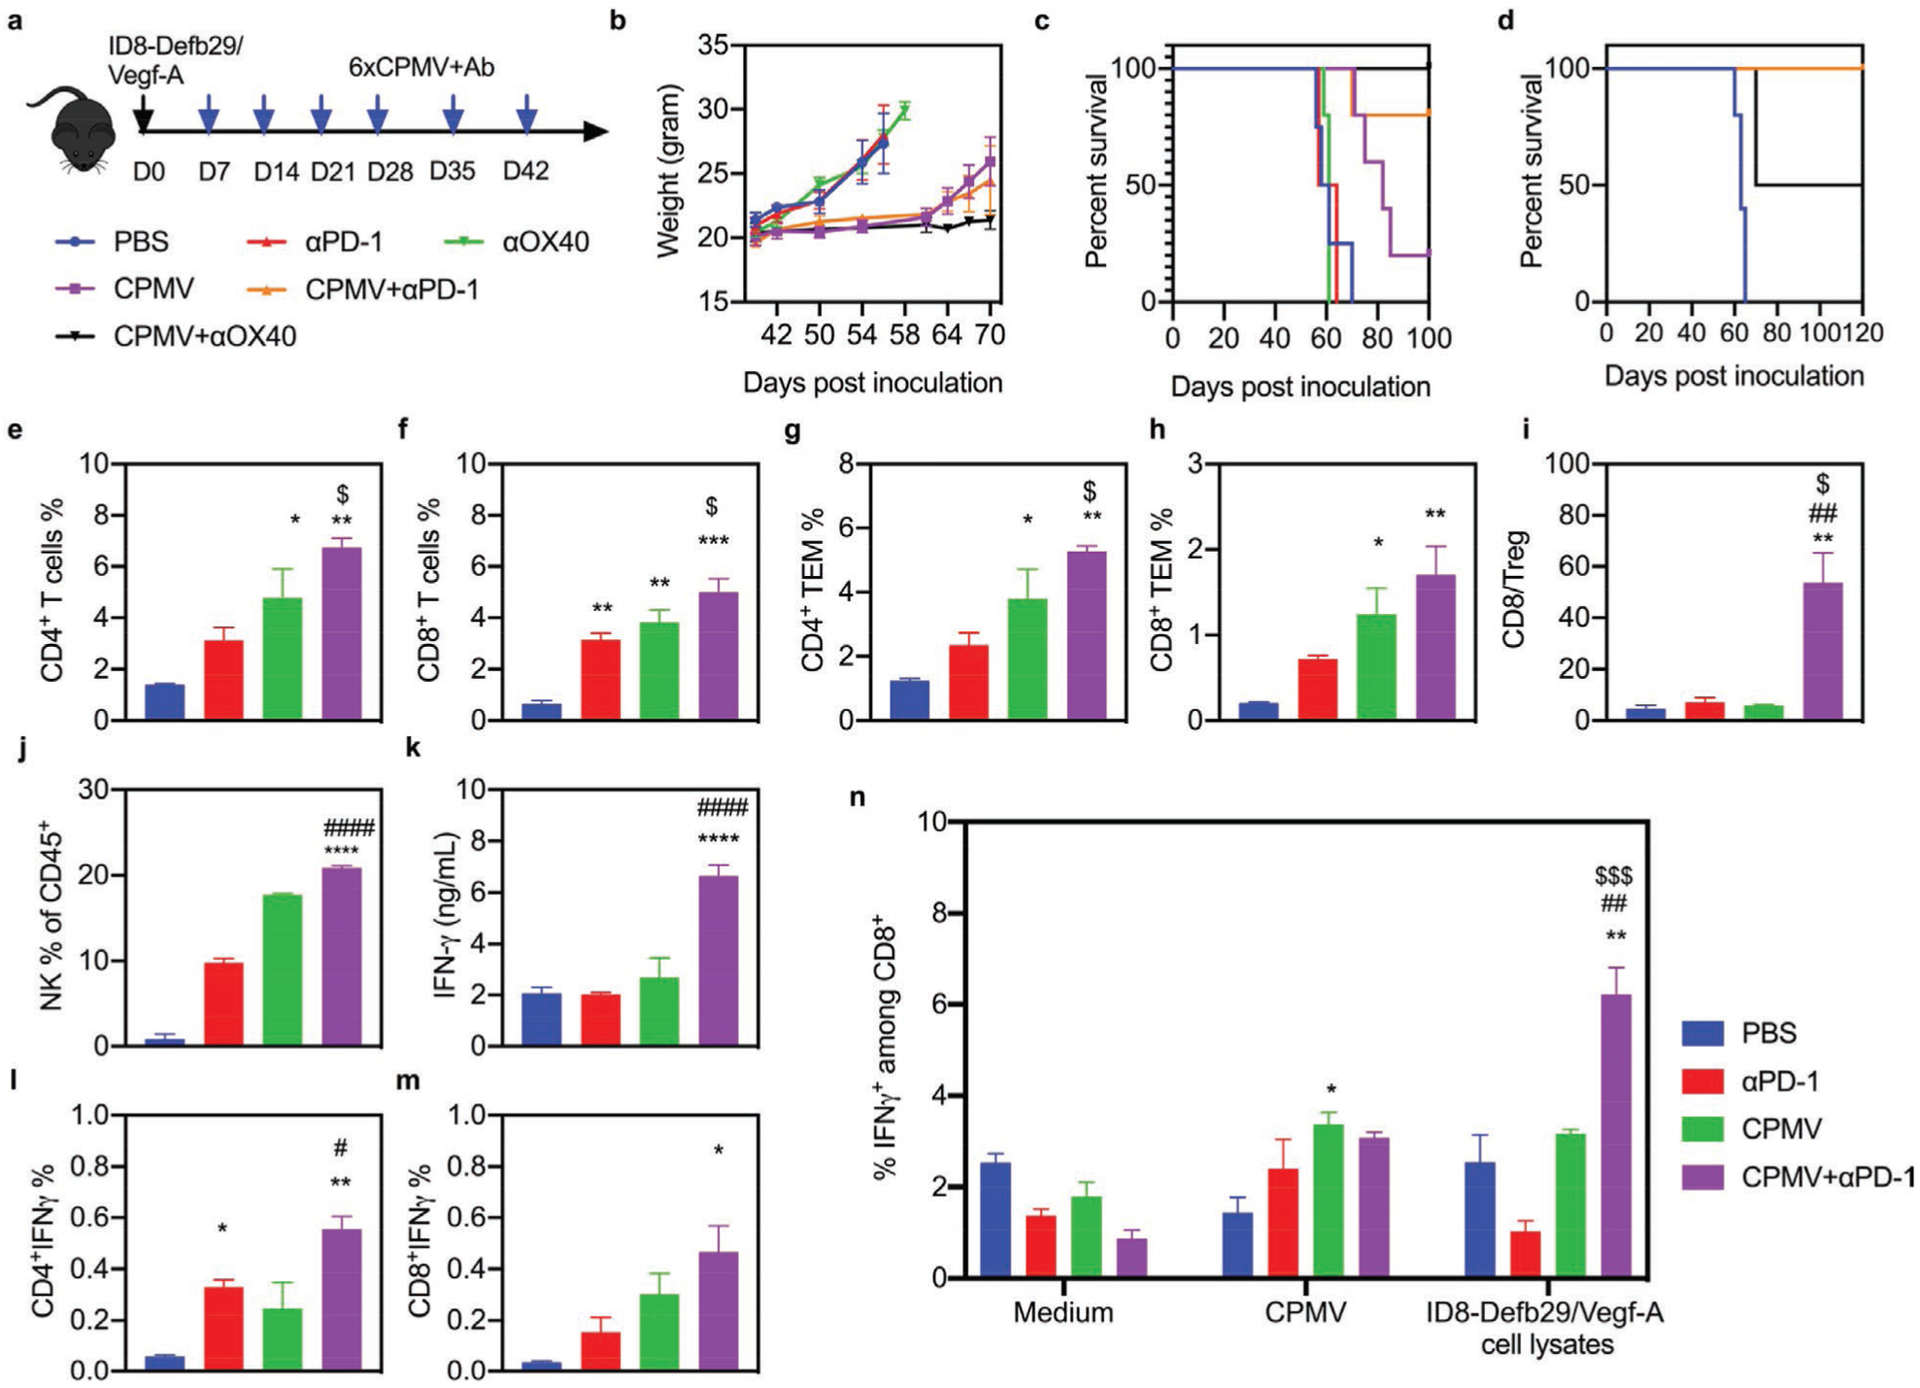
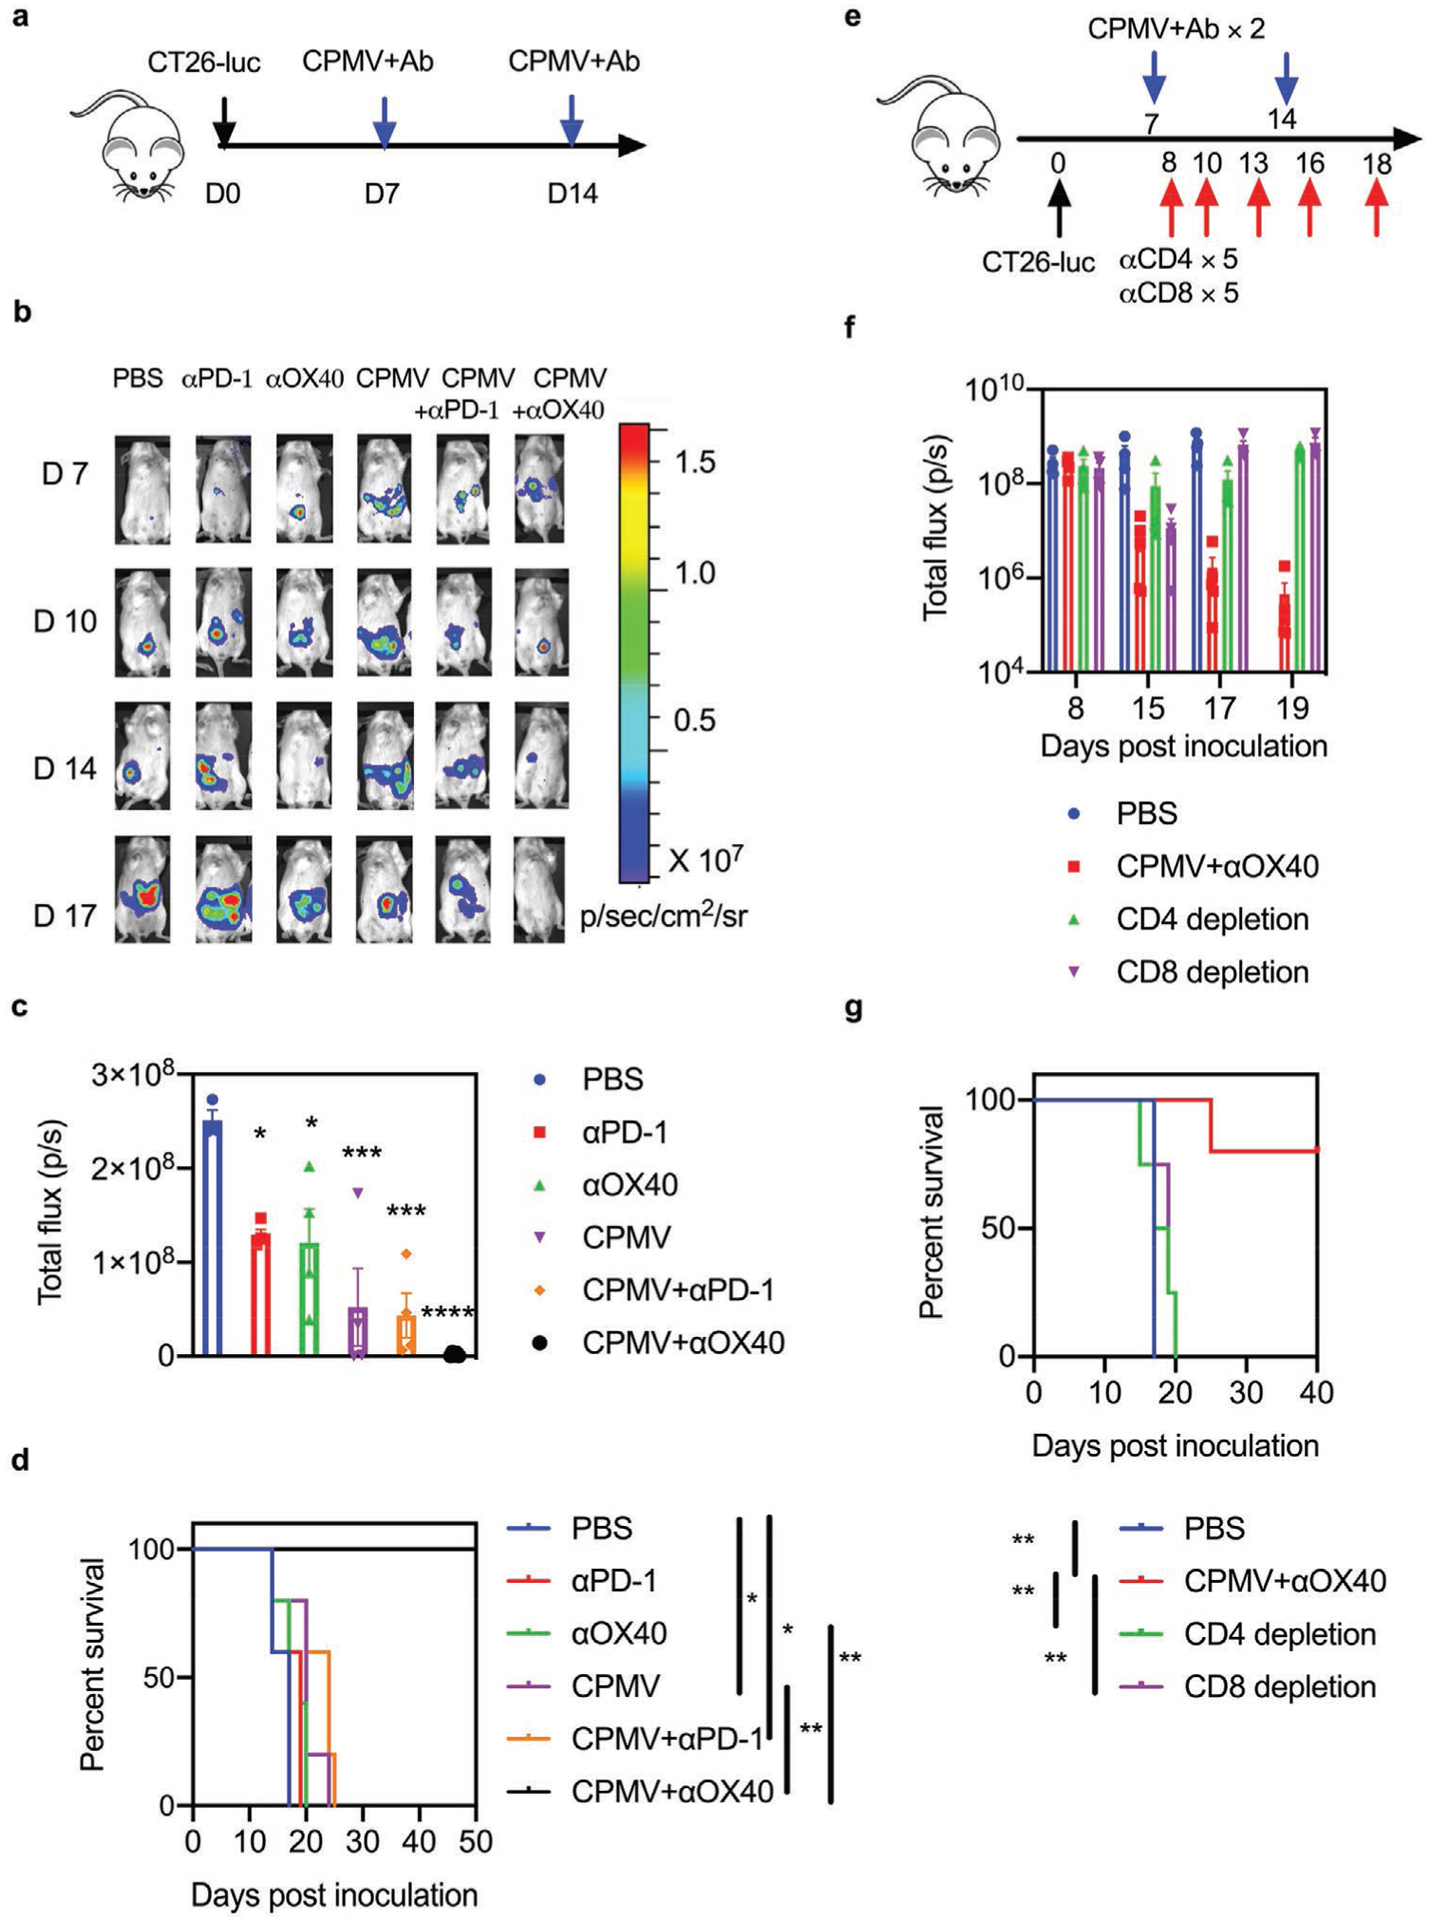
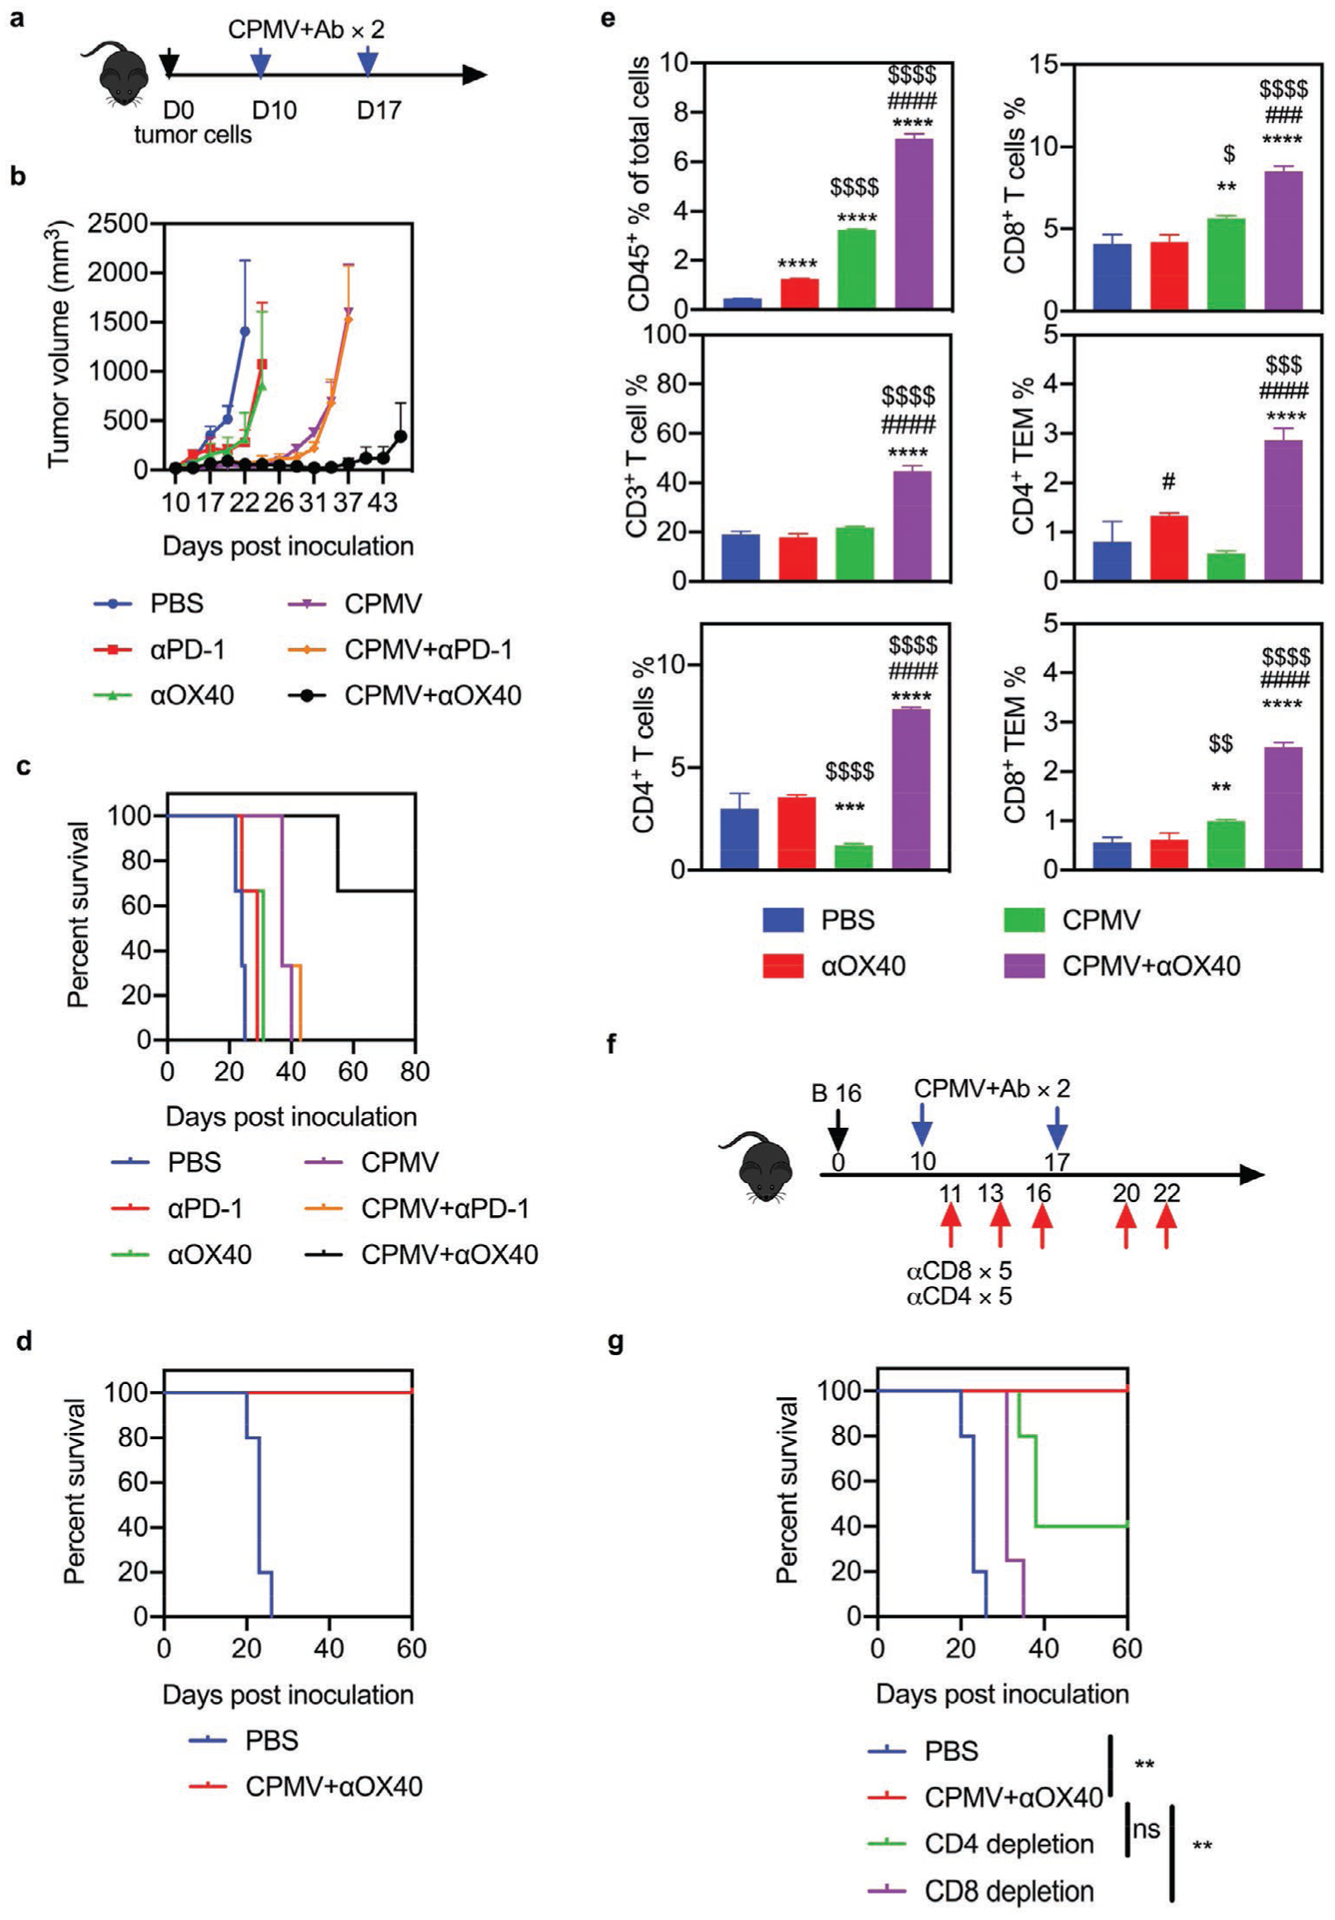
Immune checkpoint therapy (ICT) has the potential to treat cancer by removing the immunosuppressive brakes on T cell activity. However, ICT benefits only a subset of patients because most tumors are "cold", with limited pre-infiltration of effector T cells, poor immunogenicity, and low-level expression of checkpoint regulators. It has been previously reported that Cowpea mosaic virus (CPMV) promotes the activation of multiple innate immune cells and the secretion of pro-inflammatory cytokines to induce T cell cytotoxicity, suggesting that immunostimulatory CPMV could potentiate ICT. Here it is shown that in situ vaccination with CPMV increases the expression of checkpoint regulators on Foxp3-CD4+ effector T cells in the tumor microenvironment. It is shown that combined treatment with CPMV and selected checkpoint-targeting antibodies, specifically anti-PD-1 antibodies, or agonistic OX40-specific antibodies, reduced tumor burden, prolonged survival, and induced tumor antigen-specific immunologic memory to prevent relapse in three immunocompetent syngeneic mouse tumor models. This study therefore reveals new design principles for plant virus nanoparticles as novel immunotherapeutic adjuvants to elicit robust immune responses against cancer.

Keywords: Cowpea mosaic virus; immune checkpoint therapy; immunotherapy.


Conflict of interest statement

Conflict of Interest The authors declare no conflict of interest.

Figures

Figure 1.
Figure 1.
Repetitive administration of CPMV induces the expression of OX40 and PD-1 on CD4+ and CD8+ T cells. C57BL/6 mice were inoculated (i.p.) with 2 × 10⁶ ID8-Defb29/Vegf-A-luc cells followed by five weekly injections (i.p.) of 100 μg CPMV. Cells collected from peritoneal washes carried out 48 h after the last treatment were analyzed by flow cytometry. a) Percentages and representative FACS plots of OX40+CD4+ and PD-1+CD4+ T cells gated on CD3+ T cells. b) Percentages and representative FACS plots showing PD-1 and OX40 expression on Foxp3 effector T cells and Foxp3+ regulatory T cells gated on CD3+CD4+ T cells. c) Percentages and representative FACS plots of OX40+CD8+ and PD-1+CD8+ T cells gated on CD3+ T cells. d) Percentages and representative FACS plots of CD44+OX40+ and CD44+PD-1+ subsets gated on CD3+CD8+ T cells. Data are means ± SEM (n = 3). Statistical significance was calculated using a paired t-test (*p < 0.05, **p < 0.01, ***p < 0.0005, ****p < 0.0001).
Figure 2.
Figure 2.
Combined CPMV and PD-1 inhibitor treatment synergistically enhances immunotherapeutic efficacy in a model of ovarian cancer. a) Schematic of the treatment strategy and dosing regimen. C57BL/6 mice were inoculated (i.p.) with 2 × 10⁶ ID8-Defb29/Vegf-A cells followed by six weekly injections (i.p.) of 50 μg antibody (PD-1 antagonist or OX40 agonist), 100 μg CPMV, the combination, or PBS as a control (n = 5). b) Body weight was measured to monitor tumor growth. c) Survival curves of the treatment groups. d) Survival curves of the combination therapy groups following tumor re-challenge at 100 dpi. e–n) C57BL/6 mice were inoculated (i.p.) with 2 × 10⁶ ID8-Defb29/Vegf-A-luc cells followed by two i.p. doses (21 and 28 dpi) of the PD-1 inhibitor antibody (100 μg), CPMV (100 μg), or the combination, and spleens and peritoneal wash/ascites were collected 2 days after the second dose. e–j) Percentages of CD4+ and CD8+ infiltrated T cells (and their subsets) and NK cells among CD45+ cells determined by flow cytometry. k) IFNγ levels in the supernatant of peritoneal wash/ascites. l–m) Percentages of total CD4+ and CD8+ infiltrated T cells staining positive for IFNγ. n) Splenocytes were cultured in fresh medium, CPMV suspensions, or ID8-Defb29/Vegf-A cell lysates for 24 h. Percentage of intracellular IFNγ was measured in CD8+ T cells by flow cytometry. Data are means ± SEM (n = 3). Statistical significance was calculated by one-way ANOVA: * versus PBS; # versus CPMV monotherapy; $ versus antibody monotherapy (*p < 0.05; **p < 0.01; ***p < 0.0005; ****p < 0.0001).
Figure 3.
Figure 3.
Combined CPMV and OX40 agonist treatment induces systemic antitumor effects in a CT26 colon tumor model. a) Schematic of the treatment strategy and dosing regimen. BALB/c mice were inoculated (i.p.) with 5 × 10⁵ CT26-luc cells followed by two weekly injections (i.p.) of 50 μg antibody (PD-1 antagonist or OX40 agonist), 50 μg CPMV, the combination, or PBS as a control (n = 5). b) IVIS images showing the growth of luc+ CT26 tumors in the different treatment groups. c) The average luciferase expression of tumor cells 17 dpi in the different treatment groups. Data are means ± SEM (n = 3–5). Statistical significance was calculated by one-way ANOVA: * versus PBS; *p < 0.05; ***p < 0.0005; ****p < 0.0001. d) Survival curves of the treatment groups. Statistical significance was calculated using a log-rank Mantel-Cox test: *p < 0.05, **p < 0.01. e) Schematic of the T cell depletion strategy using a CT26-luc colon tumor model. f) The average luciferase expression of tumor cells from different treatment groups in the T cell depletion study: PBS (blue), CPMV+OX40 agonist (red), CD4-specific antibody (100 μg, green), CD8-specific antibody (100 μg, purple). Data are means ± SEM (n = 4–5). g) Survival rate of each treatment group in the T cell depletion study. Statistical significance was calculated using a log-rank Mantel-Cox test: **p < 0.01.
Figure 4.
Figure 4.
Combined CPMV and OX40 agonist treatment induces systemic antitumor effects in a B16F10 dermal melanoma model. a) Schematic of treatment strategy and dosing regimen. C57BL/6 mice were inoculated intradermally (i.d.) with 2.5 × 10⁵ B16F10 cells on the right flank and followed by two doses (directly into the resulting tumor) of 100 μg antibody (PD-1 antagonist or OX40 agonist), 100 μg CPMV, the combination, or PBS as a control. b) Average tumor growth curve of mice receiving PBS (blue), PD-1 inhibitor (100 μg, red), OX40 agonist (100 μg, green), CPMV (100 μg, purple), CPMV+PD-1 inhibitor (orange), or CPMV+OX40 agonist (black). Data are means ± SEM (n = 3). c) Survival rate of each treatment group. d) Survival curves of combination therapy groups following tumor re-challenge. Data are means ± SEM (n = 5 for control, n = 2 for CPMV+OX40 agonist). e) Percentage of CD45+ leukocytes among total cells, the percentages of CD3+, CD4+, and CD8+ T cells among CD45+ cells, and the percentage of CD44+CD62L effector memory T cells among CD45+ cells. Data are means ± SEM (n = 3). Statistical significance was calculated by one-way ANOVA: * versus PBS; # versus CPMV; $ versus ICT (*p < 0.05; **p < 0.01; ***p < 0.0005; ****p < 0.0001). f) Schematic of the T cell depletion strategy using a B16 dermal melanoma tumor model. g) Survival rate of each treatment group in the T cell depletion study. Data are means ± SEM (n = 4–5). Statistical significance was calculated using a log-rank Mantel–Cox test. **p < 0.01. ns: no significant difference.

References

    1. Topalian SL, Hodi FS, Brahmer JR, Gettinger SN, Smith DC, McDermott DF, Powderly JD, Carvajal RD, Sosman JA, Atkins MB, Leming PD, Spigel DR, Antonia SJ, Horn L, Drake CG, Pardoll DM, Chen L, Sharfman WH, Anders RA, Taube JM, McMiller TL, Xu H, Korman AJ, Jure-Kunkel M, Agrawal S, McDonald D, Kollia GD, Gupta A, Wigginton JM, Sznol M, Engl N. J. Med 2012, 366, 2443. - PMC - PubMed
    1. Topalian SL, Sznol M, McDermott DF, Kluger HM, Carvajal RD, Sharfman WH, Brahmer JR, Lawrence DP, Atkins MB, Powderly JD, Leming PD, Lipson EJ, Puzanov I, Smith DC, Taube JM, Wigginton JM, Kollia GD, Gupta A, Pardoll DM, Sosman JA, Hodi FS, J. Clin. Oncol 2014, 32, 1020. - PMC - PubMed
    1. McDermott DF, Drake CG, Sznol M, Choueiri TK, Powderly JD, Smith DC, Brahmer JR, Carvajal RD, Hammers HJ, Puzanov I, Hodi FS, Kluger HM, Topalian SL, Pardoll DM, Wigginton JM, Kollia GD, Gupta A, McDonald D, Sankar V, Sosman JA, Atkins MB, J. Clin. Oncol 2015, 33, 2013. - PMC - PubMed
    1. Tumeh PC, Harview CL, Yearley JH, Shintaku IP, Taylor EJM, Robert L, Chmielowski B, Spasic M, Henry G, Ciobanu V, West AN, Carmona M, Kivork C, Seja E, Cherry G, Gutierrez AJ, Grogan TR, Mateus C, Tomasic G, Glaspy JA, Emerson RO, Robins H, Pierce RH, Elashoff DA, Robert C, Ribas A, Nature 2014, 515, 568. - PMC - PubMed
    1. Champiat S, Ferté C, Lebel-Binay S, Eggermont A, Soria JC, OncoImmunology 2014, 3, e27817. - PMC - PubMed

LinkOut - more resources