. 2021 Jul 23:15:704834.
doi: 10.3389/fnins.2021.704834. eCollection 2021.

Mesoscopic Mapping of Ictal Neurovascular Coupling in Awake Behaving Mice Using Optical Spectroscopy and Genetically Encoded Calcium Indicators

Affiliations

Mesoscopic Mapping of Ictal Neurovascular Coupling in Awake Behaving Mice Using Optical Spectroscopy and Genetically Encoded Calcium Indicators

Fan Yang et al. Front Neurosci. .

Abstract

Unambiguously identifying an epileptic focus with high spatial resolution is a challenge, especially when no anatomic abnormality can be detected. Neurovascular coupling (NVC)-based brain mapping techniques are often applied in the clinic despite a poor understanding of ictal NVC mechanisms, derived primarily from recordings in anesthetized animals with limited spatial sampling of the ictal core. In this study, we used simultaneous wide-field mesoscopic imaging of GCamp6f and intrinsic optical signals (IOS) to record the neuronal and hemodynamic changes during acute ictal events in awake, behaving mice. Similar signals in isoflurane-anesthetized mice were compared to highlight the unique characteristics of the awake condition. In awake animals, seizures were more focal at the onset but more likely to propagate to the contralateral hemisphere. The HbT signal, derived from an increase in cerebral blood volume (CBV), was more intense in awake mice. As a result, the "epileptic dip" in hemoglobin oxygenation became inconsistent and unreliable as a mapping signal. Our data indicate that CBV-based imaging techniques should be more accurate than blood oxygen level dependent (BOLD)-based imaging techniques for seizure mapping in awake behaving animals.

Keywords: awake; ictal event; mesoscopic optical imaging; mice; neurovascular coupling.


Conflict of interest statement

The authors declare that the research was conducted in the absence of any commercial or financial relationships that could be construed as a potential conflict of interest.

Figures
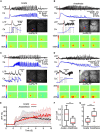
FIGURE 1
FIGURE 1
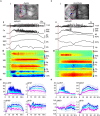
Different initiation patterns of ictal events in awake and isoflurane-anesthetized animals. Calcium imaging of different ictal initiated patterns in four separate animals. (A) awake with a first spike. (B) Anesthetized with a spike. (C) Awake without a first spike. (D) Anesthetized without a first spike. For each panel, the top shows the LFP and calcium traces recorded at the 4-AP injection site. An enlarged view of the initiation section and the field of view are shown in the middle. The vertical red line indicates the onset of the ictal event. The black dashed lines indicate the time points from which the activity maps are shown at the bottom. The red arrow shows the 4-AP injection/LFP recording electrode. The blue dots show the location where the calcium trace is recorded. (E) The average calcium trace was recorded from the 4-AP injection site. The solid line and the shaded area showed the mean ± SD of the averaged calcium trace (n = 17 seizures in eight awake animals; n = 14 seizures in seven anesthetized animals). Note the progressive increase and shorter decay, higher temporal resolution in the calcium signal in awake animals compared with the slow decrement low temporal resolution in the anesthetized animals. (F) Box plot of the correlation coefficient between the LFP and calcium traces in awake (n = 17 seizures in eight awake animals) and anesthetized (n = 14 seizures in seven animals) mice. (G) Box plot of the area of calcium signal involved in the initiation of ictal events in awake (n = 17 seizures in eight animals) compared with anesthetized (n = 14 seizures in seven animals) mice. ***p < 0.001 and **p < 0.01.
FIGURE 2
FIGURE 2
Ipsilateral propagation of calcium and hemodynamic signals in awake and isoflurane-anesthetized mice. (A) Ipsilateral propagation of ictal event in an awake mouse. (A-I) The field of view. The blue arrow indicates the 4-AP/LFP electrode. A blue + indicates a pixel PiOI from within the 4-AP injection site from which the signals are shown in panel (A-II). A red rectangle box shows a linear region of interest (LiROI) from which the calcium and hemodynamic signal are shown in panel (A-III). Three dotted circles indicate three ring-RiOIs from which the averaged calcium signals are shown in panel (B), each corresponding to the different color of the ring. The diameters of each RiROI are 0.7, 1.4, and 2.1 mm, respectively. (A-II) The LFP, calcium, and hemodynamic traces from the PiROI in the 4-AP injection site. (A-III) The calcium and hemodynamic dynamics from the LiROI. (B) The average calcium and hemodynamic traces from three RiOIs. (C) Ipsilateral propagation of ictal events in anesthetized mice. The arrangement of panel (C) is the same as in panel (A). (D) The average calcium and hemodynamic traces from the three RiOIs.
FIGURE 3
FIGURE 3
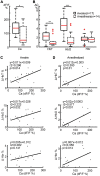
Amplitude correlation between calcium and hemodynamic signals in ipsilateral cortex. (A) Boxplot of maximal calcium amplitude in awake and anesthetized mice. (B) Box plot of maximal hemodynamic amplitude in awake and anesthetized mice. ***p < 0.001, **p < 0.01, and *p < 0.05. (C,D) Linear regression of maximal calcium and hemodynamic amplitude in awake and anesthetized mice, respectively. The regression equations, r2, and p-values are labeled in the plots.
FIGURE 4
FIGURE 4
Contralateral propagation of calcium and hemodynamic signals in awake and isoflurane-anesthetized mice. In awake mice, three different propagation patterns were observed. (A) Calcium and hemodynamic signals remain ipsilateral. (B) Calcium and hemodynamic signals propagate to the contralateral hemisphere by jumping to the contralateral homotopic area. (C) Calcium and hemodynamic signals propagate to the contralateral hemisphere smoothly crossing the midline. (D) In anesthetized mice, the calcium and hemodynamic signals remained predominantly ipsilateral Small hemodynamic signals were recorded contralaterally. For each subpanel, the top left is the field of view. The red arrow shows the 4-AP/LFP electrode and the blue dot shows the POI from the 4-AP injection site. Top right, the LFP, calcium, and hemodynamic traces from the POI. Bottom, the spatiotemporal dynamics of the calcium and hemodynamic signals.
FIGURE 5
FIGURE 5
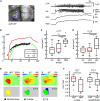
Spatial correlation between calcium and hemodynamic signals in ipsilateral cortex. (A) The field of view and the traces of LFP, calcium, HbT, and HbO traces from the 4-AP injection site. (B) The area of change during the ictal event. Note: The areas of the HbT signal more accurately map the calcium area than the HbO signal. (C) Box plot of a maximal area of calcium, HbT, and HbO signals in awake mice. Note: The HbT and calcium areas are not significantly different. (D) Box plot of maximal calcium, HbT, and Hbr signal in anesthetized mice. Note: The HbT and calcium areas are not significantly different. (E) Example of the spatial overlap between maximal calcium and hemodynamic areas. The top rows show the maximal area of the different signals. The dashed black line indicates the maximal area in the ipsilateral cortex defined with a modified Chen-Bee method. Bottom row: the spatial overlap between maximal calcium and hemodynamic area. The 2D correlation coefficient between calcium and the hemodynamic area is labeled. (F) The boxplot of the correlation coefficient between calcium and hemodynamic areas in awake and anesthetized mice. ***p < 0.001, **p < 0.01, and *p < 0.05.
FIGURE 6
FIGURE 6
Disruption of endothelial reactivity recapitulates the effect of anesthesia. (A) Box plot of hemodynamic amplitude change-induced before and after endothelial disruption with photo-activation of FITC-dx. (B) Box plot of the hemodynamic area before and after endothelial disruption with photo-activation of FITC-dx. ***p < 0.001, **p < 0.01, and *p < 0.05.

References

    1. Ances B. M. (2004). Coupling of changes in cerebral blood flow with neural activity: what must initially dip must come back up. J. Cereb. Blood Flow Metab. 24 1–6. 10.1097/01.wcb.0000103920.96801.12 - DOI - PubMed
    1. Austin V. C., Blamire A. M., Allers K. A., Sharp T., Styles P., Matthews P. M., et al. (2005). Confounding effects of anesthesia on functional activation in rodent brain: a study of halothane and alpha-chloralose anesthesia. Neuroimage 24 92–100. 10.1016/j.neuroimage.2004.08.011 - DOI - PubMed
    1. Bahar S., Suh M., Zhao M., Schwartz T. H. (2006). Intrinsic optical signal imaging of neocortical seizures: the ‘epileptic dip’. Neuroreport 17 499–503. 10.1097/01.wnr.0000209010.78599.f5 - DOI - PubMed
    1. Baumgart J. P., Zhou Z. Y., Hara M., Cook D. C., Hoppa M. B., Ryan T. A. (2015). Isoflurane inhibits synaptic vesicle exocytosis through reduced Ca2+ influx, not Ca2+-exocytosis coupling. Proc. Natl. Acad. Sci. U. S. A. 112 11959–11964. 10.1073/pnas.1500525112 - DOI - PMC - PubMed
    1. Berwick J., Johnston D., Jones M., Martindale J., Martin C., Kennerley A. J., et al. (2008). Fine detail of neurovascular coupling revealed by spatiotemporal analysis of the hemodynamic response to single whisker stimulation in rat barrel cortex. J. Neurophysiol. 99 787–798. 10.1152/jn.00658.2007 - DOI - PMC - PubMed