

Changes in EEG Brain Connectivity Caused by Short-Term BCI Neurofeedback-Rehabilitation Training: A Case Study
- PMID: 34366808
- PMCID: PMC8336868
- DOI: 10.3389/fnhum.2021.627100
Changes in EEG Brain Connectivity Caused by Short-Term BCI Neurofeedback-Rehabilitation Training: A Case Study
Abstract
Background: In combined with neurofeedback, Motor Imagery (MI) based Brain-Computer Interface (BCI) has been an effective long-term treatment therapy for motor dysfunction caused by neurological injury in the brain (e.g., post-stroke hemiplegia). However, individual neurological differences have led to variability in the single sessions of rehabilitation training. Research on the impact of short training sessions on brain functioning patterns can help evaluate and standardize the short duration of rehabilitation training. In this paper, we use the electroencephalogram (EEG) signals to explore the brain patterns' changes after a short-term rehabilitation training.
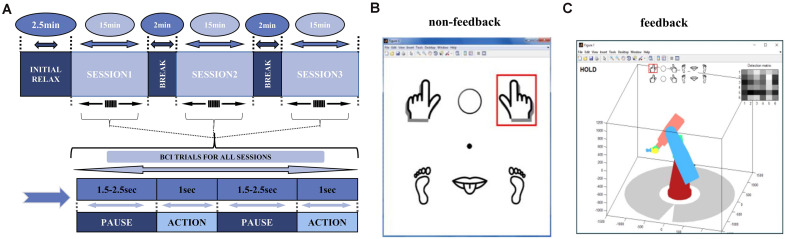
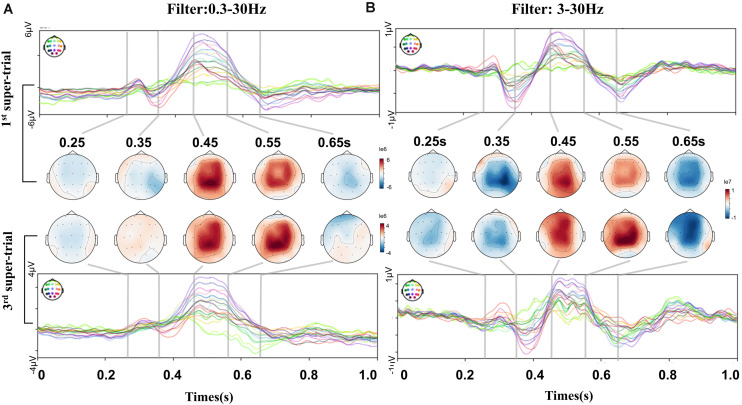
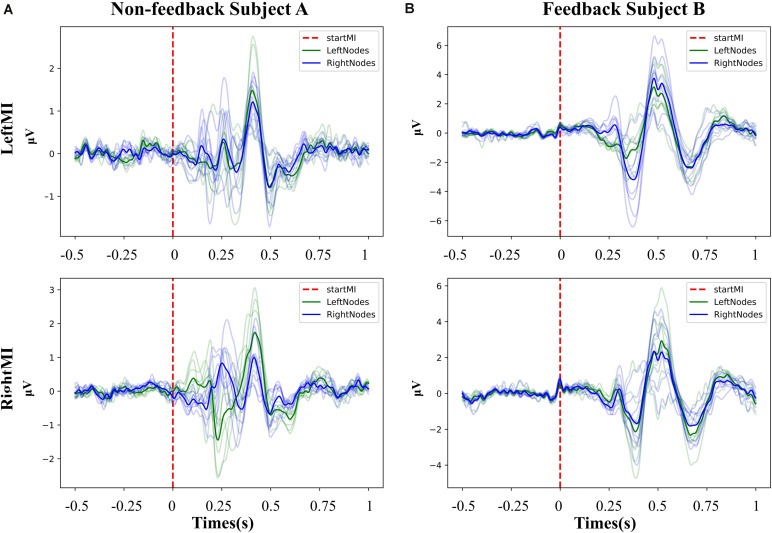
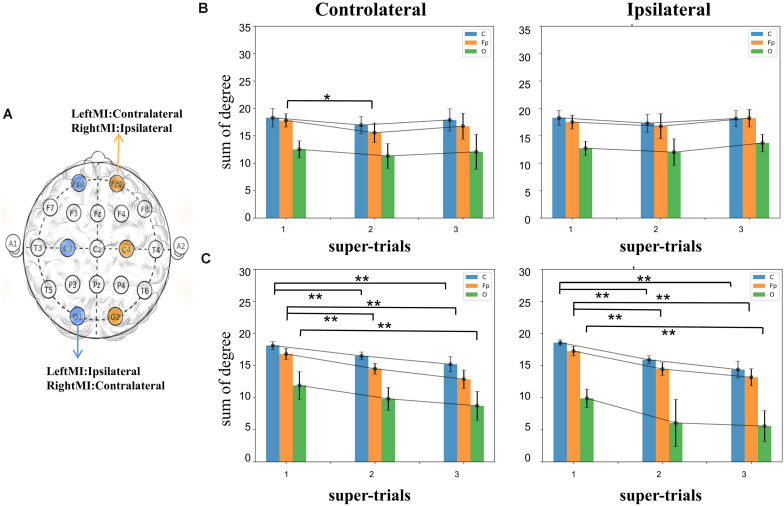
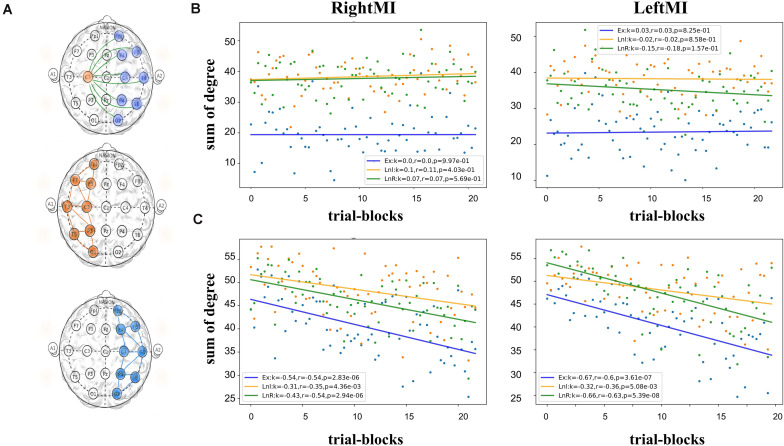
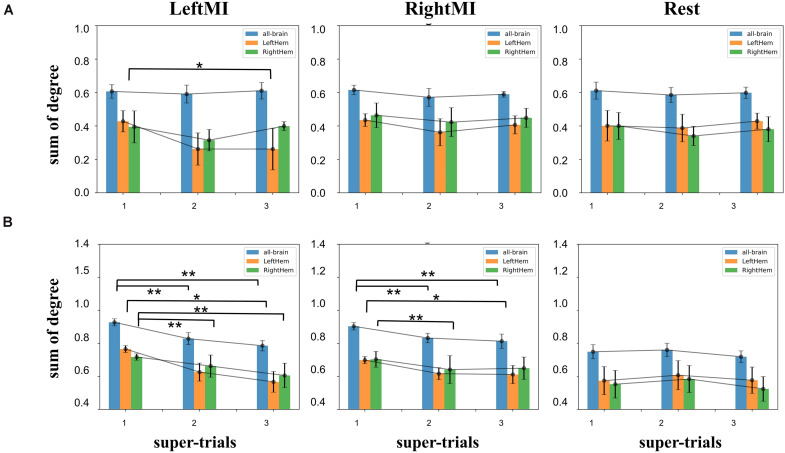
Materials and methods: Using an EEG-BCI system, we analyzed the changes in short-term (about 1-h) MI training data with and without visual feedback, respectively. We first examined the EEG signal's Mu band power's attenuation caused by Event-Related Desynchronization (ERD). Then we use the EEG's Event-Related Potentials (ERP) features to construct brain networks and evaluate the training from multiple perspectives: small-scale based on single nodes, medium-scale based on hemispheres, and large-scale based on all-brain.
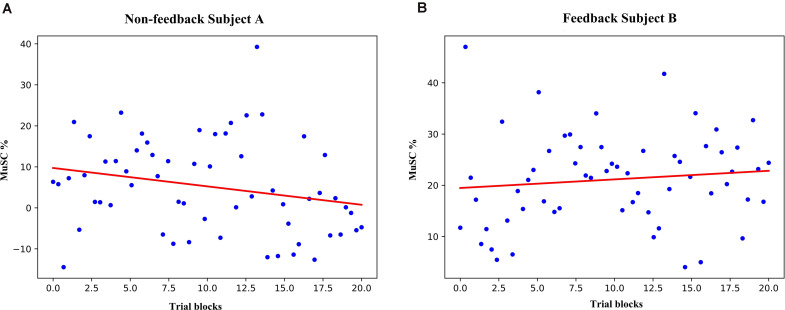
Results: Results showed no significant difference in the ERD power attenuation estimation in both groups. But the neurofeedback group's ERP brain network parameters had substantial changes and trend properties compared to the group without feedback. The neurofeedback group's Mu band power's attenuation increased but not significantly (fitting line slope = 0.2, t-test value p > 0.05) after the short-term MI training, while the non-feedback group occurred an insignificant decrease (fitting line slope = -0.4, t-test value p > 0.05). In the ERP-based brain network analysis, the neurofeedback group's network parameters were attenuated in all scales significantly (t-test value: p < 0.01); while the non-feedback group's most network parameters didn't change significantly (t-test value: p > 0.05).
Conclusion: The MI-BCI training's short-term effects does not show up in the ERD analysis significantly but can be detected by ERP-based network analysis significantly. Results inspire the efficient evaluation of short-term rehabilitation training and provide a useful reference for subsequent studies.
Keywords: brain-computer interface; brain-network analysis; electroencephalogram; event-related potentials; motor imagery; neurofeedback-rehabilitation; short-term training.
Copyright © 2021 Wang, Luo, Guo, Du, Cheng and Wang.
Conflict of interest statement
The authors declare that the research was conducted in the absence of any commercial or financial relationships that could be construed as a potential conflict of interest.
Figures
Similar articles
-
Applying a brain-computer interface to support motor imagery practice in people with stroke for upper limb recovery: a feasibility study.J Neuroeng Rehabil. 2010 Dec 14;7:60. doi: 10.1186/1743-0003-7-60. J Neuroeng Rehabil. 2010. PMID: 21156054 Free PMC article.
-
Enhancement of motor-imagery ability via combined action observation and motor-imagery training with proprioceptive neurofeedback.Neuropsychologia. 2018 Jun;114:134-142. doi: 10.1016/j.neuropsychologia.2018.04.016. Epub 2018 Apr 23. Neuropsychologia. 2018. PMID: 29698736
-
A BCI-Based Vibrotactile Neurofeedback Training Improves Motor Cortical Excitability During Motor Imagery.IEEE Trans Neural Syst Rehabil Eng. 2021;29:1583-1592. doi: 10.1109/TNSRE.2021.3102304. Epub 2021 Aug 13. IEEE Trans Neural Syst Rehabil Eng. 2021. PMID: 34343094
-
Determining optimal mobile neurofeedback methods for motor neurorehabilitation in children and adults with non-progressive neurological disorders: a scoping review.J Neuroeng Rehabil. 2022 Sep 28;19(1):104. doi: 10.1186/s12984-022-01081-9. J Neuroeng Rehabil. 2022. PMID: 36171602 Free PMC article.
-
Neurofeedback and Brain-Computer Interface-Based Methods for Post-stroke Rehabilitation.Appl Psychophysiol Biofeedback. 2025 May 28. doi: 10.1007/s10484-025-09715-z. Online ahead of print. Appl Psychophysiol Biofeedback. 2025. PMID: 40434551 Review.
Cited by
-
Motor Imagery Analysis from Extensive EEG Data Representations Using Convolutional Neural Networks.Sensors (Basel). 2022 Aug 15;22(16):6093. doi: 10.3390/s22166093. Sensors (Basel). 2022. PMID: 36015854 Free PMC article.
-
Sharpening Working Memory With Real-Time Electrophysiological Brain Signals: Which Neurofeedback Paradigms Work?Front Aging Neurosci. 2022 Mar 28;14:780817. doi: 10.3389/fnagi.2022.780817. eCollection 2022. Front Aging Neurosci. 2022. PMID: 35418848 Free PMC article. Review.
-
Clinical and neurophysiological effects of bilateral repetitive transcranial magnetic stimulation and EEG-guided neurofeedback in Parkinson's disease: a randomized, four-arm controlled trial.J Neuroeng Rehabil. 2024 Aug 5;21(1):135. doi: 10.1186/s12984-024-01427-5. J Neuroeng Rehabil. 2024. PMID: 39103947 Free PMC article. Clinical Trial.
References
-
- Ang K. K., Guan C., Phua K. S., Wang C., Zhou L., Tang K. Y., et al. (2014). Brain-computer interface-based robotic end effector system for wrist and hand rehabilitation: results of a three-armed randomized controlled trial for chronic stroke. Front. Neuroeng. 7:30. 10.3389/fneng.2014.00030 - DOI - PMC - PubMed
-
- Baig M. Z., Aslam N., Shum H. P., Zhang L. (2017). Differential evolution algorithm as a tool for optimal feature subset selection in motor imagery EEG. Expert Syst. Appl. 90 184–195. 10.1016/j.eswa.2017.07.033 - DOI
LinkOut - more resources
Full Text Sources
Research Materials