. 2021 Jul 22:15:667509.
doi: 10.3389/fnhum.2021.667509. eCollection 2021.

A Framework for Sensor-Based Assessment of Upper-Limb Functioning in Hemiparesis

Affiliations

A Framework for Sensor-Based Assessment of Upper-Limb Functioning in Hemiparesis

Ann David et al. Front Hum Neurosci. .

Abstract

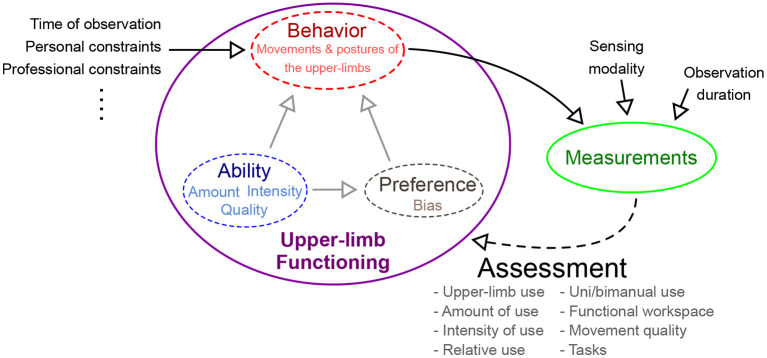
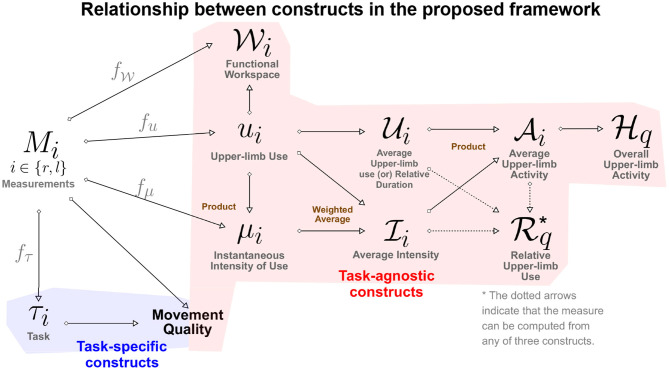
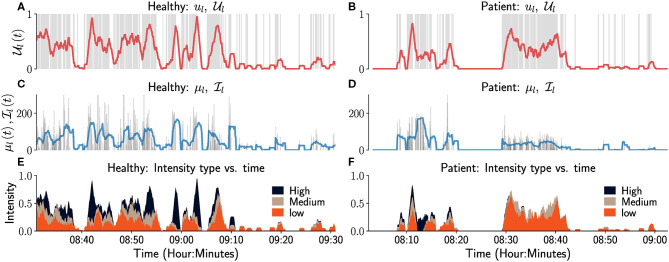
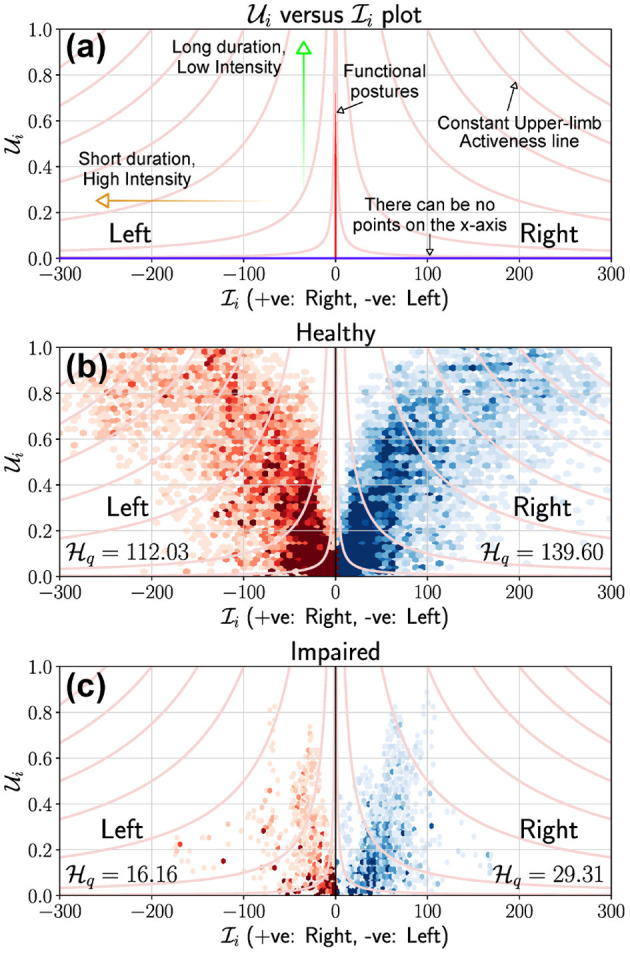
The ultimate goal of any upper-limb neurorehabilitation procedure is to improve upper-limb functioning in daily life. While clinic-based assessments provide an assessment of what a patient can do, they do not completely reflect what a patient does in his/her daily life. The use of compensatory strategies such as the use of the less affected upper-limb or excessive use of trunk in daily life is a common behavioral pattern seen in patients with hemiparesis. To this end, there has been an increasing interest in the use of wearable sensors to objectively assess upper-limb functioning. This paper presents a framework for assessing upper-limb functioning using sensors by providing: (a) a set of definitions of important constructs associated with upper-limb functioning; (b) different visualization methods for evaluating upper-limb functioning; and (c) two new measures for quantifying how much an upper-limb is used and the relative bias in their use. The demonstration of some of these components is presented using data collected from inertial measurement units from a previous study. The proposed framework can help guide the future technical and clinical work in this area to realize valid, objective, and robust tools for assessing upper-limb functioning. This will in turn drive the refinement and standardization of the assessment of upper-limb functioning.

Keywords: arm and hand use; framework; hemiparesis; real world activity; sensorimotor assessment; stroke rehabilitation; upper-limb rehabilitation; wearable sensors.


Conflict of interest statement

The authors declare that the research was conducted in the absence of any commercial or financial relationships that could be construed as a potential conflict of interest.

Figures

Figure 1
Figure 1
Different factors affecting the nature of use of the two upper-limbs during daily life. The construct of upper-limb functioning is composed of one's ability, preference, and observable behavior. Behavior is affected by multiple factors: intrinsic and extrinsic factors. Intrinsic factors inherent to a subject, e.g., ability and preference, while extrinsic factors are external to the subject. Measurements of behavior are used by an assessment procedure to estimate upper-limb functioning.
Figure 2
Figure 2
A directed graph representation of the connections between the different constructs defined in the proposed framework. The leftmost node represents the measurements, while the rest of the nodes are constructs of interest in the assessment of upper-limb functioning. The construct at the end of a directed edge is derived using the construct/measurements at the start of the directed edge. The measures (gray color text) used to quantify a construct from measurements are placed above the directed edge. The brown colored text next to some of the construct indicate how two constructs are combined to derive the target construct.
Figure 3
Figure 3
Temporal visualization of constructs related to left upper-limb use and intensity. The left and right columns correspond to data from a healthy participant and a patient, respectively. (A,B) depicts the left upper-limb use signal ul as a gray-colored event plot, where the vertical gray line at time t indicates ul (t) = 1. And the light red colored graph shows the corresponding average upper limb use Ul. (C,D) depicts the instantaneous intensity of use μl (gray) and the average intensity of use Ii (light blue) for the left upper-limb. (E,F) depicts the proportion of time the intensity of use was low (orange), medium (brown), or high (black) in the last 60 s. Although not shown in these figure, it would also be useful to indicate in such plots periods of time where there is no data available, i.e., periods where a wearable sensor has been removed and is not recording movement data from a subject.
Figure 4
Figure 4
Use vs. Intensity (UI) plot to depict the overall amount of use of the upper-limbs. (a) This plot provides the details of a typical UI plot and highlights some critical elements to help interpretation. The x axis cannot be part of the plot, and light red colored curves are the constant upper-limb activity lines. If fμ is the magnitude of acceleration as is the case in (b,c), then the y axis represents meaningful/functional postures where the intensity can be zero. (b) UI plot for a healthy participant using data collected from a single day. The 1st and 2nd quadrants of the scatter plot depicts the right (blue) and left (red) upper-limbs, respectively. (c) UI plot for a stroke participant using data collected from a single day. It is clear that the stroke participant has a low level of activity compared to the healthy participant, which is also reflected in their corresponding Hq scores.
Figure 5
Figure 5
Demonstration of the measure Hq for five different simulated scenarios corresponding to different levels of upper-limb activity. The top row shows the UI plot for the different scenarios. The shaded areas (gray) indicate different simulated scenarios from which points are sampled with uniform density. Two of constant activity lines (light red) in each plot are shown as dashed lines corresponding to Ai=2 and Ai=20. The bottom three rows depict the marginal probability density functions for Ii (second row), Ui (third row), and Ai (bottom row) for these different scenarios. The black vertical dashed line indicates the qth percentile (here, q = 90) for these different scenarios with the corresponding value written on the individual plots. Note that to enable the proper depiction of the density functions for the different scenarios, the scale for the x axis for the bottom row is adjusted.
Figure 6
Figure 6
Analysis of (A) bilateral magnitude vs. magnitude ratio (BMMR) plot (Bailey et al., 2014), (B) left intensity vs. right intensity (LIRI) plot (David et al., 2020), and (C) intensity sum vs. intensity difference plot (ISID), by investigating the nature of the family of four curves L1 (blue), L2 (red), L3 (green), and L4 (black) introduced in Equation (11). The solid and dashed lines indicate different values of c for the same curve.
Figure 7
Figure 7
BMMR, LIRI, and ISID plots of actual data from a healthy participant and a patient. The first column shows examples of the boundary of scatter plots for (a) BMMR, (d) LIRI, and (g) ISID plots for symmetric and asymmetric upper-limb use. This closed curve corresponds to the L1 and L2 curves for different values of Ir and Il. (a) The symmetric leaf shape (blue) and the asymmetric (red) shape are typical shapes seen in the plots reported by Bailey et al. (2014). (b,c) Depict the BMMR scatter plots for a healthy participant and patient using data collected during a single day. (e,f) are the corresponding LIRI and (h,i) are the corresponding ISID, plots for the same subjects. The closed black curves shown in the plots for the healthy participant and patient correspond to the 2.5th and 97.5th percentiles for Il and Ir.
Figure 8
Figure 8
Demonstration of the mapping of different types of relative upper-limb use to Rq (here, q = 90). The different types of relative upper-limb use are depicted as LIRI plots grouped together to into different levels of relative upper-limb use. The leftmost column of three LIRI plots correspond to pure unimanual use. The different groups of LIRI plots from left to right correspond to reduced bias in using one limb over the other. The corresponding Rq value for these different scenarios are displayed in the individual LIRI plots, and their mapping to the continuous interval [0, 1] is shown in the bottom.
Figure A 1
Figure A 1
Analysis of MPMR and BIUNI plots by investigating the nature of the family of four curves L1 to L4 introduced in Equation (11). (A,B) Show the loci for different curves corresponding to L1 to L4 for the MPMR and BIUNI plots, respectively.
Figure A 2
Figure A 2
MPMR, and BIUNI plots of actual data from a healthy and impaired participant. The first column shows (a,d) examples of the boundary of the distribution of scatter plots for the MPMR and BIUNI plots for symmetric and asymmetric upper-limb use. This closed curve corresponds to the L1 and L2 curves for different values of Ir and Il. (b,c) Depict the MPMR scatter plots for a healthy and impaired participant using data collected during a single day. (e,f) Corresponding BIUNI plots for the same subjects. The closed black curves shown in the plots for the healthy and impaired participant correspond to the 2.5th and 97.5th percentiles for Il and Ir.

Similar articles

Cited by

References

    1. André J.-M., Didier J.-P., Paysant J. (2004). Functional motor amnesia in stroke (1904) and “learned non-use phenomenon” (1966). J. Rehabil. Med. 36, 138–140. 10.1080/16501970410026107 - DOI - PubMed
    1. Bailey R. R., Klaesner J. W., Lang C. E. (2014). An accelerometry-based methodology for assessment of real-world bilateral upper extremity activity. PLoS ONE 9:e103135. 10.1371/journal.pone.0103135 - DOI - PMC - PubMed
    1. Bailey R. R., Klaesner J. W., Lang C. E. (2015). Quantifying real-world upper-limb activity in nondisabled adults and adults with chronic stroke. Neurorehabil. Neural Repair 29, 969–978. 10.1177/1545968315583720 - DOI - PMC - PubMed
    1. Balasubramanian S., Melendez-Calderon A., Burdet E. (2012). A robust and sensitive metric for quantifying movement smoothness. IEEE Trans. Biomed. Eng. 59, 2126–2136. 10.1109/TBME.2011.2179545 - DOI - PubMed
    1. Balasubramanian S., Melendez-Calderon A., Roby-Brami A., Burdet E. (2015). On the analysis of movement smoothness. J. NeuroEng. Rehabil. 12, 1–11. 10.1186/s12984-015-0090-9 - DOI - PMC - PubMed

LinkOut - more resources