. 2021 Jul 23:13:713726.
doi: 10.3389/fnagi.2021.713726. eCollection 2021.

Comprehensive Evaluation of the 5XFAD Mouse Model for Preclinical Testing Applications: A MODEL-AD Study

Affiliations

Comprehensive Evaluation of the 5XFAD Mouse Model for Preclinical Testing Applications: A MODEL-AD Study

Adrian L Oblak et al. Front Aging Neurosci. .

Abstract

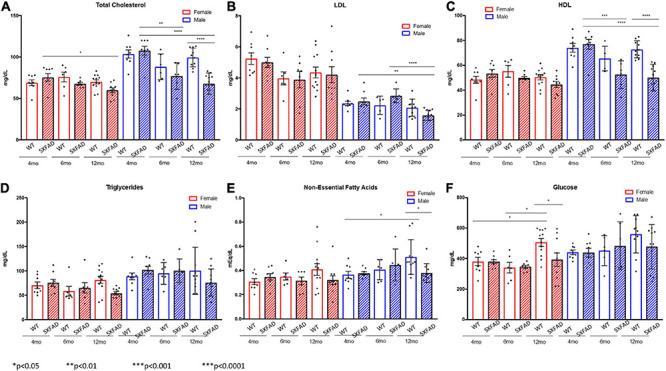
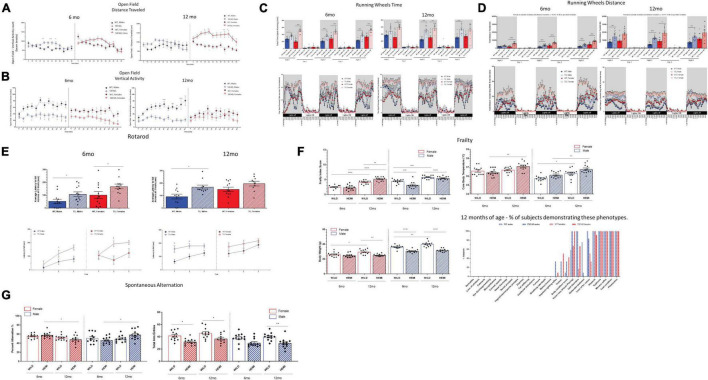
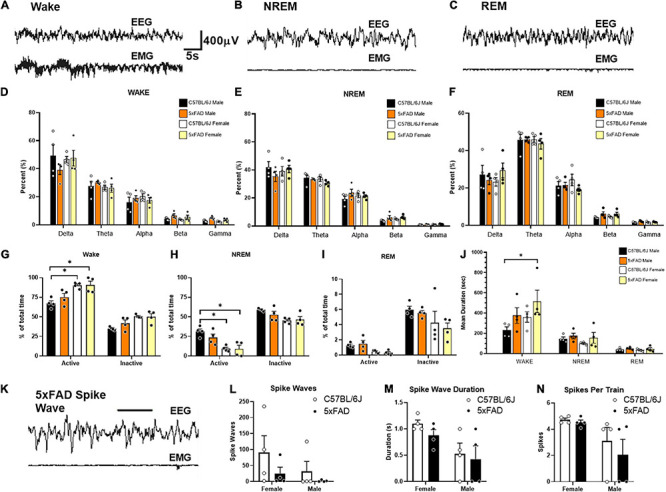
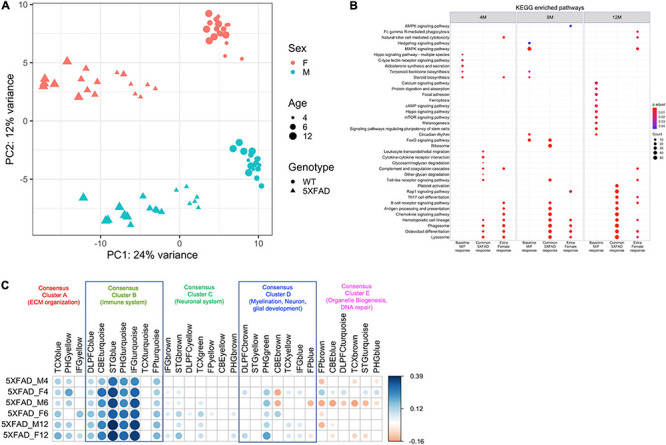
The ability to investigate therapeutic interventions in animal models of neurodegenerative diseases depends on extensive characterization of the model(s) being used. There are numerous models that have been generated to study Alzheimer's disease (AD) and the underlying pathogenesis of the disease. While transgenic models have been instrumental in understanding AD mechanisms and risk factors, they are limited in the degree of characteristics displayed in comparison with AD in humans, and the full spectrum of AD effects has yet to be recapitulated in a single mouse model. The Model Organism Development and Evaluation for Late-Onset Alzheimer's Disease (MODEL-AD) consortium was assembled by the National Institute on Aging (NIA) to develop more robust animal models of AD with increased relevance to human disease, standardize the characterization of AD mouse models, improve preclinical testing in animals, and establish clinically relevant AD biomarkers, among other aims toward enhancing the translational value of AD models in clinical drug design and treatment development. Here we have conducted a detailed characterization of the 5XFAD mouse, including transcriptomics, electroencephalogram, in vivo imaging, biochemical characterization, and behavioral assessments. The data from this study is publicly available through the AD Knowledge Portal.

Keywords: Alzheimer’s disease; MODEL-AD; animal model; early-onset AD; phenotyping.


Conflict of interest statement

TR and AB are employees of TissueVision, Inc. TR is a shareholder of TissueVision, Inc. The remaining authors declare that the research was conducted in the absence of any commercial or financial relationships that could be construed as a potential conflict of interest.

Figures

FIGURE 1
FIGURE 1
Decreased total cholesterol and lipoproteins in 5XFAD males compared to wild-type males and decreased glucose levels in 5XFAD females compared to wild-type females. Non-fasted plasma was collected at the termination of the study, and total cholesterol (A), low-density lipoproteins (B), high-density lipoproteins (C), triglycerides (D), non-essential fatty acids (E), and glucose (F) levels were measured.
FIGURE 2
FIGURE 2
Functional assessment reveals hyperactivity associated with changes in frailty score in 5XFAD mice. Hyperactivity was observed in 5XFAD mice compared with controls was determined using open field and running wheels (A–D). There were increases in distance traveled, vertical and horizonal activity and reductions in resting time. In the rotarod test (E), both male and female 5XFAD mice maintained their balance for a greater period of time than the age-and sex-matched WT controls. Male and female 5XFAD mice and controls demonstrated aging-dependent increases in frailty scores from 6 months to 12 months of age (F). 5XFAD male or female mice did not demonstrate deficits in percent alternation relative to age-and sex-matched controls at either 6 or 12 months of age (G).
FIGURE 3
FIGURE 3
No emergent phenotypes of sleep or spike-wave activity in 5XFAD mice. No emergent phenotypes of sleep or spike wave activity in 5XFAD mice. Sleep and seizure activity was assessed by EEG in female and male 5XFAD mice (n = 4 per group). Example traces during epochs of wake (A), NREM sleep (B), and REM sleep (C) are displayed across the top. No statistical differences in frequency are measured during wake (D), NREM (E), or REM (F). Analysis of sleep phase distribution during each activity period throughout the 72 h recording does not reveal significant differences in time spent in each respective sleep phase. Increased wake (G), and decreased NREM sleep (H) is witnessed in female mice during both activity phases compares to male controls. Differences in REM sleep (I) are not seen. Mean duration of wake epochs are significantly increased in females compared to male controls (J). An example of a putative spike wave identified using pike sorting criteria (K). No significant differences in spike wave activity (L), spike wave duration (M), or spikes per train (N), are identified for sex or genotype.
FIGURE 4
FIGURE 4
Transcriptomics identified genotype and sex being a major source of variation in between 5XFAD and WT mice and a positive correlation with most of the functionally distinct AMP-AD modules. (A) The first principal component accounted for 23% of the total variance and separated 5XFAD samples from WT animals. Female and male samples clustered distinctly at all ages in the second principal component (11% of total variance), suggesting the presence of sex-biased molecular changes in animals. Female and male samples are shown in red and green colors, respectively. 5XFAD and WT controls are represented as circles and triangles, respectively. Increasing point sizes represent the increasing age of the mice (4, 6, and 12 months, respectively). (B) KEGG enrichment analysis for genes significantly associated with sex (female), genotype (5XFAD) and sex by genotype interaction (5XFAD female) relative to age-matched male B6 mice. (C) Pearson correlation coefficients for gene expression changes in mice (log fold change of the 5XFAD mice minus age-matched B6 mice) and human disease (log fold change for cases minus controls). AMP-AD modules are grouped into five previously identified consensus clusters describing the major functional groups of AD-related alterations. Positive correlations are shown in blue and negative correlations in red. Color intensity and size of the circles are proportional to the correlation coefficient. Correlations with adjusted p-value > 0.05 are considered non-significant and are left blank.
FIGURE 5
FIGURE 5
Mapping the progression of methoxy-X04 labeled plaque deposition across brain regions. (A) Example brain section from 4-month-old female 5XFAD with methoxy-X04 labeled (gray) and segmentation masked plaques (red overlay). Zoom inset depicts (left to right) methoxy-X04 signal, mask (red), methoxy-X04 signal with mask overlay. (B) Plaque densities (fractional area) were quantified for all brain regions depicted as average density heat maps (red) mapped across the entire Allen Mouse Brain Reference Atlas for 6-month-old female 5XFAD, visualized as evenly spaced selected coronal sections (top) and 3D renderings (bottom). (C) Box plots of the plaque densities for 13 major brain regions from 2-, 3-, 4-, and 6-month-old female (top) to male (bottom) cohorts demonstrate regional plaque density progression, plots depict median and interquartile range (IQR-25:75) whiskers depict 1.5× IQR, and diamonds for values outside the range.
FIGURE 6
FIGURE 6
Regional increases in beta-amyloid deposition via [18F]-AV45 PET/MRI and confirmed by Autoradiography. Positron emission tomography (PET) of radiopharmaceutical [18F]-AV45 was used to measure amyloid deposition. PET data presented as brain regions normalized to the cerebellum are quantified in panels (A,B) at 4 and 12 months, respectively. Post-mortem autoradiography of coronal brain tissue is represented in panels (C,D).
FIGURE 7
FIGURE 7
Regional increases in glycolysis via [18F]-FDG PET/MRI and confirmed by Autoradiography. Positron emission tomography (PET) of radiopharmaceutical [18F]-FDG was used to measure tissue glucose uptake. PET data presented as brain regions normalized to the cerebellum are quantified in panels (A,B) at 4 and 12 months, respectively. Post-mortem autoradiography of coronal brain tissue is represented in panels (C,D).
FIGURE 8
FIGURE 8
NanoString GeoMX system indicates protein changes in cortex and hippocampus in 5XFAD mice compared to controls at 4 and 12 months. In the cortex (A), several protein markers were upregulated in the 5XFAD mouse compared to controls at both time points. The greatest increases in the cortex were in Aββ1–42 and APP, while reductions were observed in NeuN by 12 months of age. In the hippocampus (B), markers related to AD pathology (Aββ1–42, APP) as well as inflammation were upregulated as early as 4 months of age.

References

    1. Abe Y., Ikegawa N., Yoshida K., Muramatsu K., Hattori S., Kawai K., et al. (2020). Behavioral and electrophysiological evidence for a neuroprotective role of aquaporin-4 in the 5xFAD transgenic mice model. Acta Neuropathol. Commun. 8:67. - PMC - PubMed
    1. Arnold M., Nho K., Kueider-Paisley A., Massaro T., Huynh K., Brauner B., et al. (2020). Sex and APOE epsilon4 genotype modify the Alzheimer’s disease serum metabolome. Nat. Commun. 11:1148. - PMC - PubMed
    1. Bouter Y., Kacprowski T., Weissmann R., Dietrich K., Borgers H., Brauß A., et al. (2014). Deciphering the molecular profile of plaques, memory decline and neuron loss in two mouse models for Alzheimer’s disease by deep sequencing. Front. Aging Neurosci. 6:75. 10.3389/fnagi.2014.00075 - DOI - PMC - PubMed
    1. Buchman A. S., Bennett D. A. (2011). Loss of motor function in preclinical Alzheimer’s disease. Expert Rev. Neurother. 11 665–676. 10.1586/ern.11.57 - DOI - PMC - PubMed
    1. Canter R. G., Choi H., Wang J., Watson L. A., Yao C. G., Abdurrob F., et al. (2019). 3D mapping reveals network-specific amyloid progression and subcortical susceptibility in mice. Commun. Biol. 2:360. - PMC - PubMed