

Published Erratum
doi: 10.3389/fphar.2021.718452.
eCollection 2021.
Corrigendum: Tang Luo Ning, a Traditional Chinese Compound Prescription, Ameliorates Schwannopathy of Diabetic Peripheral Neuropathy Rats by Regulating Mitochondrial Dynamics In Vivo and In Vitro
Affiliations
- PMID: 34366870
- PMCID: PMC8340954
- DOI: 10.3389/fphar.2021.718452
Item in Clipboard
Published Erratum
Corrigendum: Tang Luo Ning, a Traditional Chinese Compound Prescription, Ameliorates Schwannopathy of Diabetic Peripheral Neuropathy Rats by Regulating Mitochondrial Dynamics In Vivo and In Vitro
Front Pharmacol.
.
Abstract
[This corrects the article DOI: 10.3389/fphar.2021.650448.].
Keywords: DRP1; MFN2; OPA1; diabetic peripheral neuropathy; mfn1; mitochondrial dynamics; schwann cells.
Copyright © 2021 Zhu, Yang, Li, Han, Zhu and Xu.
Figures
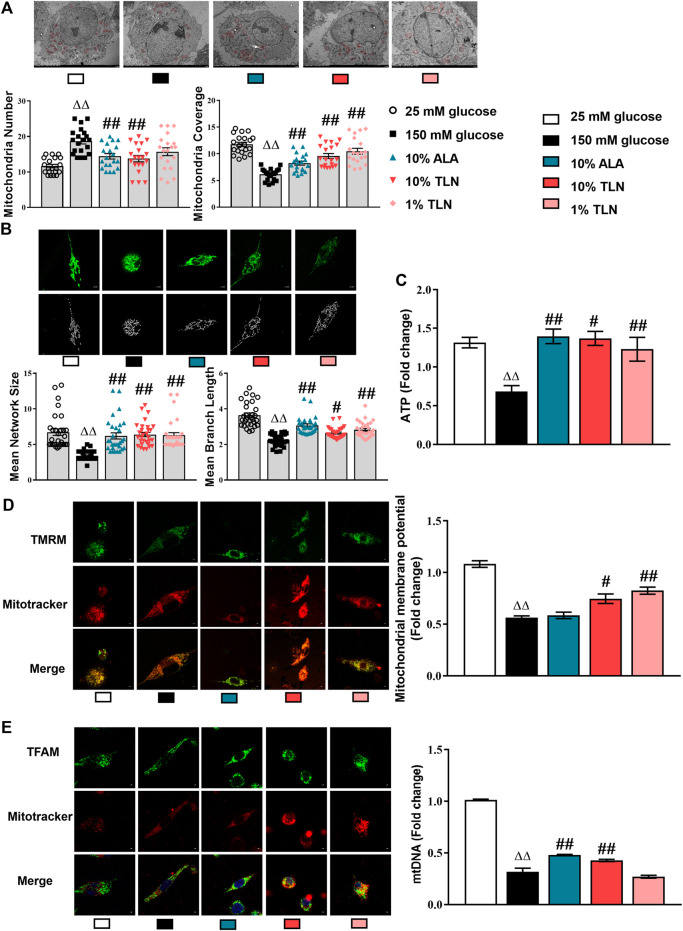
TLN serum treatment improved the mitochondrial structure and function of SCs incubated in a high glucose environment. (A) Representative images and quantifications of themitochondria number and mitochondria coverage of 30 cells. Scale bar, 5 μm. The results were normalized to the values of the 25 mM glucose group. Mitochondria are indicated by red circles. (B) Representative images and quantifications of themean network size and mean branch length of 20 cells. Scale bar, 5 μm. (C) Quantification of ATP, n = 4 for each group. (D) Representative images of immunofluorescence staining on TMRM (green) and mitochondria (red); scale bar, 5 μm, and quantification of mitochondrial membrane potential, n = 4 for each group. (E) Representative images of immunofluorescence staining on TFAM (green) and mitochondria (red); scale bar, 5 μm, and quantification of mtDNA, n = 4 for each group. ΔΔ
P< 0.01 vs. 25 mM glucose group; ##
P < 0.01, #
P< 0.05 vs. 150 mM glucose group.
Erratum for
-
Tang Luo Ning, a Traditional Chinese Compound Prescription, Ameliorates Schwannopathy of Diabetic Peripheral Neuropathy Rats by Regulating Mitochondrial Dynamics In Vivo and In Vitro.Front Pharmacol. 2021 May 14;12:650448. doi: 10.3389/fphar.2021.650448. eCollection 2021. Front Pharmacol. 2021. PMID: 34054529 Free PMC article.
Similar articles
-
Tang Luo Ning, a Traditional Chinese Compound Prescription, Ameliorates Schwannopathy of Diabetic Peripheral Neuropathy Rats by Regulating Mitochondrial Dynamics In Vivo and In Vitro.Front Pharmacol. 2021 May 14;12:650448. doi: 10.3389/fphar.2021.650448. eCollection 2021. Front Pharmacol. 2021. PMID: 34054529 Free PMC article.
-
Traditional chinese medicine tang-luo-ning ameliorates sciatic nerve injuries in streptozotocin-induced diabetic rats.Evid Based Complement Alternat Med. 2013;2013:989670. doi: 10.1155/2013/989670. Epub 2013 Oct 28. Evid Based Complement Alternat Med. 2013. PMID: 24288572 Free PMC article.
-
Treatment with Tang-luo-ning altered the microRNA expression profile in rats with diabetic peripheral neuropathy.Bioengineered. 2020 Dec;11(1):841-851. doi: 10.1080/21655979.2020.1797282. Bioengineered. 2020. PMID: 32718271 Free PMC article.
-
Schwann cell interactions with axons and microvessels in diabetic neuropathy.Nat Rev Neurol. 2017 Mar;13(3):135-147. doi: 10.1038/nrneurol.2016.201. Epub 2017 Jan 30. Nat Rev Neurol. 2017. PMID: 28134254 Free PMC article. Review.
-
Mitochondrial fusion/fission dynamics in neurodegeneration and neuronal plasticity.Neurobiol Dis. 2016 Jun;90:3-19. doi: 10.1016/j.nbd.2015.10.011. Epub 2015 Oct 19. Neurobiol Dis. 2016. PMID: 26494254 Review.
Publication types
LinkOut - more resources
Full Text Sources
Miscellaneous