

Developmental Alcohol Exposure in Drosophila: Effects on Adult Phenotypes and Gene Expression in the Brain
- PMID: 34366927
- PMCID: PMC8341641
- DOI: 10.3389/fpsyt.2021.699033
Developmental Alcohol Exposure in Drosophila: Effects on Adult Phenotypes and Gene Expression in the Brain
Abstract
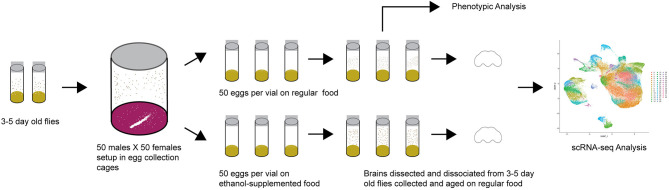
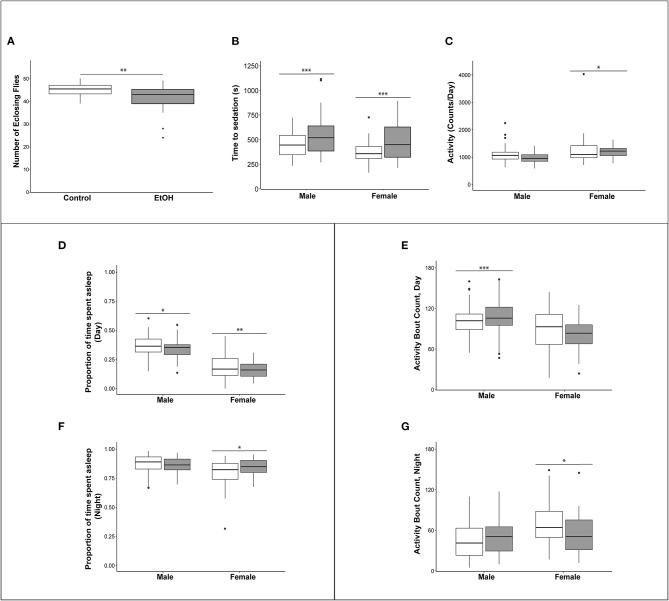
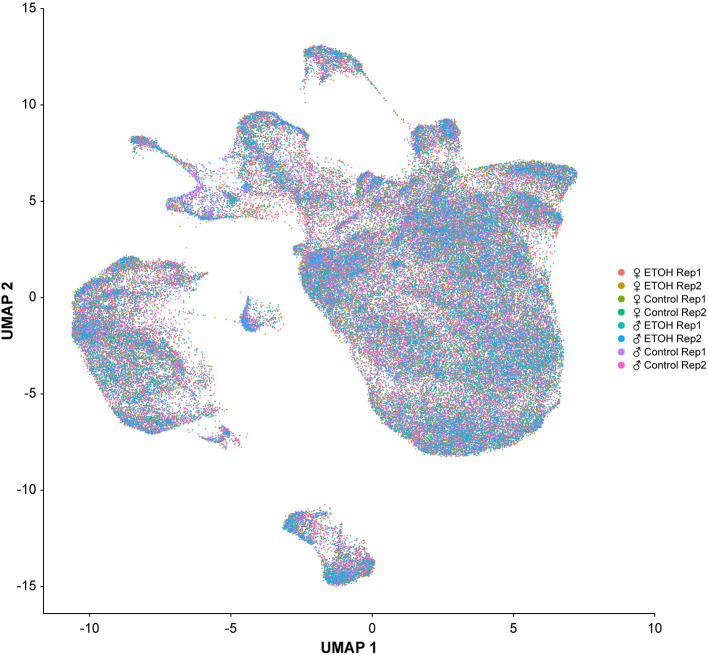
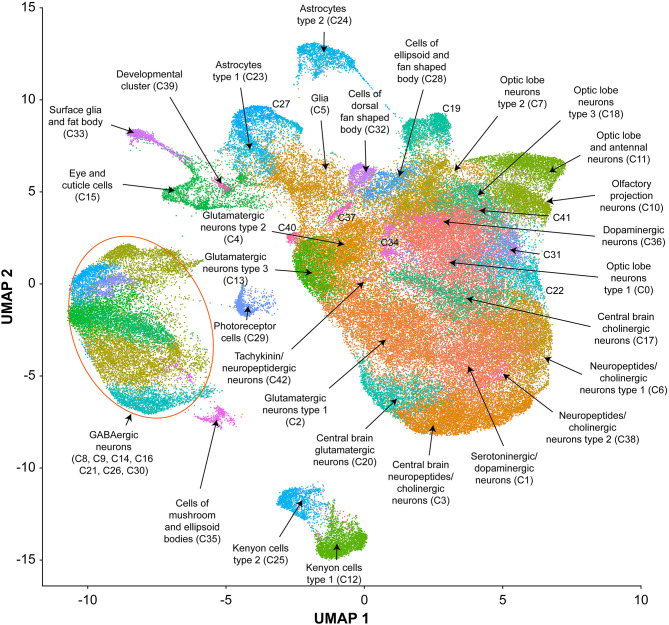
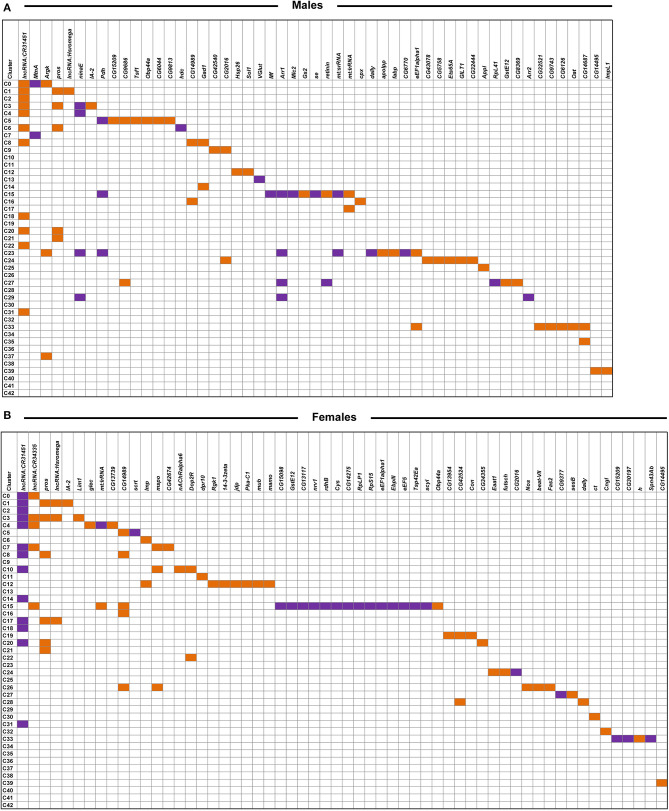
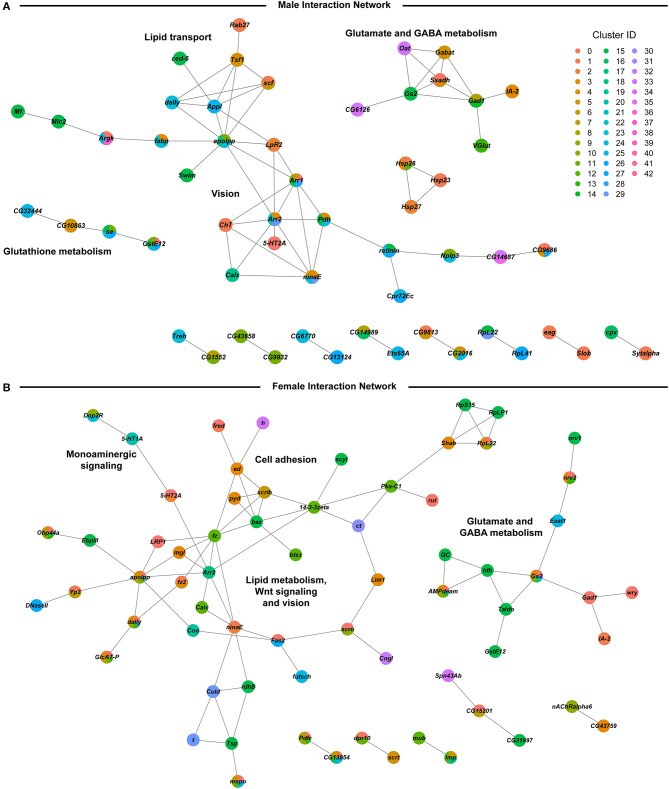
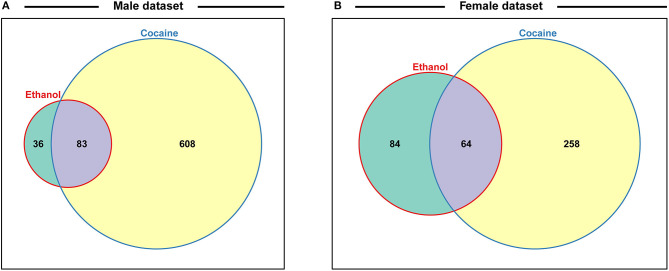
Fetal alcohol exposure can lead to developmental abnormalities, intellectual disability, and behavioral changes, collectively termed fetal alcohol spectrum disorder (FASD). In 2015, the Centers for Disease Control found that 1 in 10 pregnant women report alcohol use and more than 3 million women in the USA are at risk of exposing their developing fetus to alcohol. Drosophila melanogaster is an excellent genetic model to study developmental effects of alcohol exposure because many individuals of the same genotype can be reared rapidly and economically under controlled environmental conditions. Flies exposed to alcohol undergo physiological and behavioral changes that resemble human alcohol-related phenotypes. Here, we show that adult flies that developed on ethanol-supplemented medium have decreased viability, reduced sensitivity to ethanol, and disrupted sleep and activity patterns. To assess the effects of exposure to alcohol during development on brain gene expression, we performed single cell RNA sequencing and resolved cell clusters with differentially expressed genes which represent distinct neuronal and glial populations. Differential gene expression showed extensive sexual dimorphism with little overlap between males and females. Gene expression differences following developmental alcohol exposure were similar to previously reported differential gene expression following cocaine consumption, suggesting that common neural substrates respond to both drugs. Genes associated with glutathione metabolism, lipid transport, glutamate and GABA metabolism, and vision feature in sexually dimorphic global multi-cluster interaction networks. Our results provide a blueprint for translational studies on alcohol-induced effects on gene expression in the brain that may contribute to or result from FASD in human populations.
Keywords: behavioral genetics; fetal alcohol spectrum disorder; interaction networks; model organism; single cell RNA sequencing; transcriptomics.
Copyright © 2021 Mokashi, Shankar, MacPherson, Hannah, Mackay and Anholt.
Conflict of interest statement
The authors declare that the research was conducted in the absence of any commercial or financial relationships that could be construed as a potential conflict of interest.
Figures
Similar articles
-
Modulation of the Drosophila transcriptome by developmental exposure to alcohol.BMC Genomics. 2022 May 6;23(1):347. doi: 10.1186/s12864-022-08559-9. BMC Genomics. 2022. PMID: 35524193 Free PMC article.
-
A Cyclin E Centered Genetic Network Contributes to Alcohol-Induced Variation in Drosophila Development.G3 (Bethesda). 2018 Jul 31;8(8):2643-2653. doi: 10.1534/g3.118.200260. G3 (Bethesda). 2018. PMID: 29871898 Free PMC article.
-
Developmental ethanol exposure leads to dysregulation of lipid metabolism and oxidative stress in Drosophila.G3 (Bethesda). 2014 Nov 11;5(1):49-59. doi: 10.1534/g3.114.015040. G3 (Bethesda). 2014. PMID: 25387828 Free PMC article.
-
Fetal Alcohol Spectrum Disorder: Potential Role of Endocannabinoids Signaling.Brain Sci. 2015 Oct 29;5(4):456-93. doi: 10.3390/brainsci5040456. Brain Sci. 2015. PMID: 26529026 Free PMC article. Review.
-
Overview of the Genetic Basis and Epigenetic Mechanisms that Contribute to FASD Pathobiology.Curr Top Med Chem. 2017;17(7):808-828. doi: 10.2174/1568026616666160414124816. Curr Top Med Chem. 2017. PMID: 27086780 Review.
Cited by
-
Insect Insights at the Single-Cell Level: Technologies and Applications.Cells. 2023 Dec 31;13(1):91. doi: 10.3390/cells13010091. Cells. 2023. PMID: 38201295 Free PMC article. Review.
-
Pleiotropic fitness effects of a Drosophila odorant-binding protein.G3 (Bethesda). 2023 Feb 9;13(2):jkac307. doi: 10.1093/g3journal/jkac307. G3 (Bethesda). 2023. PMID: 36454098 Free PMC article.
-
Perspectives on the Drosophila melanogaster Model for Advances in Toxicological Science.Curr Protoc. 2023 Aug;3(8):e870. doi: 10.1002/cpz1.870. Curr Protoc. 2023. PMID: 37639638 Free PMC article. Review.
-
Synaptic Mechanisms of Ethanol Tolerance and Neuroplasticity: Insights from Invertebrate Models.Int J Mol Sci. 2024 Jun 21;25(13):6838. doi: 10.3390/ijms25136838. Int J Mol Sci. 2024. PMID: 38999947 Free PMC article. Review.
-
Tsc2 coordinates neuroprogenitor differentiation.iScience. 2023 Nov 14;26(12):108442. doi: 10.1016/j.isci.2023.108442. eCollection 2023 Dec 15. iScience. 2023. PMID: 38107199 Free PMC article.
References
Grants and funding
LinkOut - more resources
Full Text Sources
Molecular Biology Databases