

Familiarity and Novelty in Aesthetic Preference: The Effects of the Properties of the Artwork and the Beholder
- PMID: 34367021
- PMCID: PMC8345014
- DOI: 10.3389/fpsyg.2021.694927
Familiarity and Novelty in Aesthetic Preference: The Effects of the Properties of the Artwork and the Beholder
Abstract
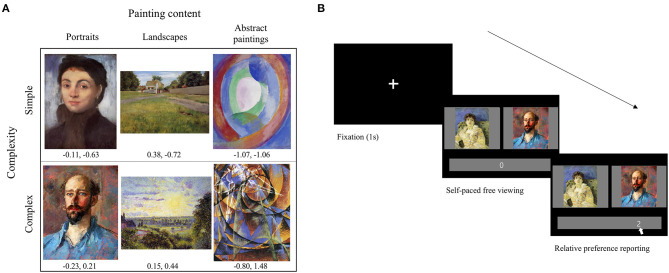
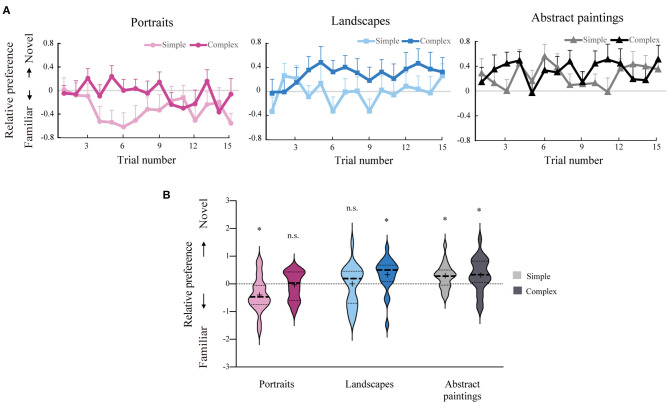
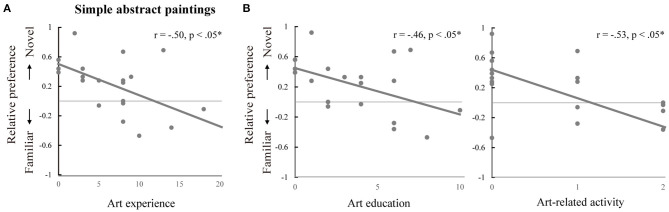
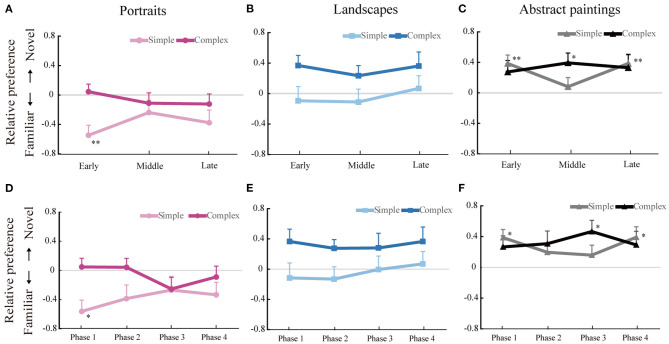
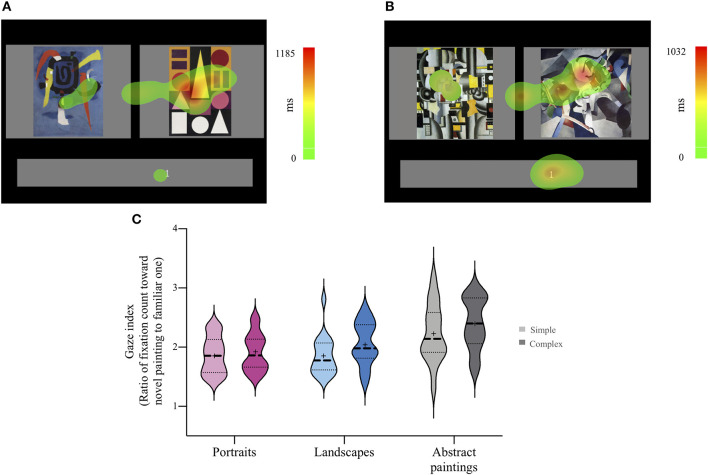
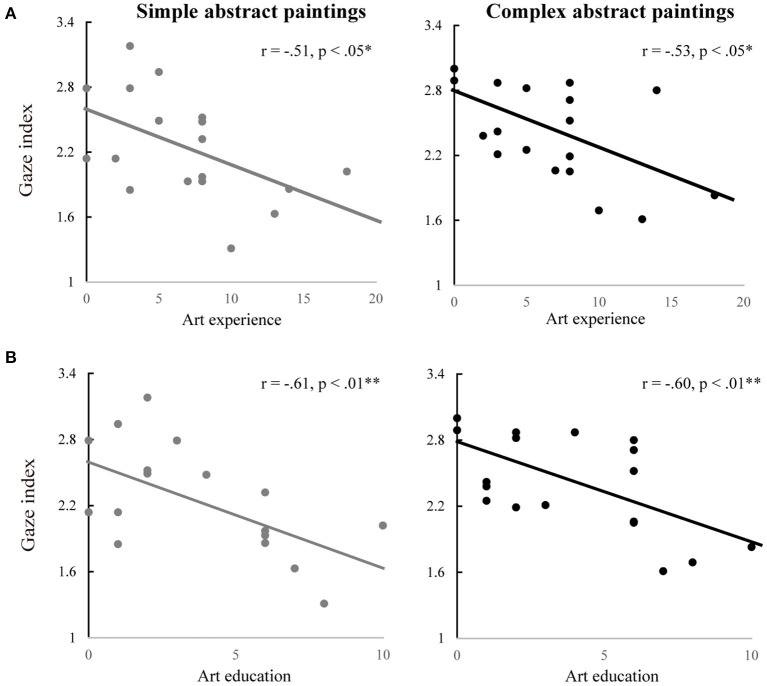
Familiarity and novelty are fundamental yet competing factors influencing aesthetic preference. However, whether people prefer familiar paintings or novel paintings has not been clear. Using both behavioral and eye-tracking measures, the present study aimed to investigate whether the effect of familiarity-novelty on aesthetic preference is independent or dependent on artwork properties (painting content, visual complexity) and viewer characteristics (experience in art). Participants were presented with two images of paintings, one of which was repeatedly presented but was always paired with a new painting in a randomized lateral arrangement. They were asked to indicate which of the two images they preferred with the degree of their preference. Behavioral results demonstrated an interactive influence of painting content and complexity on familiarity-novelty preference, especially alongside the distinction between representational and abstract paintings. Also, the familiarity-novelty preference was modulated by the degree of art experience, for abstract paintings in particular. Gaze results showed the differential effects of painting content, complexity, and art experience echoing the behavioral results. Taken together, the convergent results derived from behavioral and eye-tracking measures imply that novelty is an important feature of aesthetic appreciation, but its influence is modulated by properties of both the artwork and the beholder.
Keywords: art experience; content; familiarity; novelty; paintings; preference; visual complexity.
Copyright © 2021 Song, Kwak and Kim.
Conflict of interest statement
The authors declare that the research was conducted in the absence of any commercial or financial relationships that could be construed as a potential conflict of interest.
Figures
Similar articles
-
Art expertise in construing meaning of representational and abstract artworks.Acta Psychol (Amst). 2019 Jan;192:11-22. doi: 10.1016/j.actpsy.2018.10.012. Epub 2018 Nov 1. Acta Psychol (Amst). 2019. PMID: 30390421
-
An independent contribution of colour to the aesthetic preference for paintings.Vision Res. 2020 Dec;177:109-117. doi: 10.1016/j.visres.2020.08.005. Epub 2020 Oct 10. Vision Res. 2020. PMID: 33045445
-
Kandinsky or Me? How Free Is the Eye of the Beholder in Abstract Art?Iperception. 2019 Sep 4;10(5):2041669519867973. doi: 10.1177/2041669519867973. eCollection 2019 Sep-Oct. Iperception. 2019. PMID: 31565211 Free PMC article.
-
Self-organization of an artificial neural network subjected to attention shift impairments and familiarity preference, characteristics studied in autism.J Autism Dev Disord. 2004 Apr;34(2):189-98. doi: 10.1023/b:jadd.0000022609.31371.4d. J Autism Dev Disord. 2004. PMID: 15162937 Review.
-
Emotion in Painting and Art Installations.Am J Psychol. 2015 Fall;128(3):305-22. doi: 10.5406/amerjpsyc.128.3.0305. Am J Psychol. 2015. PMID: 26442338 Review.
Cited by
-
Dancing robots: aesthetic engagement is shaped by stimulus and knowledge cues to human animacy.Front Hum Neurosci. 2024 Nov 25;18:1413066. doi: 10.3389/fnhum.2024.1413066. eCollection 2024. Front Hum Neurosci. 2024. PMID: 39655063 Free PMC article.
-
Substance familiarity in middle childhood and adolescent substance use.Drug Alcohol Depend. 2023 Sep 1;250:110892. doi: 10.1016/j.drugalcdep.2023.110892. Epub 2023 Jul 7. Drug Alcohol Depend. 2023. PMID: 37473699 Free PMC article.
-
Quantitative and qualitative influences of spiritual connection and natural imagery on perception of art in clinical psychedelic dosing settings.Sci Rep. 2025 Jul 21;15(1):26500. doi: 10.1038/s41598-025-12613-3. Sci Rep. 2025. PMID: 40691491 Free PMC article.
-
Examining the multidimensional impact on soft drink packaging preferences through the unified model of aesthetics.Sci Rep. 2025 Feb 8;15(1):4782. doi: 10.1038/s41598-025-87741-x. Sci Rep. 2025. PMID: 39922851 Free PMC article.
-
Effectiveness of labels in digital art experience: psychophysiological and behavioral evidence.Front Psychol. 2024 Jul 1;15:1342667. doi: 10.3389/fpsyg.2024.1342667. eCollection 2024. Front Psychol. 2024. PMID: 39011289 Free PMC article.
References
-
- Arnason H. H., Mansfield E. (2013). History of Modern Art: Painting, Sculpture, Architecture, Photography. Boston, MA: Pearson.
LinkOut - more resources
Full Text Sources