

Clostridium cellulovorans Proteomic Responses to Butanol Stress
- PMID: 34367082
- PMCID: PMC8336468
- DOI: 10.3389/fmicb.2021.674639
Clostridium cellulovorans Proteomic Responses to Butanol Stress
Abstract
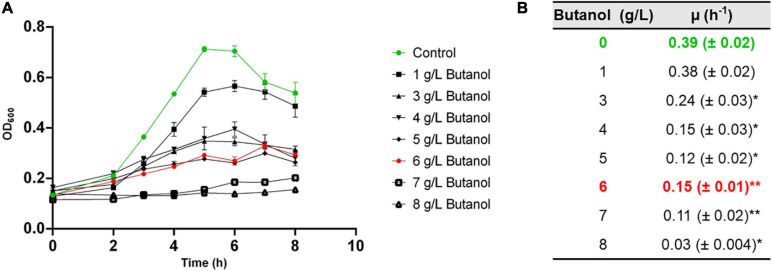
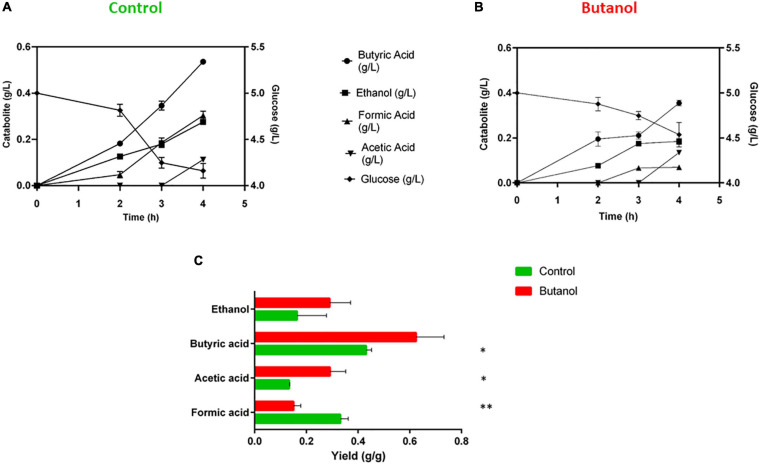
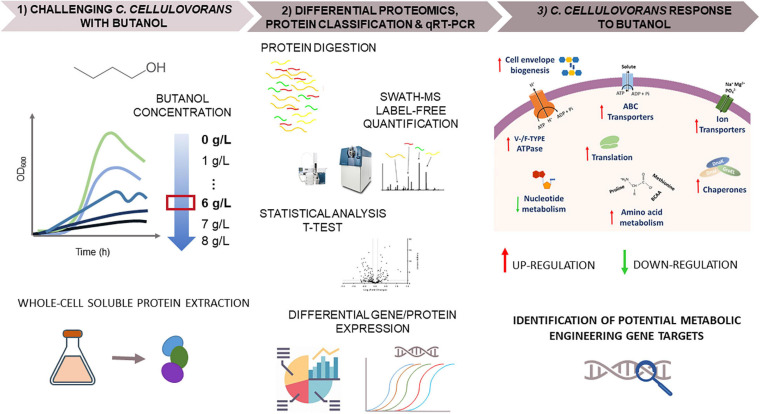
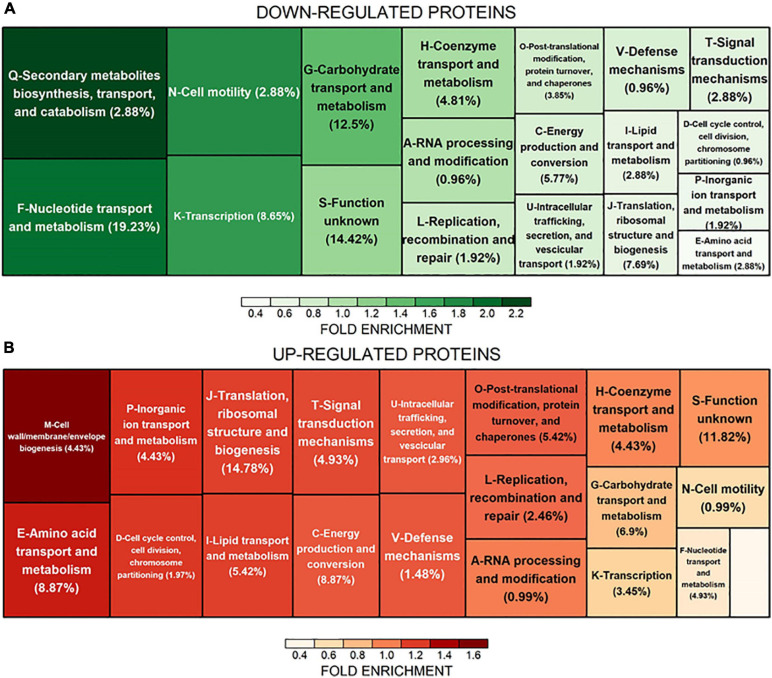
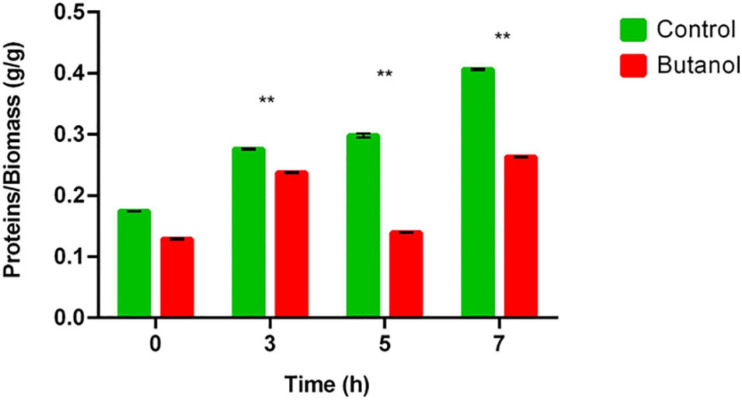
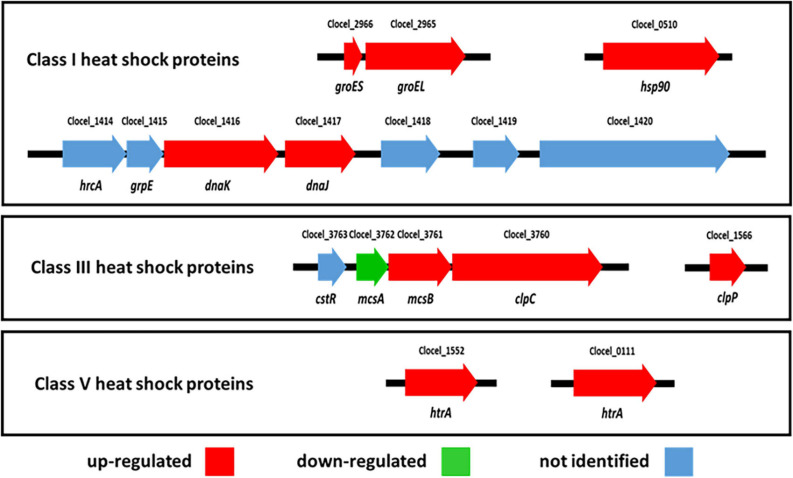
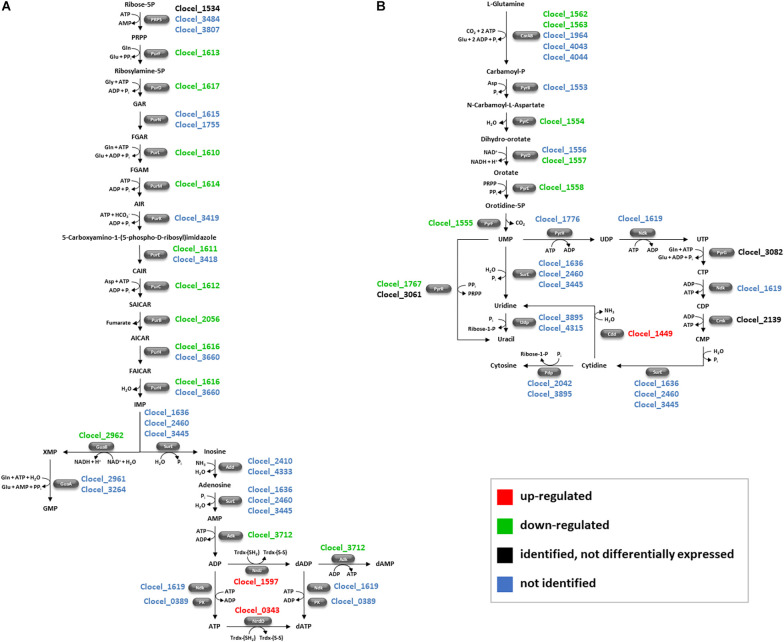
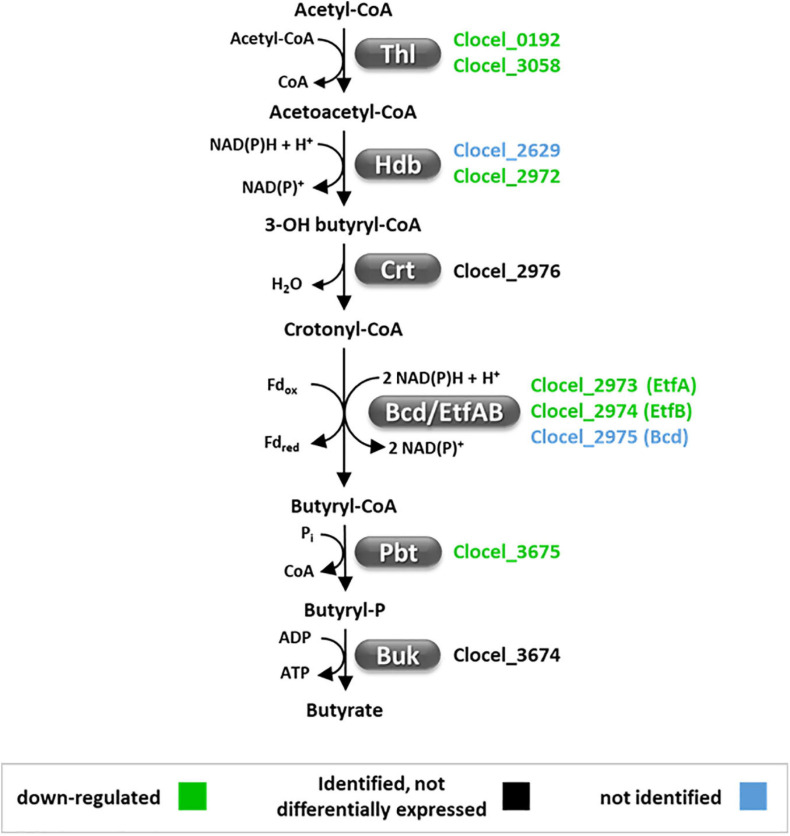
Combination of butanol-hyperproducing and hypertolerant phenotypes is essential for developing microbial strains suitable for industrial production of bio-butanol, one of the most promising liquid biofuels. Clostridium cellulovorans is among the microbial strains with the highest potential for direct production of n-butanol from lignocellulosic wastes, a process that would significantly reduce the cost of bio-butanol. However, butanol exhibits higher toxicity compared to ethanol and C. cellulovorans tolerance to this solvent is low. In the present investigation, comparative gel-free proteomics was used to study the response of C. cellulovorans to butanol challenge and understand the tolerance mechanisms activated in this condition. Sequential Window Acquisition of all Theoretical fragment ion spectra Mass Spectrometry (SWATH-MS) analysis allowed identification and quantification of differentially expressed soluble proteins. The study data are available via ProteomeXchange with the identifier PXD024183. The most important response concerned modulation of protein biosynthesis, folding and degradation. Coherent with previous studies on other bacteria, several heat shock proteins (HSPs), involved in protein quality control, were up-regulated such as the chaperones GroES (Cpn10), Hsp90, and DnaJ. Globally, our data indicate that protein biosynthesis is reduced, likely not to overload HSPs. Several additional metabolic adaptations were triggered by butanol exposure such as the up-regulation of V- and F-type ATPases (involved in ATP synthesis/generation of proton motive force), enzymes involved in amino acid (e.g., arginine, lysine, methionine, and branched chain amino acids) biosynthesis and proteins involved in cell envelope re-arrangement (e.g., the products of Clocel_4136, Clocel_4137, Clocel_4144, Clocel_4162 and Clocel_4352, involved in the biosynthesis of saturated fatty acids) and a redistribution of carbon flux through fermentative pathways (acetate and formate yields were increased and decreased, respectively). Based on these experimental findings, several potential gene targets for metabolic engineering strategies aimed at improving butanol tolerance in C. cellulovorans are suggested. This includes overexpression of HSPs (e.g., GroES, Hsp90, DnaJ, ClpC), RNA chaperone Hfq, V- and F-type ATPases and a number of genes whose function in C. cellulovorans is currently unknown.
Keywords: ATPase; Hfq chaperone; butyrate; heat shock proteins; stringent response.
Copyright © 2021 Costa, Usai, Re, Manfredi, Mannino, Bertea, Pessione and Mazzoli.
Conflict of interest statement
The authors declare that the research was conducted in the absence of any commercial or financial relationships that could be construed as a potential conflict of interest.
Figures
Similar articles
-
Clostridium cellulovorans metabolism of cellulose as studied by comparative proteomic approach.J Proteomics. 2020 Mar 30;216:103667. doi: 10.1016/j.jprot.2020.103667. Epub 2020 Jan 23. J Proteomics. 2020. PMID: 31982546
-
Enhanced solvent production by metabolic engineering of a twin-clostridial consortium.Metab Eng. 2017 Jan;39:38-48. doi: 10.1016/j.ymben.2016.10.013. Epub 2016 Oct 27. Metab Eng. 2017. PMID: 27794465
-
Improved n-Butanol Production from Clostridium cellulovorans by Integrated Metabolic and Evolutionary Engineering.Appl Environ Microbiol. 2019 Mar 22;85(7):e02560-18. doi: 10.1128/AEM.02560-18. Print 2019 Apr 1. Appl Environ Microbiol. 2019. PMID: 30658972 Free PMC article.
-
Recent advances in n-butanol and butyrate production using engineered Clostridium tyrobutyricum.World J Microbiol Biotechnol. 2020 Aug 14;36(9):138. doi: 10.1007/s11274-020-02914-2. World J Microbiol Biotechnol. 2020. PMID: 32794091 Review.
-
Engineering Clostridium for improved solvent production: recent progress and perspective.Appl Microbiol Biotechnol. 2019 Jul;103(14):5549-5566. doi: 10.1007/s00253-019-09916-7. Epub 2019 May 29. Appl Microbiol Biotechnol. 2019. PMID: 31139901 Review.
Cited by
-
Clostridium acetobutylicum atpG-Knockdown Mutants Increase Extracellular pH in Batch Cultures.Front Bioeng Biotechnol. 2021 Oct 25;9:754250. doi: 10.3389/fbioe.2021.754250. eCollection 2021. Front Bioeng Biotechnol. 2021. PMID: 34760879 Free PMC article.
-
The potential of native and engineered Clostridia for biomass biorefining.Front Bioeng Biotechnol. 2024 Aug 16;12:1423935. doi: 10.3389/fbioe.2024.1423935. eCollection 2024. Front Bioeng Biotechnol. 2024. PMID: 39219620 Free PMC article. Review.
-
Proteome profiling of Campylobacter jejuni 81-176 at 37 °C and 42 °C by label-free mass spectrometry.BMC Microbiol. 2024 May 31;24(1):191. doi: 10.1186/s12866-024-03348-8. BMC Microbiol. 2024. PMID: 38822261 Free PMC article.
-
Current progress on engineering microbial strains and consortia for production of cellulosic butanol through consolidated bioprocessing.Microb Biotechnol. 2023 Feb;16(2):238-261. doi: 10.1111/1751-7915.14148. Epub 2022 Sep 27. Microb Biotechnol. 2023. PMID: 36168663 Free PMC article. Review.
References
-
- Alsaker K. V., Paredes C., Papoutsakis E. T. (2010). Metabolite stress and tolerance in the production of biofuels and chemicals: gene-expression-based systems analysis of butanol, butyrate, and acetate stresses in the anaerobe Clostridium acetobutylicum. Biotechnol. Bioeng. 105 1131–1147. 10.1002/bit.22628 - DOI - PubMed
-
- Badalato N., Guillot A., Sabarly V., Dubois M., Pourette N., Pontoire B., et al. (2017). Whole proteome analyses on Ruminiclostridium cellulolyticum show a modulation of the cellulolysis machinery in response to cellulosic materials with subtle differences in chemical and structural properties. PLoS One 12:e0170524. 10.1371/journal.pone.0170524 - DOI - PMC - PubMed
LinkOut - more resources
Full Text Sources
Molecular Biology Databases