. 2021 Jul 22:12:701186.
doi: 10.3389/fmicb.2021.701186. eCollection 2021.

Divergent Genomic Adaptations in the Microbiomes of Arctic Subzero Sea-Ice and Cryopeg Brines

Affiliations

Divergent Genomic Adaptations in the Microbiomes of Arctic Subzero Sea-Ice and Cryopeg Brines

Josephine Z Rapp et al. Front Microbiol. .

Abstract

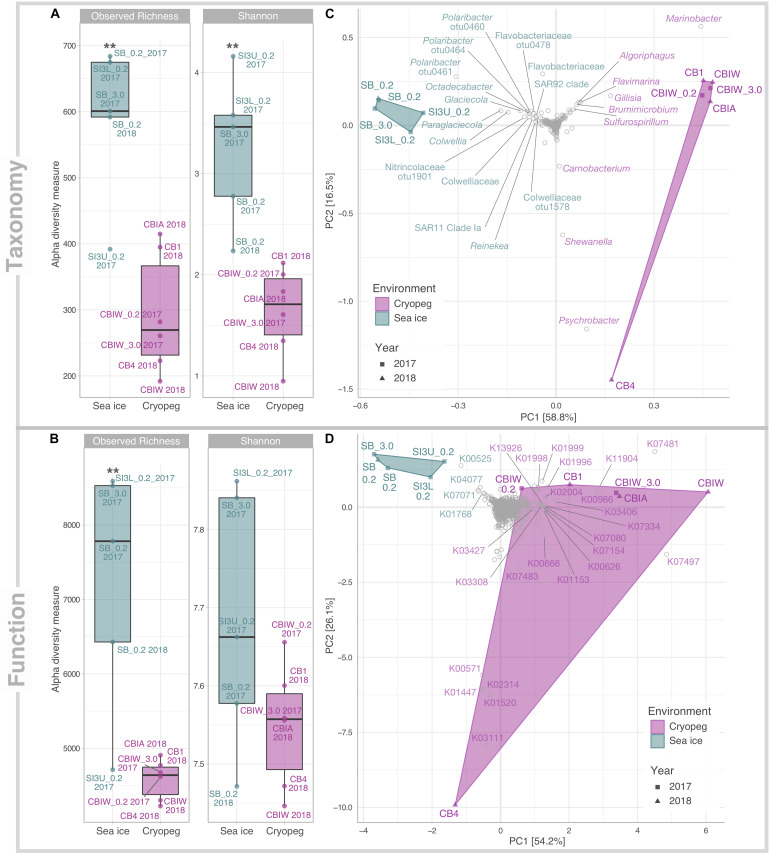
Subzero hypersaline brines are liquid microbial habitats within otherwise frozen environments, where concentrated dissolved salts prevent freezing. Such extreme conditions presumably require unique microbial adaptations, and possibly altered ecologies, but specific strategies remain largely unknown. Here we examined prokaryotic taxonomic and functional diversity in two seawater-derived subzero hypersaline brines: first-year sea ice, subject to seasonally fluctuating conditions; and ancient cryopeg, under relatively stable conditions geophysically isolated in permafrost. Overall, both taxonomic composition and functional potential were starkly different. Taxonomically, sea-ice brine communities (∼105 cells mL-1) had greater richness, more diversity and were dominated by bacterial genera, including Polaribacter, Paraglaciecola, Colwellia, and Glaciecola, whereas the more densely inhabited cryopeg brines (∼108 cells mL-1) lacked these genera and instead were dominated by Marinobacter. Functionally, however, sea ice encoded fewer accessory traits and lower average genomic copy numbers for shared traits, though DNA replication and repair were elevated; in contrast, microbes in cryopeg brines had greater genetic versatility with elevated abundances of accessory traits involved in sensing, responding to environmental cues, transport, mobile elements (transposases and plasmids), toxin-antitoxin systems, and type VI secretion systems. Together these genomic features suggest adaptations and capabilities of sea-ice communities manifesting at the community level through seasonal ecological succession, whereas the denser cryopeg communities appear adapted to intense bacterial competition, leaving fewer genera to dominate with brine-specific adaptations and social interactions that sacrifice some members for the benefit of others. Such cryopeg genomic traits provide insight into how long-term environmental stability may enable life to survive extreme conditions.

Keywords: cryopeg; cryosphere; hypersalinity; metagenomics; metatranscriptomics; microbial ecology; sea ice; subzero temperature.


Conflict of interest statement

The authors declare that the research was conducted in the absence of any commercial or financial relationships that could be construed as a potential conflict of interest.

Figures

FIGURE 1
FIGURE 1
Alpha and beta diversity of prokaryotic community composition and functional potential in sea ice and cryopeg brines. Indices of (A) taxonomic observed richness and Shannon diversity on the basis of taxonomic assignments inferred for extracted 16S rRNA gene reads; and (B) observed richness and diversity of functional potential on the basis of normalized KO abundances. Asterisks indicate significant variance between means of both environments (** indicates p < 0.01). Beta diversity of (C) taxonomic composition and (D) functional potential was visualized through principal component analysis (PCA). The relative contribution (eigenvalue) of each axis to the total inertia in the data is indicated in percent at the axis titles. For (C) data were transformed initially by applying a Hellinger transformation; for (D) data were normalized through MUSiCC (see section “Materials and Methods”). An additional layer of information was added in the form of species scores to specify (C) prokaryotic taxa and (D) molecular functions that contributed most strongly to the variance between samples. K00525: ribonucleoside-diphosphate reductase alpha chain; K00571: site-specific DNA-methyltransferase (adenine-specific); K00626: acetyl-CoA C-acetyltransferase; K00666: fatty-acyl-CoA synthase; K00986: RNA-directed DNA polymerase; K01153: type I restriction enzyme, R subunit; K01447: N-acetylmuramoyl-L-alanine amidase; K01520: dUTP pyrophosphatase; K01768: adenylate cyclase; K01996: branched-chain amino acid transport system ATP-binding protein; K01998: branched-chain amino acid transport system permease protein; K01999:branched-chain amino acid transport system substrate-binding protein; K02004: putative ABC transport system permease protein; K02314: replicative DNA helicase; K03111: single-strand DNA-binding protein; K03308 neurotransmitter:Na + symporter, NSS family; K03406 mcp; methyl-accepting chemotaxis protein; K03427: type I restriction enzyme M protein; K04077: chaperonin GroEL; K07017: uncharacterized protein; K07080: uncharacterized protein; K07154: serine/threonine-protein kinase HipA; K07334: toxin HigB-1; K07481: transposase, IS5 family; K07483: transposase; K07497: putative transposase; K11904: type VI secretion system secreted protein VgrG; K13926: ribosome-dependent ATPase.
FIGURE 2
FIGURE 2
Heatmap of prokaryotic community composition in sea-ice and cryopeg brine metagenomes. Dominant genera (>1% relative abundance in at least one sample) are organized in the form of a Neighbor-Joining phylogenetic tree reconstructed on the basis of full-length 16S rRNA genes. Candidatus Nitrosopumilus was chosen as outgroup. The Jukes-Cantor model and 1,000 bootstraps were used for tree calculation. Dots symbolize values <0.05%; empty cells indicate no detection of that genus in a particular sample.
FIGURE 3
FIGURE 3
Heatmap of prokaryotic functional potential in sea ice and cryopeg brines summarized at the level of pathways involved in metabolism, genetic and environmental information processing, and cellular processes. Sample order was determined by the calculation of a dendrogram, using the euclidean distance method and ward.D clustering. Cell values display the normalized average number of pathway genes per genome in the sample (see section “Materials and Methods” for details), while cell color represents the value’s standard score (z-score), and therefore its deviation from the row mean. Displayed are pathways that were common to sea-ice and/or cryopeg microbes, i.e., detected across all sea-ice and/or all cryopeg samples with a mean abundance of >1. Those that differed significantly between brine types are in bold; pathways that did not differ significantly but showed a log2-fold difference in mean abundance of > 1 between the environments are also shown.
FIGURE 4
FIGURE 4
Box and whisker plots summarizing the functional potential of prokaryotic communities in sea ice and cryopeg brines for the metabolism of amino acids, cofactors and vitamins, lipopolysaccharides, as well as the degradation of aromatics. Boxes indicate the median of each group, as well as the first and third quartiles of sample distribution (the 25th and 75th percentiles). Whiskers extend from the hinge to the largest value no further than 1.5 × IQR from the hinge (where IQR is the interquartile range, or distance between the first and third quartiles). Displayed are modules that were common to sea-ice and/or cryopeg microbes, i.e., detected across all sea-ice and/or all cryopeg samples with a mean abundance of >1. Those that differed significantly between brine types are in bold; modules that did not differ significantly but showed a log2-fold difference in mean abundance of >1 between the environments are also shown.
FIGURE 5
FIGURE 5
Box and whisker plots summarizing the functional potential of prokaryotic communities in sea ice and cryopeg brines for environmental information processing, including transport of compounds across cell membranes via ABC transport systems, use of bacterial secretion systems, and the ability to sense and respond to environmental cues via two-component systems. Boxes indicate the median of each group, as well as the first and third quartiles of sample distribution (the 25th and 75th percentiles). Whiskers extend from the hinge to the largest value no further than 1.5 × IQR from the hinge (where IQR is the interquartile range, or distance between the first and third quartiles). Displayed are modules that were common to sea-ice and/or cryopeg microbes, i.e., detected across all sea-ice and/or all cryopeg samples with a mean abundance of >1. Those that differed significantly between brine types are in bold; modules that did not differ significantly but showed a log2-fold difference in mean abundance of >1 between the environments are also shown.
FIGURE 6
FIGURE 6
Schematic of genomic adaptations to life in subzero hypersaline sea-ice brines (upper panels) and cryopeg brines (lower panels). Sea ice, exposed to atmospheric conditions and in exchange with underlying seawater (left), is characterized by vertical gradients in temperature, salinity and nutrient availability and subject to temporal disturbances of these conditions. Its internal brine-filled network of pores and channels provides habitat for prokaryotic (primarily bacterial) and eukaryotic life (middle). Bacterial genomes in sea ice, represented by a single generic cell (right), were enriched in functions relevant for DNA replication and repair, transcription, RNA degradation, and nucleotide metabolism, as well as for membrane transport of simple sugars and the export of capsular polysaccharides, secretion of compounds through type I secretion systems and carotenoid biosynthesis. Cryopeg, a subsurface layer of unfrozen sediment within permafrost (left), is isolated from the atmosphere, permanently dark and characterized by relatively stable geophysical conditions across millennia. Brine is present in discrete lenses or as brine-saturated sediment. The cryopeg brines of this study contained high concentrations of bacterial cells, dissolved and particulate organic carbon and extracellular polysaccharides relative to sea-ice brines (middle). Bacterial genomes in cryopeg brines, represented by a generic cell and neighbor (right), were enriched in many accessory features including two-component regulatory and toxin-antitoxin (TA) systems, diverse types of ABC transporters, storage granules, and genes for flagellar assembly. An enrichment of genes for mobile elements, including transposases, transposable elements (TE), and genes exclusively present on plasmids, indicate greater genetic plasticity, while enriched type VI bacterial secretion systems and microcin C transporters attest to complex social interactions, both competitive and beneficial to the community. Canonical genes relevant for cold and salt stress were present in both communities (not shown). Scale bars are estimates for comparative purposes between panels.

Similar articles

Cited by

References

    1. Alm E., Huang K., Arkin A. (2006). The evolution of two-component systems in bacteria reveals different strategies for niche adaptation. PLoS Comput. Biol. 2:e143. 10.1371/journal.pcbi.0020143 - DOI - PMC - PubMed
    1. Andersen K. S., Kirkegaard R. H., Karst S. M., Albertsen M. (2018). ampvis2: An R package to analyse and visualise 16S rRNA amplicon data. bioRxiv 2018:299537. 10.1101/299537 - DOI
    1. Aziz R. K., Breitbart M., Edwards R. A. (2010). Transposases are the most abundant, most ubiquitous genes in nature. Nucleic Acids Res. 38 4207–4217. 10.1093/nar/gkq140 - DOI - PMC - PubMed
    1. Baraúna R., Freitas D., Pinheiro J., Folador A., Silva A. (2017). A proteomic perspective on the bacterial adaptation to cold: Integrating OMICs data of the psychrotrophic bacterium Exiguobacterium antarcticum B7. Proteomes 5 9–20. 10.3390/proteomes5010009 - DOI - PMC - PubMed
    1. Bennett P. M. (2004). Genome plasticity: insertion sequence elements, transposons and integrons, and DNA rearrangement. Methods Mol. Biol. 266 71–113. 10.1385/1-59259-763-7:071 - DOI - PubMed

LinkOut - more resources