. 2021 Jul 22:12:641206.
doi: 10.3389/fimmu.2021.641206. eCollection 2021.

Receptor Tyrosine Kinase Inhibitor Sunitinib as Novel Immunotherapy to Inhibit Myeloid-Derived Suppressor Cells for Treatment of Endometriosis

Affiliations

Receptor Tyrosine Kinase Inhibitor Sunitinib as Novel Immunotherapy to Inhibit Myeloid-Derived Suppressor Cells for Treatment of Endometriosis

Ying He et al. Front Immunol. .

Abstract

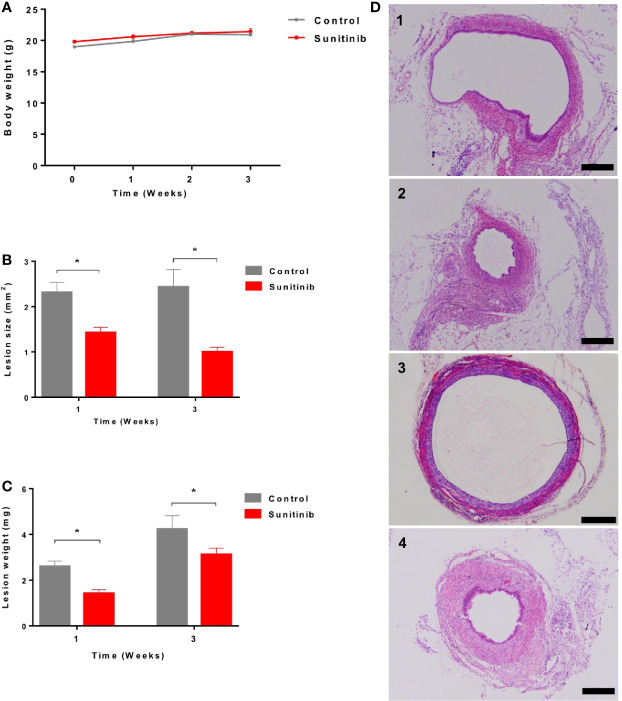
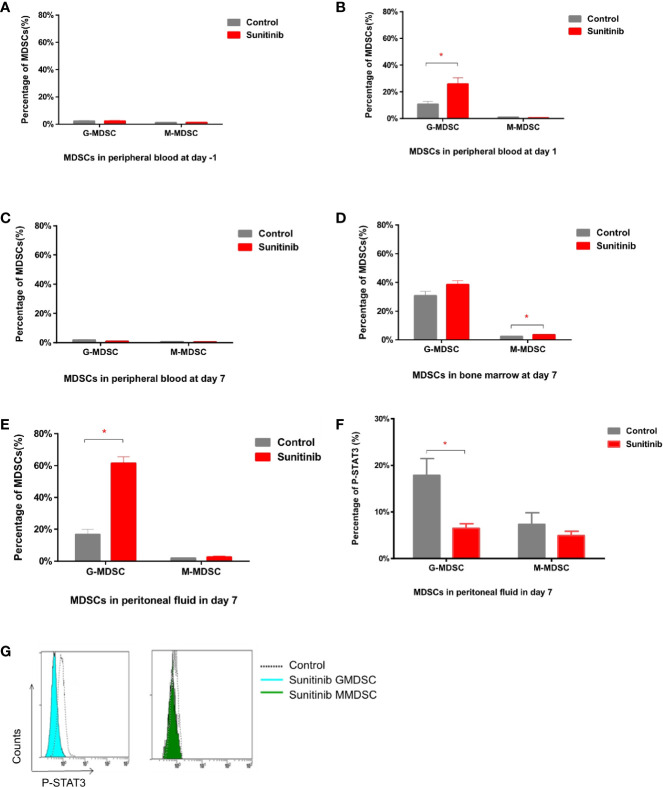
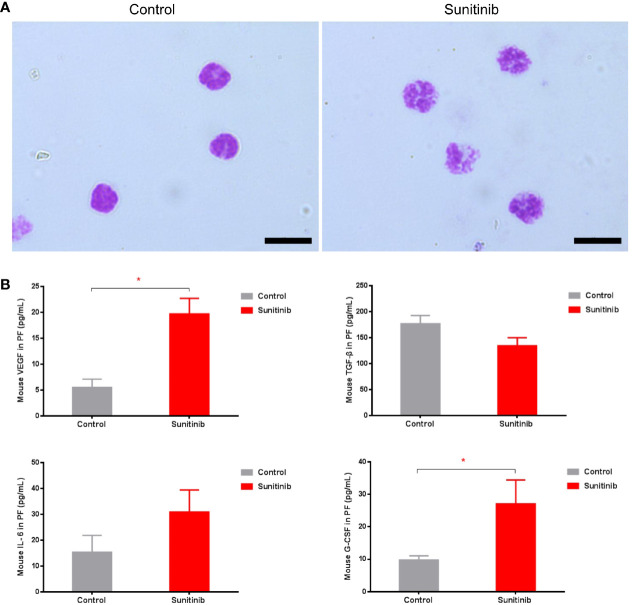
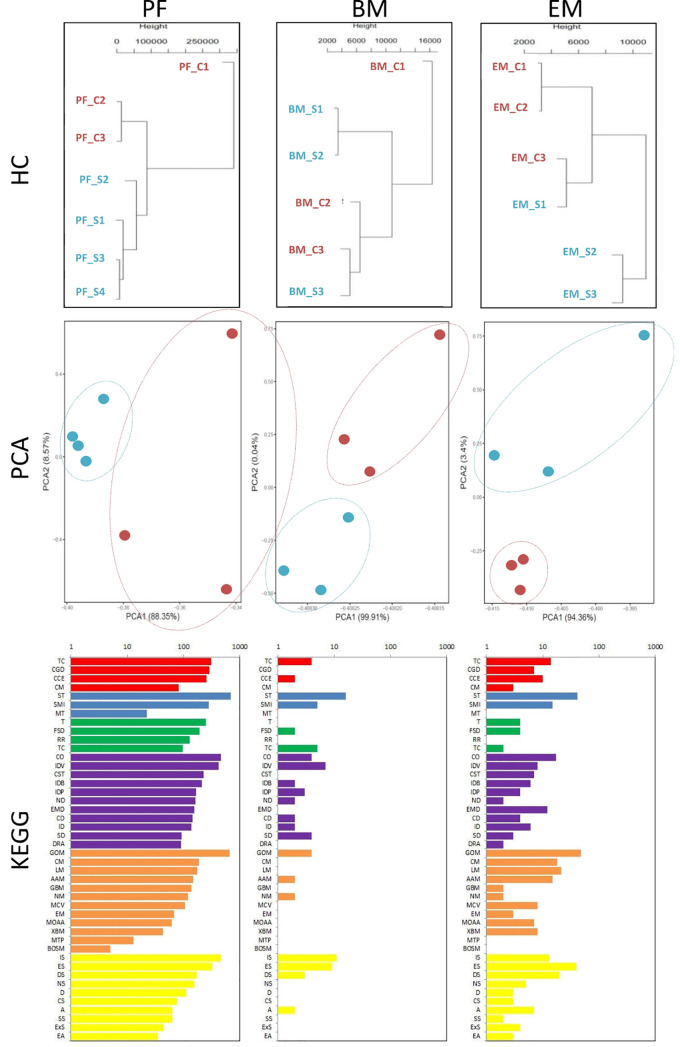
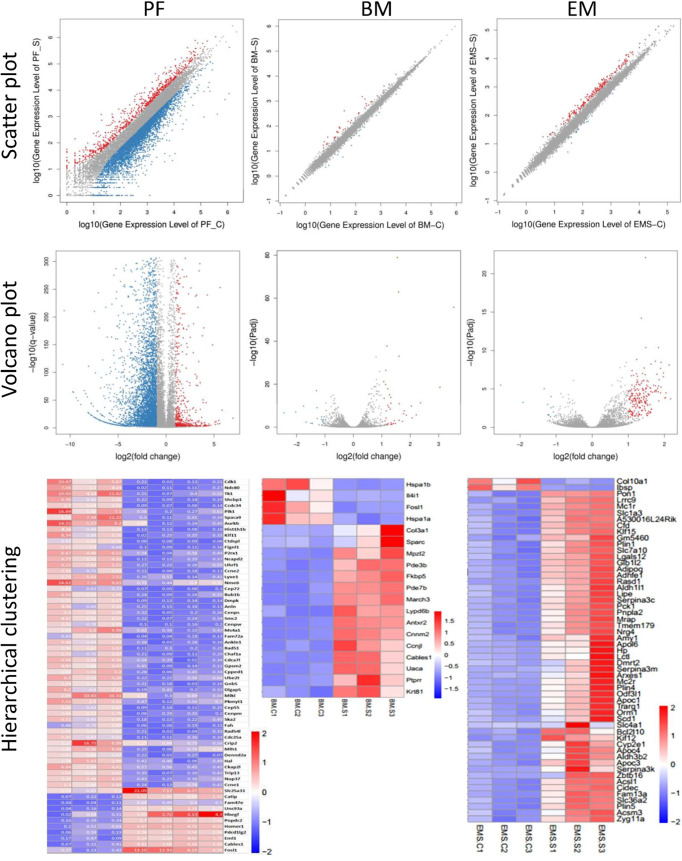
Endometriosis is a common, benign, and hormone-dependent gynaecological disorder that displays altered immunoinflammatory profiles. Myeloid-derived suppressor cells (MDSCs) suppressed immunosurveillance in endometriosis in human and mouse model. Receptor tyrosine kinase inhibitor Sunitinib can induce MDSC apoptosis and suppress the progression of cancer. However, the effects of Sunitinib on MDSCs in endometriosis and the underlying mechanism are not clear. In this study, we employed an animal study of the endometriosis model in mice for treatment of Sunitinib. After syngeneic endometrium transplantation and treatment, endometriotic lesion volume, weight, and histology were compared. Peritoneal fluid, peripheral blood, and bone marrow MDSC subsets and their molecular signaling were monitored by flow cytometry. Peritoneal cytokines were assayed by ELISA. The gene expression profiles of isolated CD11b+Ly6G+Ly6Clo cells were studied by RNA sequencing. We found that Sunitinib significantly decreased the endometriotic lesion size and weight after 1 and 3 weeks, and decreased p-STAT3 activation in MDSCs after 1 week of treatment. In the first week, Sunitinib specifically increased the G-MDSC population in peritoneal fluid but the isolated CD11b+Ly6G+Ly6Clo MDSCs after Sunitinib treatment were presented as mature polynuclear MDSCs, while the control group had immature mononuclear MDSCs. Importantly, we found Sunitinib differentially suppressed gene expressions of immunosuppressive function and differentiation in peritoneal G-MDSCs. Apelin signaling pathway associated genes and inflammation related genes were upregulated, and amino acid metabolism regulator genes were downregulated in bone marrow G-MDSCs. For endometriotic lesions, the PPARG gene governing glucose metabolism and fatty acid storage, which is important for the development of endometriosis was upregulated. In conclusion, Sunitinib inhibited endometriotic lesions, by promoting peritoneal fluid MDSCs maturation and inhibiting the immunosuppressive function. These findings suggest that Sunitinib changed the immune microenvironment and inhibited the development of endometriosis, which has potential therapeutic effects as novel immunotherapy to promote MDSCs maturation, differentiation, and metabolism for the treatment of endometriosis.

Keywords: Sunitinib; endometriosis; gene expressions; immunosuppression; myeloid-derived suppressor cells.


Conflict of interest statement

The authors declare that the research was conducted in the absence of any commercial or financial relationships that could be construed as a potential conflict of interest.

Figures

Figure 1
Figure 1
Effects of Sunitinib on endometriosis lesions. (A) Changes to body weights during control and Sunitinib treatment. (B) Size of the endometriotic lesions after 1 and 3 weeks of treatment. (C) Weight of the endometriotic lesions after 1 and 3 weeks of treatment. Data are expressed as the mean ± SEM from 10 animals in each group, *p < 0.05. (D) Representative histology sections of the endometriotic lesions from control and Sunitinib groups. D1: endometriotic lesion after 1 week of control treatment; D2: endometriotic lesion after 1 week of Sunitinib treatment; D3: endometriotic lesion after 3 weeks of control treatment; D4: endometriotic lesion after 3 weeks of Sunitinib treatment, Scale bar: 200μm.
Figure 2
Figure 2
MDSC subsets in peritoneal blood, bone marrow, and peripheral fluid after Sunitinib treatment. (A–C) G-MDSC (defined as CD11b+ Ly6G+ Ly6Clo) and M-MDSC (defined as CD11b+ Ly6G- Ly6Chi) percentage in peripheral blood 1 day before as baseline (day -1), after 1 day (day 1) and 7 days (day 7) of control and Sunitinib treatment. (D, E) G-MDSC and M-MDSC percentage in the bone marrow and peritoneal fluid after 7 days of treatment. (F) Percentage of P-STAT3 in peritoneal G-MDSC and M-MDSC after 7 days of treatment. (G) Representative flow cytometric analyses of intracellular levels of p-Stat3 in peritoneal MDSCs. Data are expressed as the mean ± SEM from 5 animals in each group, *p < 0.05.
Figure 3
Figure 3
Characteristics of G-MDSC cells and peritoneal cytokine after Sunitinib treatment. (A) Representative Wright-Giemsa staining of isolated peritoneal CD11b+ Ly6G+ G-MDSCs from at least 5 animals in each group after 7 days of treatment, Magnification 1000× Oil, and Scale bar 10μm. (B) Peritoneal cytokines VEGF, G-CSF, IL-6, TGF-β after 7 days of treatment. Data are expressed as the mean ± SEM from 10 animals in each group, *P < 0.05.
Figure 4
Figure 4
Transcriptomic characteristics of G-MDSC cells and endometriotic lesions. (Upper and middle panels) Hierarchical clustering (HC) and principal component analysis (PCA) of peritoneal (PF) and bone marrow (BM) CD11b+ Ly6G+ G-MDSCs and endometriosis lesions (EM) from 3-4 animals in each group after 7 days of Sunitinib treatment (S in blue labels and dots) versus control (C in red labels and dots). For HC, the closer the samples were to each other, the more similar the expression level was. For PCA, the first and second most coordinated components are shown, similar transcriptomic profiles were grouped by circles. (Lower panels) KEGG Pathway functional enrichment. X axis represents the number of DEG, Y axis represents the functional classification of KEGG according to 7 branches for KEGG pathways: Cellular Processes (red), Environmental Information Processing (blue), Genetic Information Processing (green), Human Disease (purple), Metabolism (orange), and Organismal Systems (yellow). TC, Transport and catabolism; CGD, Cell growth and death; CCE, Cellular community—eukaryotes; CM, Cell motility; ST, Signal transduction; SMI, Signaling molecules and interaction; MT, membrane transport; T, translation; TS, transcription; CO, Cancer—overview; IDV, infectious diseases—viral; CST, Cancers—specific types; IDB, infectious diseases—bacterial; IDP; infectious diseases—parasitic; ND, neurodegenerative diseases; EMD, endocrine and metabolic diseases; CD, cardiovascular diseases; ID, Immune diseases; SD, substance dependence; DRA, drug resistance—antineoplastic; GOM, Global and overview maps; CM, carbohydrate metabolism; LM, Lipd metabolism; AAM, Amnio acid metabolism; Glycan biosynthesis and metabolism; NM, nucleotide metabolism; MCV, Metabolism of cofactors and vitamins; EM, energy metabolism; MOAA, Metabolism of other amnio acids; XBM, Xenobiotics biodegradation and metabolism; MTP, Metabolism of tepenoids and polyketides; BOSM, Biosynthesis of other secondary metabolires; IS, Immune system; ES, Endocrine system; DS, Digestive system; NS, Nervous system; D, Development; CS, Cirrculatory system; A, Aging; SS, Sensory system; ExS, Excretory system; EA, Environmental adaptation.
Figure 5
Figure 5
Differential gene expression of G-MDSC cells and endometriotic lesions. (Upper panels) Scatter plots of peritoneal (PF) and bone marrow (BM) CD11b+ Ly6G+ G-MDSCs and endometriosis lesions (EM) from 3-4 animals in each group after 7 days of Sunitinib treatment (S) versus control (C). X Y axis represents log10 transformed gene expression level, red color represents the up-regulated genes, the blue color represents the down-regulated genes, gray color represents the non-DEGs. (Middle panels) Volcano plots of peritoneal (PF) and bone marrow (BM) CD11b+ Ly6G+ G-MDSCs and endometriosis lesions (EM) from 3-4 animals in each group after 7 days of Sunitinib treatment (S) versus control (C). X axis represents log2 transformed fold change. Y axis represents -log10 transformed significance. Red points represent up-regulated DEGs. Blue points represent down-regulated DEGs. Gray points represent non-DEGs. (Lower panels) Heat map of peritoneal (PF) and bone marrow (BM) CD11b+ Ly6G+ G-MDSCs and endometriosis lesions (EM) from 3-4 animals in each group after 7 days of Sunitinib treatment (S) versus control (C) by hierarchical clustering. X axis represents the sample. Y axis represents the DEGs. The color represents the log2 transformed gene expression level. The dark color means the high expression level while the light color means the low expression level. The most significant differentially expressed genes (p < 0.05, padj < 0.05 or q < 0.01, and also fold changes > 1.5-5) are shown. The full list and statistical analysis are available in corresponding Supplementary Tables 13 .

Similar articles

Cited by

References

    1. Eskenazi B, Warner ML. Epidemiology of Endometriosis. Obstet Gynecol Clin North Am (1997) 24:235–58. 10.1016/S0889-8545(05)70302-8 - DOI - PubMed
    1. Holoch KJ, Lessey BA. Endometriosis and Infertility. Clin Obstet Gynecol (2010) 53:429–38. 10.1097/GRF.0b013e3181db7d71 - DOI - PubMed
    1. Zhang T, Zhou J, Man GCW, Leung KT, Liang B, Xiao B, et al. . MDSCs Drive the Process of Endometriosis by Enhancing Angiogenesis and Are a New Potential Therapeutic Target. Eur J Immunol (2018) 48(6):1059–73. 10.1002/eji.201747417 - DOI - PMC - PubMed
    1. Ahn SH, Monsanto SP, Miller C, Singh SS, Thomas R, Tayade C. Pathophysiology and Immune Dysfunction in Endometriosis. BioMed Res Int (2015) 2015:795976. 10.1155/2015/795976 - DOI - PMC - PubMed
    1. Macer ML, Taylor HS. Endometriosis and Infertility: A Review of the Pathogenesis and Treatment of Endometriosis-Associated Infertility. Obstet Gynecol Clin (2012) 39:535–49. 10.1016/j.ogc.2012.10.002 - DOI - PMC - PubMed

Publication types