

Analysis of Interleukin-1 Signaling Alterations of Colon Adenocarcinoma Identified Implications for Immunotherapy
- PMID: 34367132
- PMCID: PMC8344046
- DOI: 10.3389/fimmu.2021.665002
Analysis of Interleukin-1 Signaling Alterations of Colon Adenocarcinoma Identified Implications for Immunotherapy
Abstract
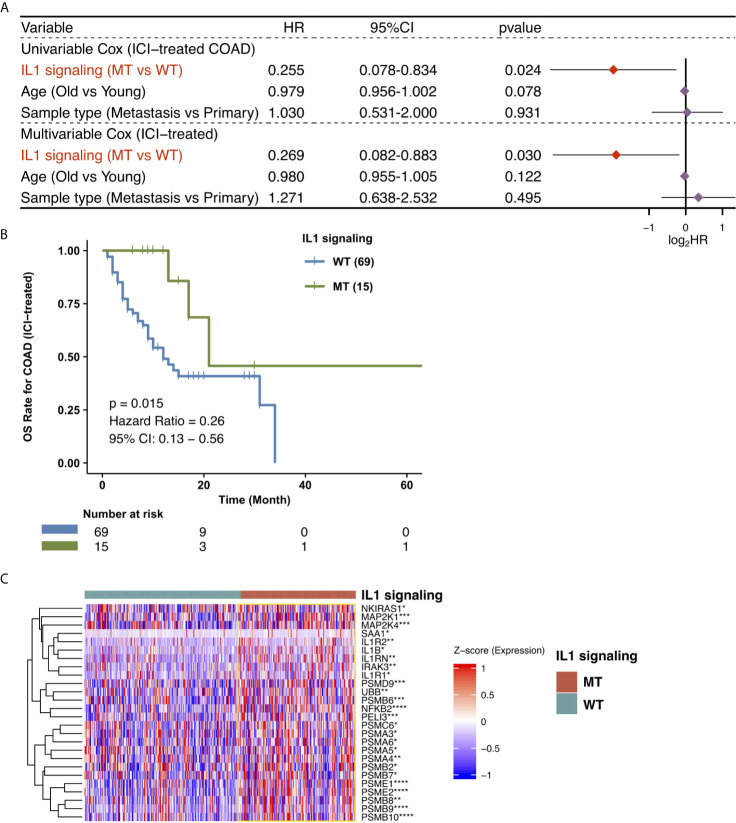
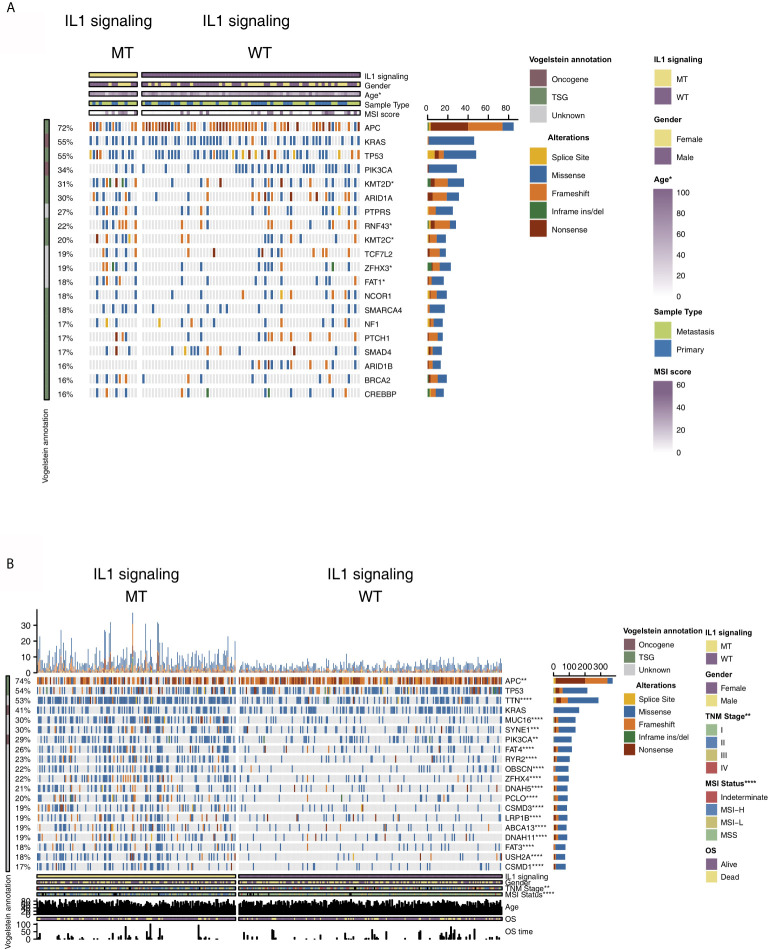
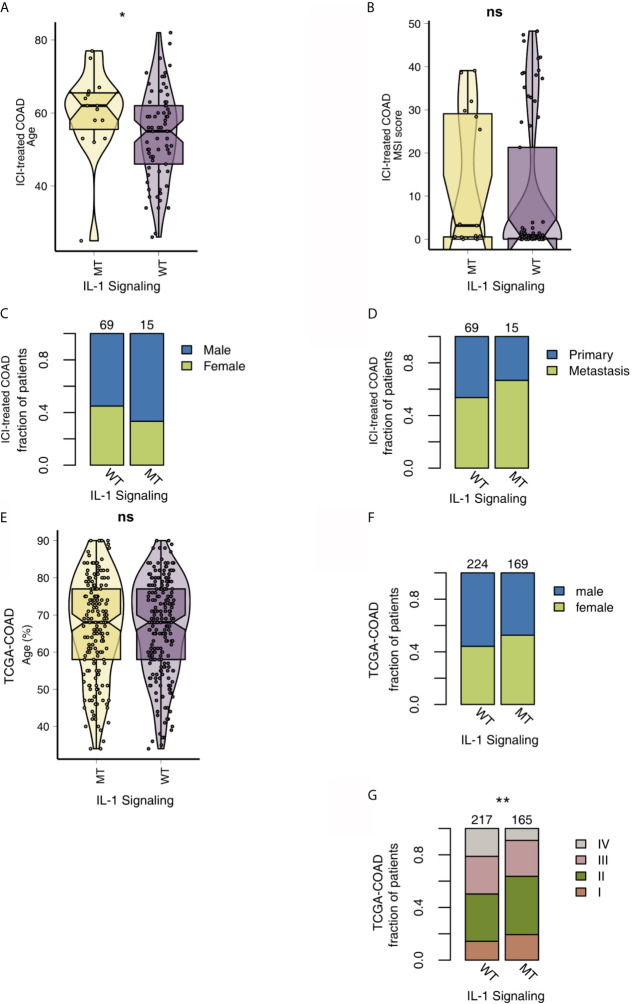
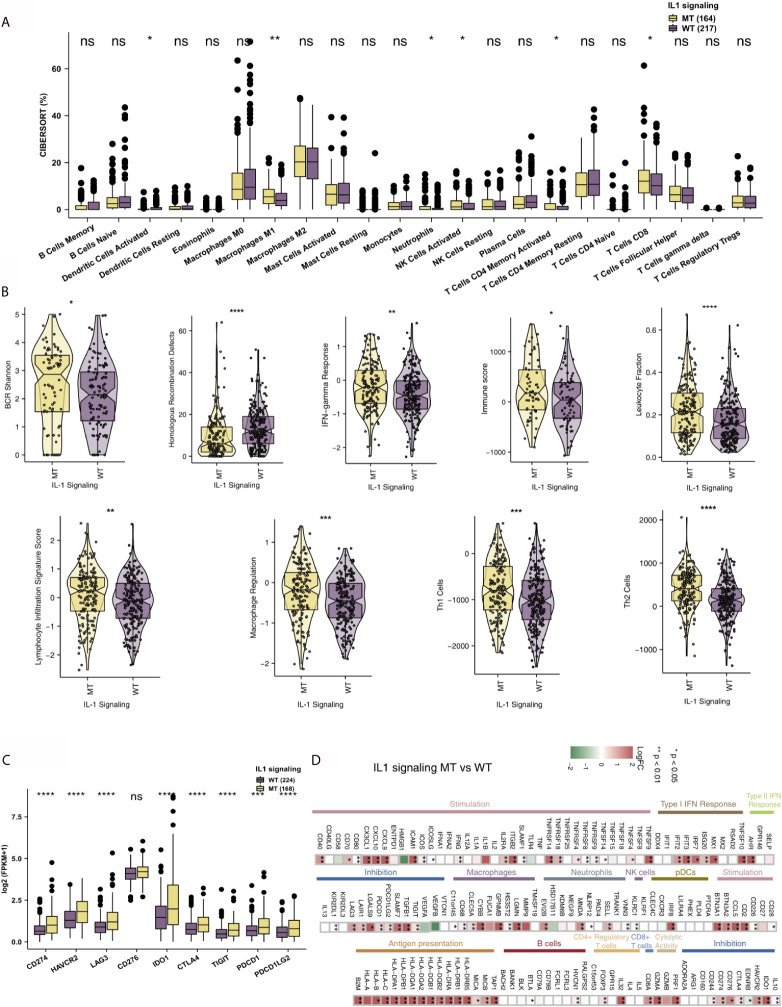
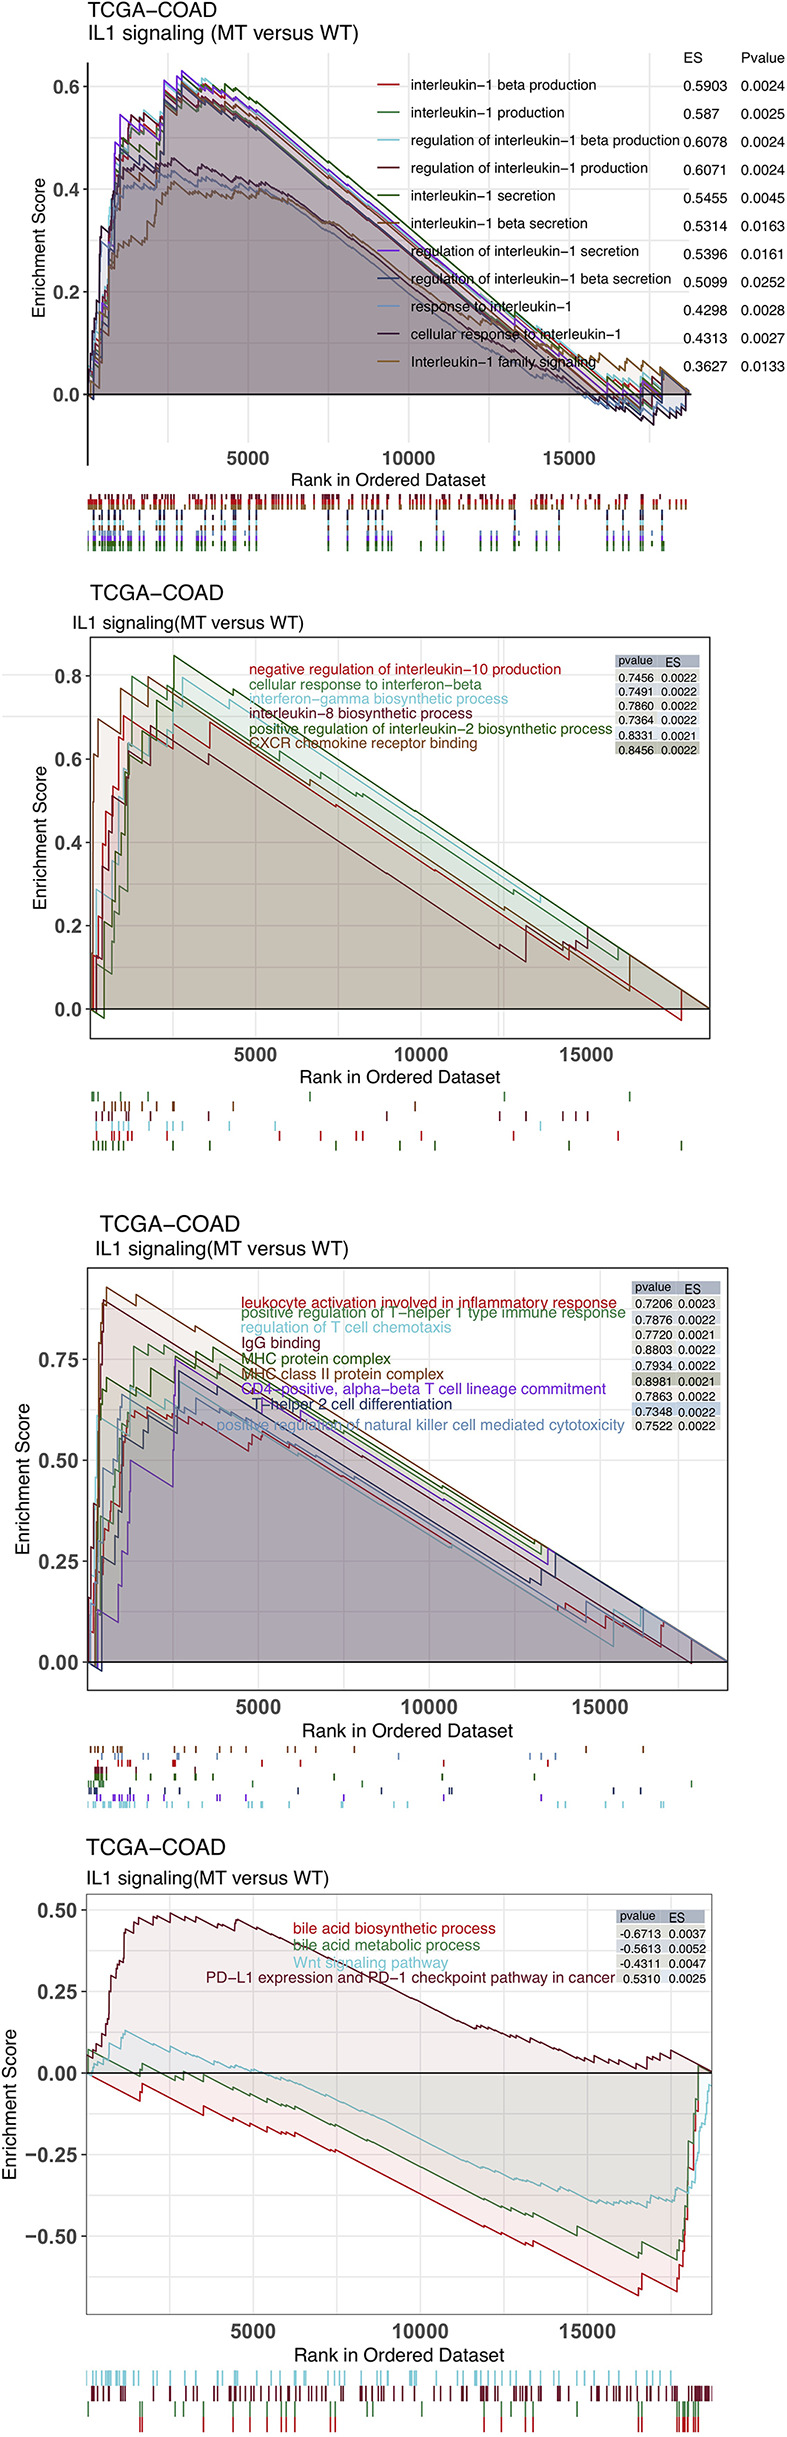
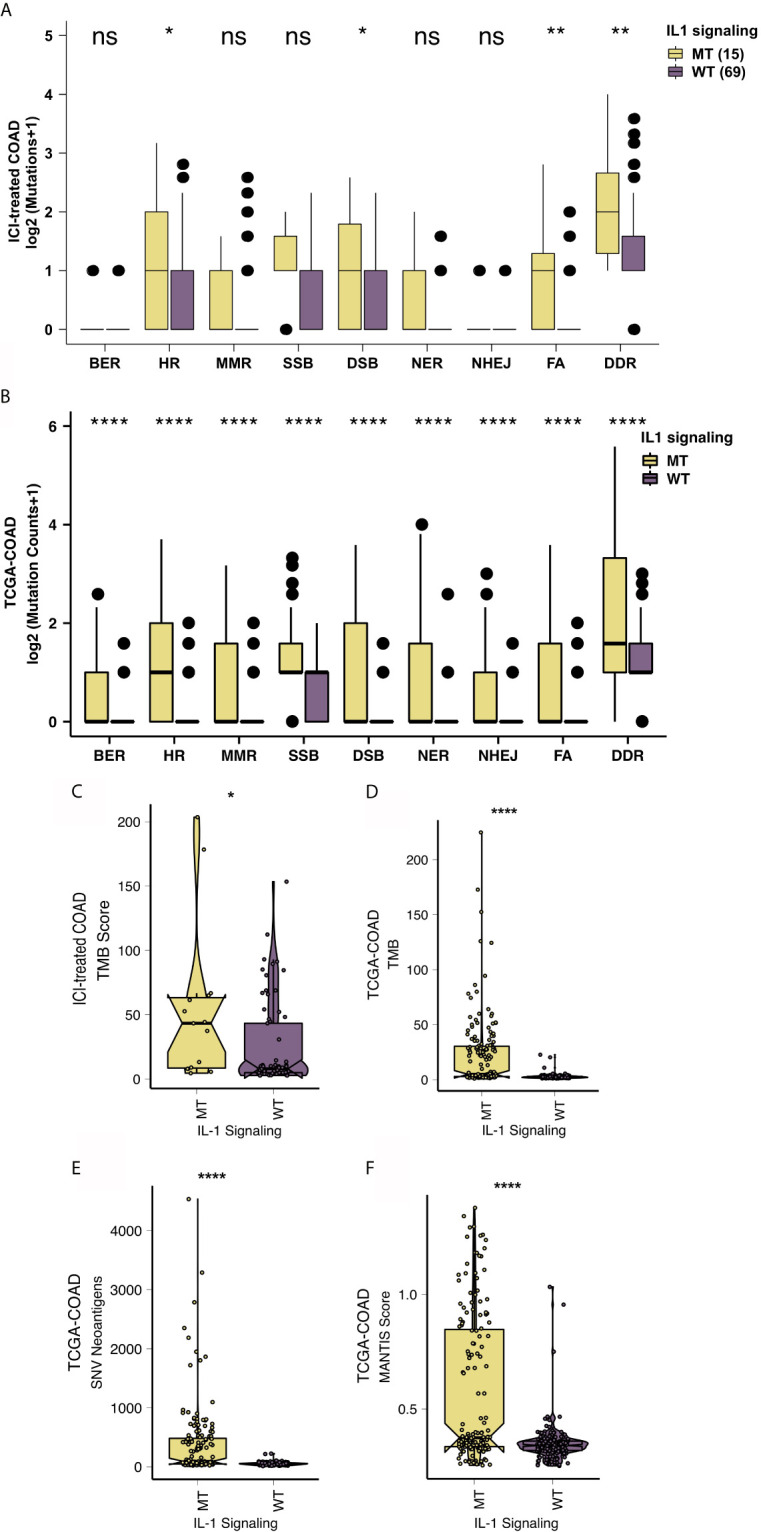
Immune checkpoint inhibitors (ICIs) have made breakthrough progress in the treatment of various malignant tumors. However, only some patients receiving ICIs obtain long-lasting clinical effects, and some patients still do not achieve remission. Improving the treatment benefits of this part of the population has become a concern of clinicians. IL-1 signaling plays an important role in the tumor microenvironment (TME). However, the relationship between the IL-1 signaling mutation status and the prognosis of colon adenocarcinoma (COAD) patients receiving ICIs has not been reported. We downloaded the data of a COAD cohort receiving ICIs, including prognostic data and mutation data. Additionally, we downloaded the data of a COAD cohort from The Cancer Genome Atlas (TCGA) database, including clinical data, expression data and mutation data. Gene set enrichment analysis (GSEA) was used to assess differences in the activity of some key physiological pathways between the IL-1 signaling mutated-type (IL-1-MT) and IL-1 signaling wild-type (IL-1-WT) groups. The CIBERSORT algorithm was used to evaluate the contents of immune cells in the TME of COAD patients. The multivariate Cox regression model results suggested that IL-1-MT can be used as an independent predictor of a better prognosis in COAD patients receiving ICIs (P = 0.03, HR = 0.269, 95% CI: 0.082-0.883). Additionally, IL-1-MT COAD patients had significantly longer overall survival (OS) (log-rank P = 0.015). CIBERSORT analysis showed that the IL-1-MT group had high infiltration levels of activated dendritic cells (DCs), M1 macrophages, neutrophils, activated natural killer (NK) cells, activated CD4+ memory T cells and CD8+ T cells. Similarly, the IL-1-MT group had significantly upregulated immunogenicity, including in terms of the tumor mutation burden (TMB), neoantigen load (NAL) and number of mutations in DNA damage repair (DDR) signaling. GSEA showed that the IL-1-MT group was highly enriched in the immune response and proinflammatory mediators. Additionally, the expression levels of immune-related genes, immune checkpoint molecules and immune-related signatures were significantly higher in the IL-1-MT group than in the IL-1-WT group. IL-1-MT may be an independent predictor of a good prognosis in COAD patients receiving ICIs, with significantly longer OS in IL-1-MT COAD patients. Additionally, IL-1-MT was associated with significantly increased immunogenicity, activated immune cell and inflammatory mediator levels and immune response-related scores.
Keywords: IL-1; colon adenocarcinoma; immune checkpoint inhibitors; prognosis; tumor microenvironment.
Copyright © 2021 Zhou, Liu, Xiang, Wang, Wang, Xia, Chen and Bai.
Conflict of interest statement
The authors declare that the research was conducted in the absence of any commercial or financial relationships that could be construed as a potential conflict of interest.
Figures
Similar articles
-
Comprehensive Analysis Identifies PI3K/Akt Pathway Alternations as an Immune-Related Prognostic Biomarker in Colon Adenocarcinoma Patients Receiving Immune Checkpoint Inhibitor Treatment.J Immunol Res. 2022 Jun 6;2022:8179799. doi: 10.1155/2022/8179799. eCollection 2022. J Immunol Res. 2022. PMID: 35707003 Free PMC article.
-
Exploration of the relationship between tumor mutation burden and immune infiltrates in colon adenocarcinoma.Int J Med Sci. 2021 Jan 1;18(3):685-694. doi: 10.7150/ijms.51918. eCollection 2021. Int J Med Sci. 2021. PMID: 33437203 Free PMC article.
-
To explore the prognostic characteristics of colon cancer based on tertiary lymphoid structure-related genes and reveal the characteristics of tumor microenvironment and drug prediction.Sci Rep. 2024 Jun 12;14(1):13555. doi: 10.1038/s41598-024-64308-w. Sci Rep. 2024. PMID: 38867070 Free PMC article.
-
Identify potential prognostic indicators and tumor-infiltrating immune cells in pancreatic adenocarcinoma.Biosci Rep. 2022 Feb 25;42(2):BSR20212523. doi: 10.1042/BSR20212523. Biosci Rep. 2022. PMID: 35083488 Free PMC article. Review.
-
Constructing and validating a risk model based on neutrophil-related genes for evaluating prognosis and guiding immunotherapy in colon cancer.J Gene Med. 2024 Apr;26(4):e3684. doi: 10.1002/jgm.3684. J Gene Med. 2024. PMID: 38618694 Review.
Cited by
-
Risk stratification and prognosis prediction based on inflammation-related gene signature in lung squamous carcinoma.Cancer Med. 2023 Feb;12(4):4968-4980. doi: 10.1002/cam4.5190. Epub 2022 Sep 3. Cancer Med. 2023. PMID: 36056909 Free PMC article.
-
SIGLEC1 has the potential to be an immune-related prognostic indicator in colon adenocarcinoma: a study based on transcriptomic data and Mendelian randomization analysis.Discov Oncol. 2025 Mar 15;16(1):324. doi: 10.1007/s12672-025-02093-2. Discov Oncol. 2025. PMID: 40088346 Free PMC article.
References
Publication types
MeSH terms
Substances
LinkOut - more resources
Full Text Sources
Research Materials