

Kaempferol Alleviates Murine Experimental Colitis by Restoring Gut Microbiota and Inhibiting the LPS-TLR4-NF-κB Axis
- PMID: 34367139
- PMCID: PMC8339999
- DOI: 10.3389/fimmu.2021.679897
Kaempferol Alleviates Murine Experimental Colitis by Restoring Gut Microbiota and Inhibiting the LPS-TLR4-NF-κB Axis
Abstract
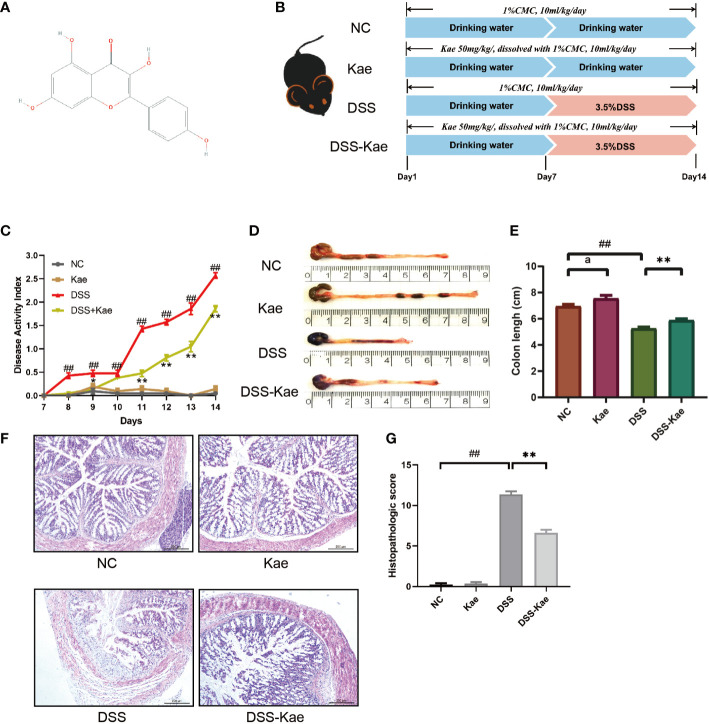
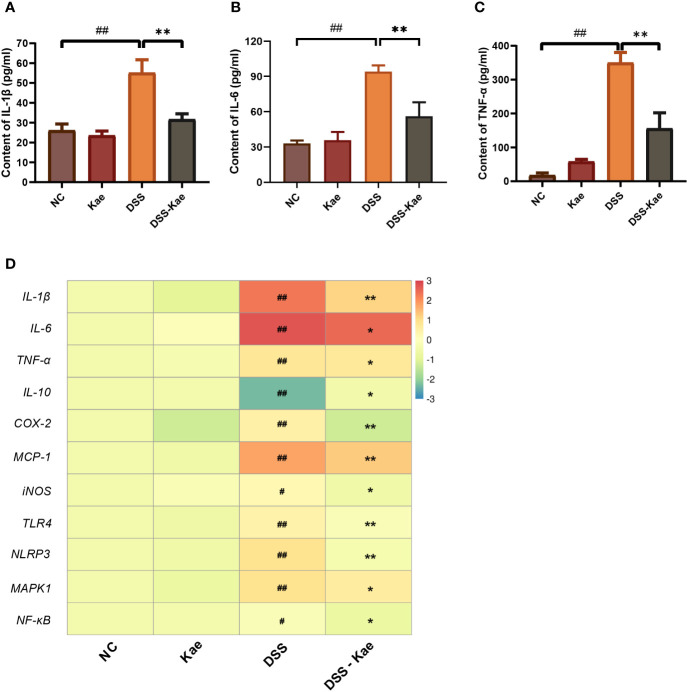
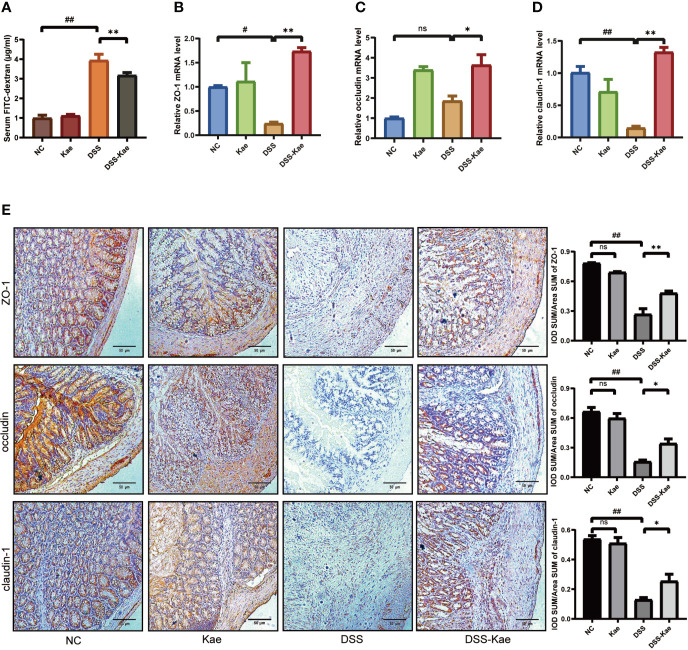
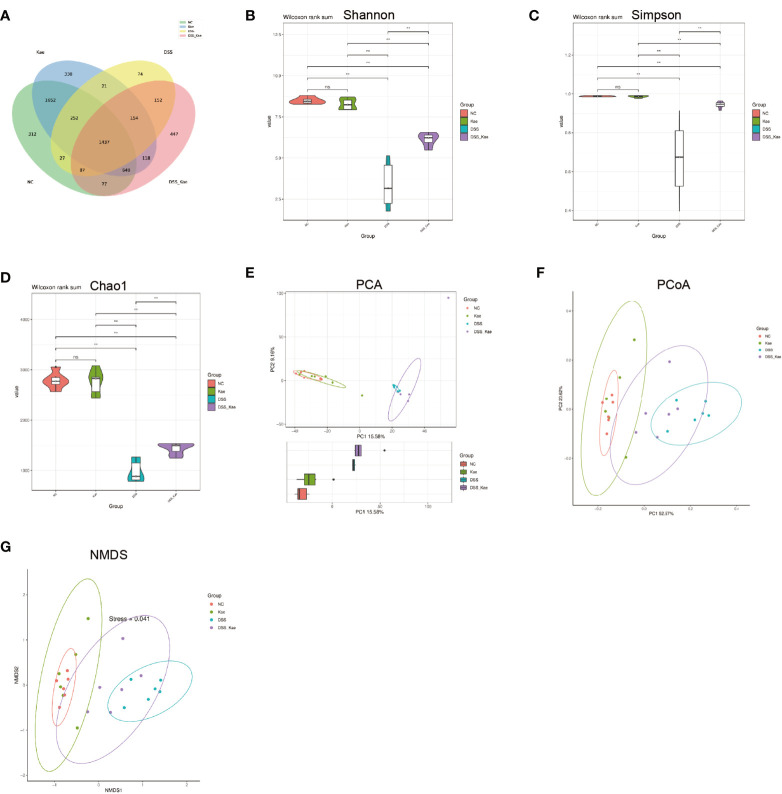
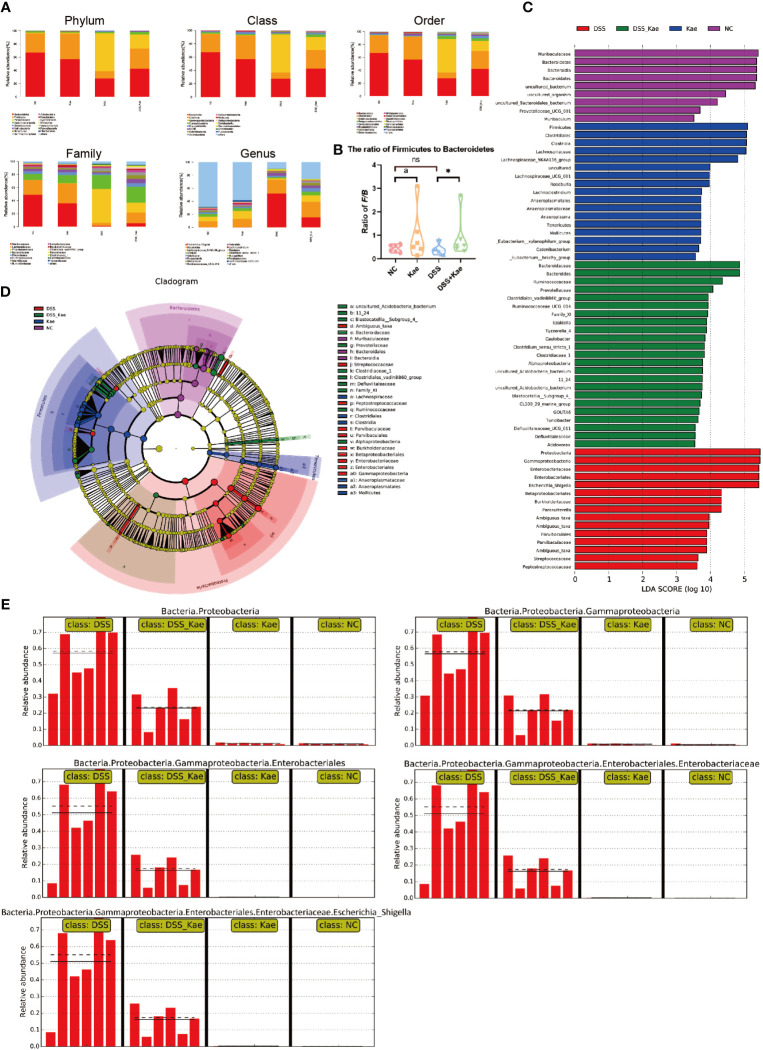
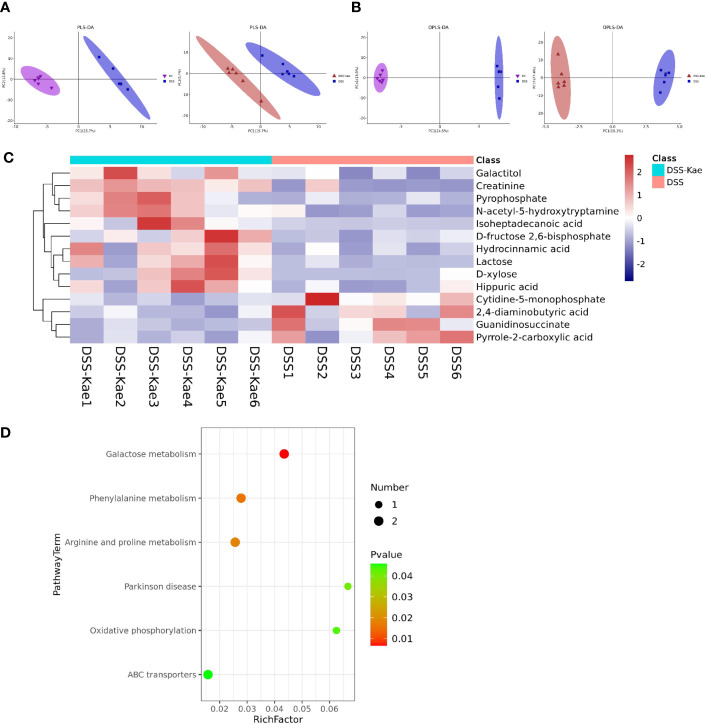
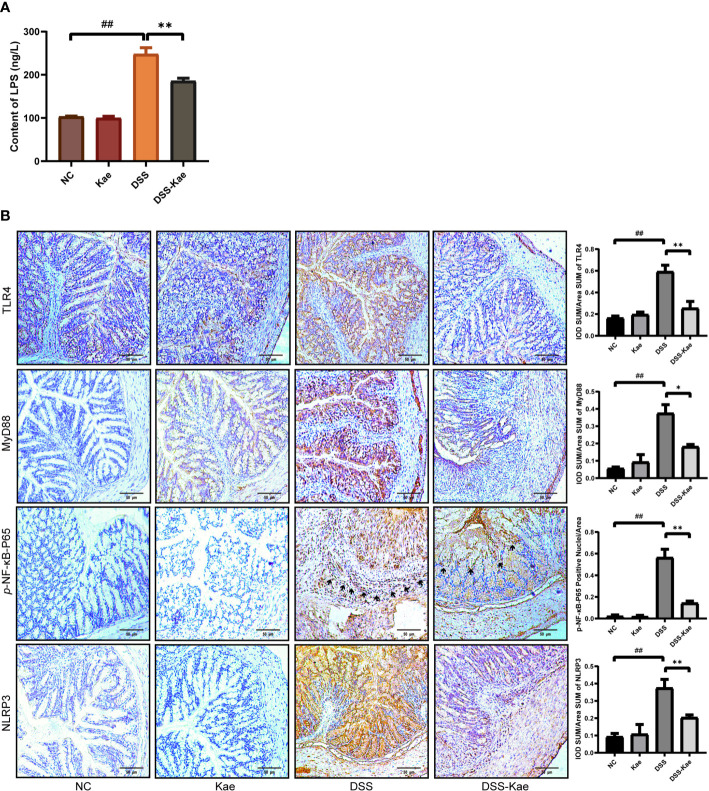
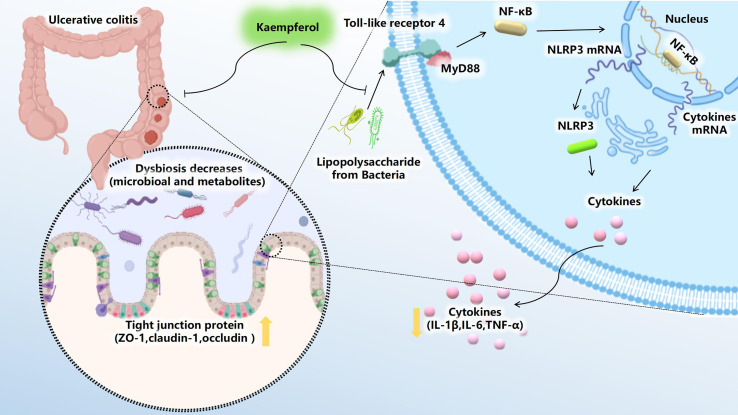
Intestinal microbiota dysbiosis is an established characteristic of ulcerative colitis (UC). Regulating the gut microbiota is an attractive alternative UC treatment strategy, considering the potential adverse effects of synthetic drugs used to treat UC. Kaempferol (Kae) is an anti-inflammatory and antioxidant flavonoid derived from a variety of medicinal plants. In this study, we determined the efficacy and mechanism of action of Kae as an anti-UC agent in dextran sulfate sodium (DSS)-induced colitis mice. DSS challenge in a mouse model of UC led to weight loss, diarrhea accompanied by mucous and blood, histological abnormalities, and shortening of the colon, all of which were significantly alleviated by pretreatment with Kae. In addition, intestinal permeability was shown to improve using fluorescein isothiocyanate (FITC)-dextran administration. DSS-induced destruction of the intestinal barrier was also significantly prevented by Kae administration via increases in the levels of ZO-1, occludin, and claudin-1. Furthermore, Kae pretreatment decreased the levels of IL-1β, IL-6, and TNF-α and downregulated transcription of an array of inflammatory signaling molecules, while it increased IL-10 mRNA expression. Notably, Kae reshaped the intestinal microbiome by elevating the Firmicutes to Bacteroidetes ratio; increasing the linear discriminant analysis scores of beneficial bacteria, such as Prevotellaceae and Ruminococcaceae; and reducing the richness of Proteobacteria in DSS-challenged mice. There was also an evident shift in the profile of fecal metabolites in the Kae treatment group. Serum LPS levels and downstream TLR4-NF-κB signaling were downregulated by Kae supplementation. Moreover, fecal microbiota transplantation from Kae-treated mice to the DSS-induced mice confirmed the effects of Kae on modulating the gut microbiota to alleviate UC. Therefore, Kae may exert protective effects against colitis mice through regulating the gut microbiota and TLR4-related signaling pathways. This study demonstrates the anti-UC effects of Kae and its potential therapeutic mechanisms, and offers novel insights into the prevention of inflammatory diseases using natural products.
Keywords: NF-κB; TLR4; gut microbiota; kaempferol; lipopolysaccharide; ulcerative colitis.
Copyright © 2021 Qu, Li, Xu, Zhao, Wu, Wang and Xie.
Conflict of interest statement
The authors declare that the research was conducted in the absence of any commercial or financial relationships that could be construed as a potential conflict of interest.
Figures

Similar articles
-
Ganluyin ameliorates DSS-induced ulcerative colitis by inhibiting the enteric-origin LPS/TLR4/NF-κB pathway.J Ethnopharmacol. 2022 May 10;289:115001. doi: 10.1016/j.jep.2022.115001. Epub 2022 Jan 24. J Ethnopharmacol. 2022. PMID: 35085745
-
Astragalin Attenuates Dextran Sulfate Sodium (DSS)-Induced Acute Experimental Colitis by Alleviating Gut Microbiota Dysbiosis and Inhibiting NF-κB Activation in Mice.Front Immunol. 2020 Sep 15;11:2058. doi: 10.3389/fimmu.2020.02058. eCollection 2020. Front Immunol. 2020. PMID: 33042117 Free PMC article.
-
Pinocembrin alleviates ulcerative colitis in mice via regulating gut microbiota, suppressing TLR4/MD2/NF-κB pathway and promoting intestinal barrier.Biosci Rep. 2020 Jul 31;40(7):BSR20200986. doi: 10.1042/BSR20200986. Biosci Rep. 2020. PMID: 32687156 Free PMC article.
-
Fucoidan as a therapeutic agent for ulcerative colitis: mechanisms of action and modulation of the gut microbiota.Front Cell Infect Microbiol. 2025 Jul 10;15:1626614. doi: 10.3389/fcimb.2025.1626614. eCollection 2025. Front Cell Infect Microbiol. 2025. PMID: 40708752 Free PMC article. Review.
-
Research Progress in Ulcerative Colitis: The Role of Traditional Chinese Medicine on Gut Microbiota and Signaling Pathways.Am J Chin Med. 2024;52(8):2277-2336. doi: 10.1142/S0192415X24500885. Epub 2024 Dec 31. Am J Chin Med. 2024. PMID: 39756829 Review.
Cited by
-
Cell-cell communications: new insights into targeting efficacy of phytochemical adjuvants on tight junctions and pathophysiology of various malignancies.J Cell Commun Signal. 2023 Sep;17(3):457-467. doi: 10.1007/s12079-022-00706-x. Epub 2022 Nov 24. J Cell Commun Signal. 2023. PMID: 36427132 Free PMC article. Review.
-
Hinesol attenuates DSS-induced ulcerative colitis through the suppression of Src-mediated NF-κB and chemokine signaling pathway.Cell Biochem Biophys. 2024 Sep;82(3):2747-2757. doi: 10.1007/s12013-024-01391-w. Epub 2024 Jul 8. Cell Biochem Biophys. 2024. PMID: 38976102
-
Natural products modulate NLRP3 in ulcerative colitis.Front Pharmacol. 2023 Oct 2;14:1265825. doi: 10.3389/fphar.2023.1265825. eCollection 2023. Front Pharmacol. 2023. PMID: 37849728 Free PMC article. Review.
-
Baohe pill decoction for diarrhea induced by high-fat and high-protein diet is associated with the structure of lactase-producing bacterial community.Front Cell Infect Microbiol. 2022 Aug 26;12:1004845. doi: 10.3389/fcimb.2022.1004845. eCollection 2022. Front Cell Infect Microbiol. 2022. PMID: 36093186 Free PMC article.
-
Combination of Youhua Kuijie Prescription and sulfasalazine can alleviate experimental colitis via IL-6/JAK2/STAT3 pathway.Front Pharmacol. 2024 Sep 10;15:1437503. doi: 10.3389/fphar.2024.1437503. eCollection 2024. Front Pharmacol. 2024. PMID: 39318778 Free PMC article.
References
Publication types
MeSH terms
Substances
LinkOut - more resources
Full Text Sources