

Cholesterol-Ester Transfer Protein Alters M1 and M2 Macrophage Polarization and Worsens Experimental Elastase-Induced Pulmonary Emphysema
- PMID: 34367144
- PMCID: PMC8334866
- DOI: 10.3389/fimmu.2021.684076
Cholesterol-Ester Transfer Protein Alters M1 and M2 Macrophage Polarization and Worsens Experimental Elastase-Induced Pulmonary Emphysema
Abstract
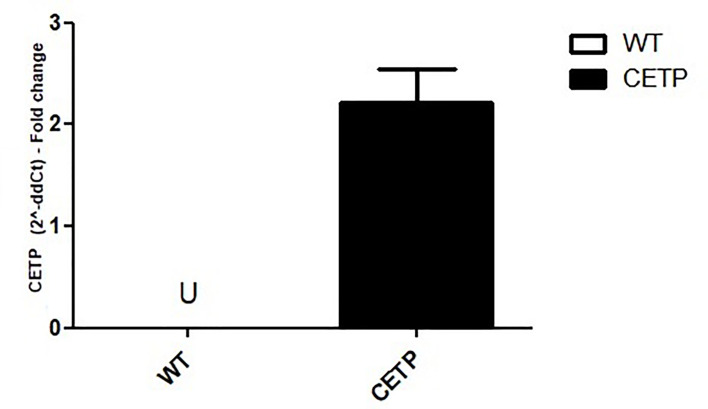
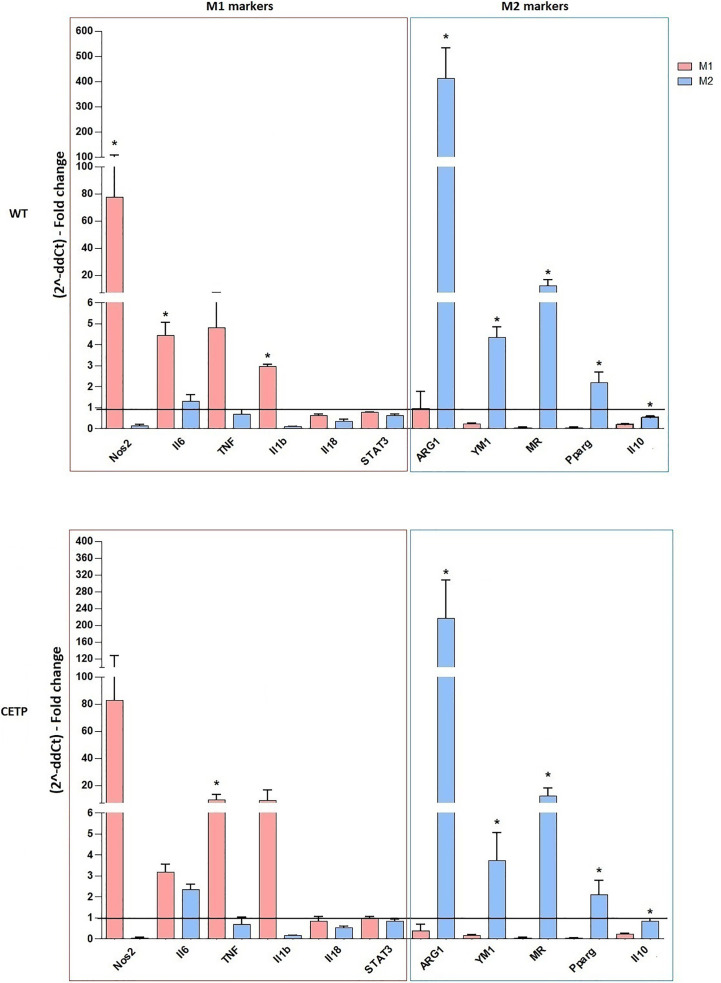
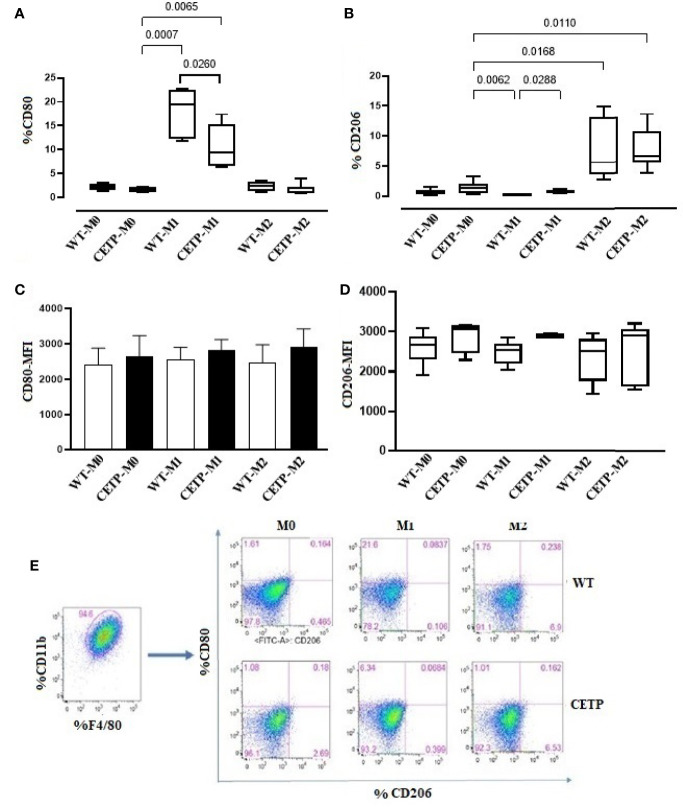
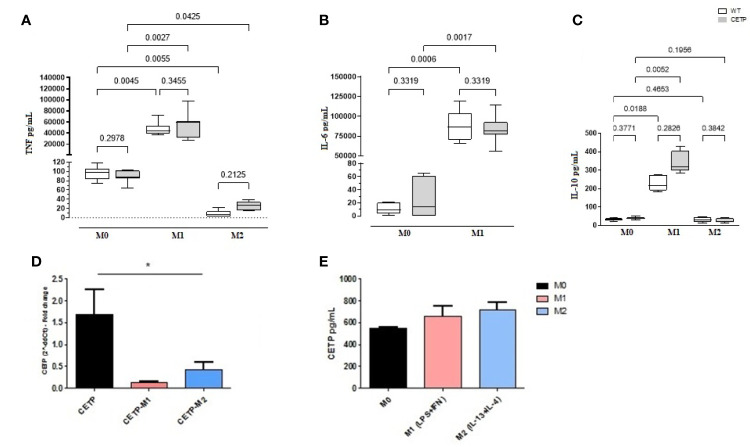
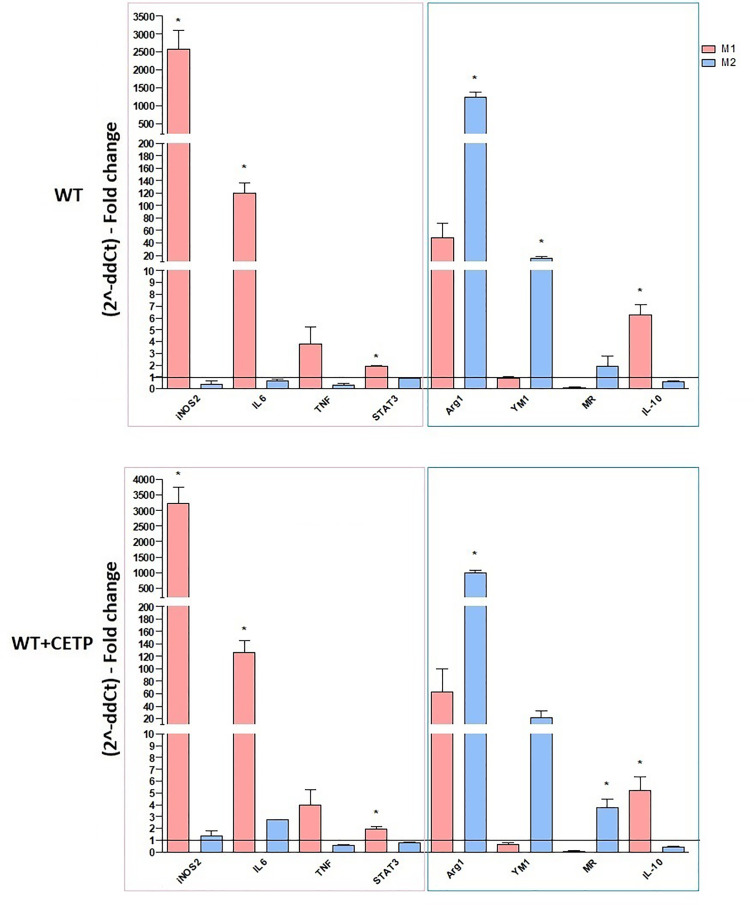
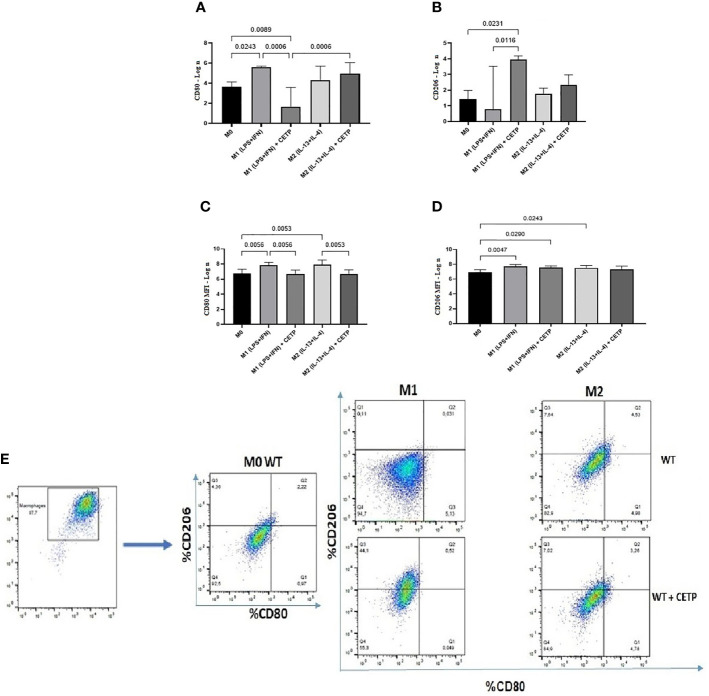
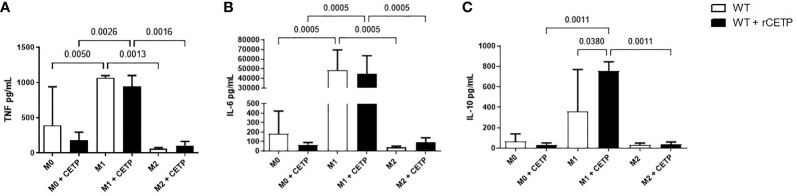
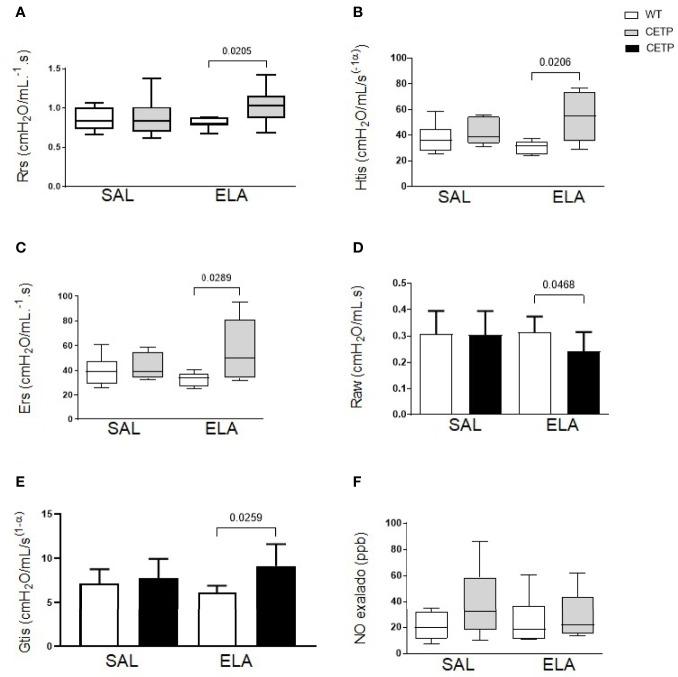
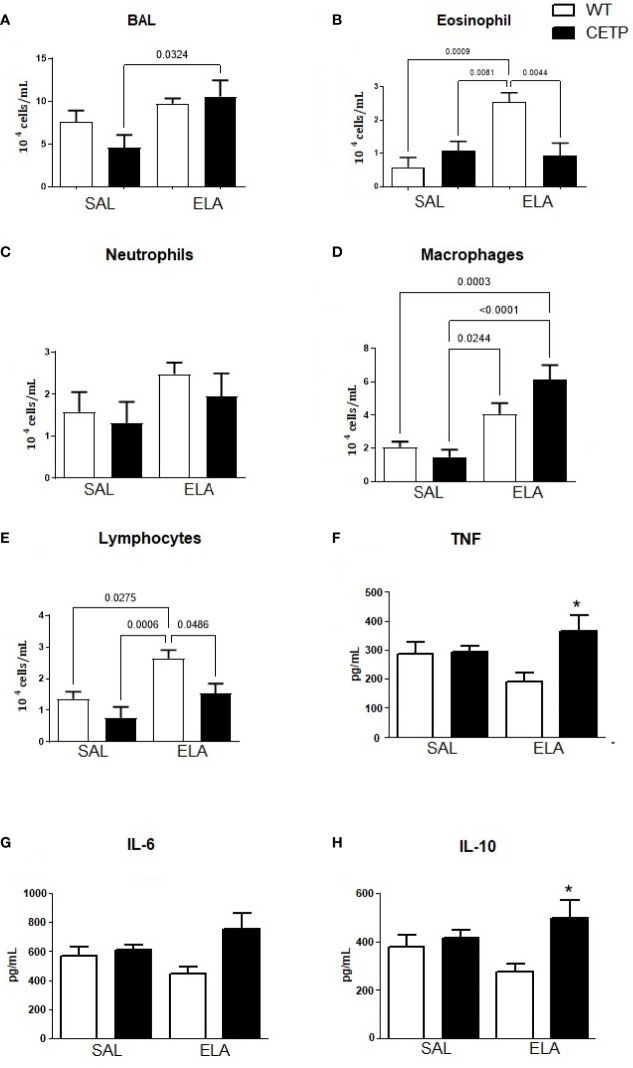
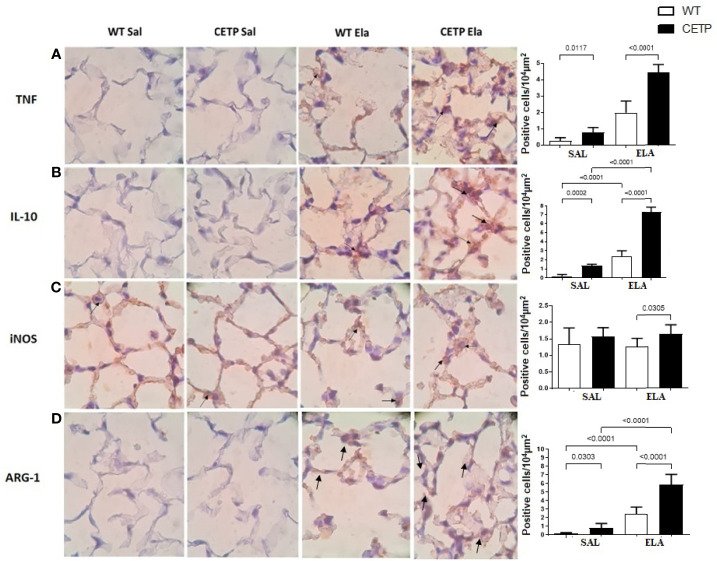
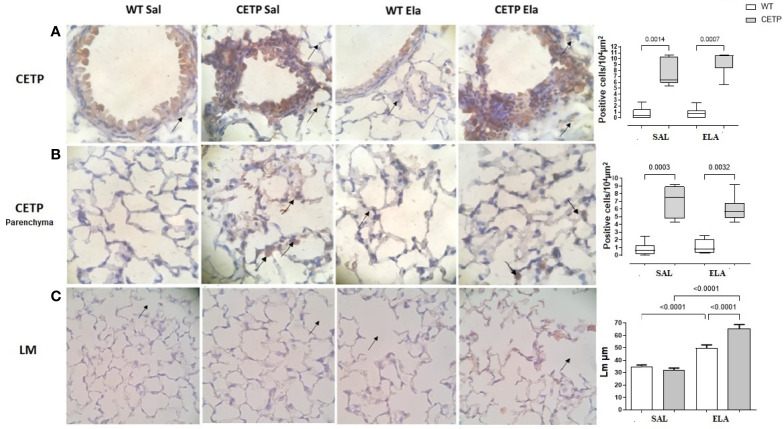
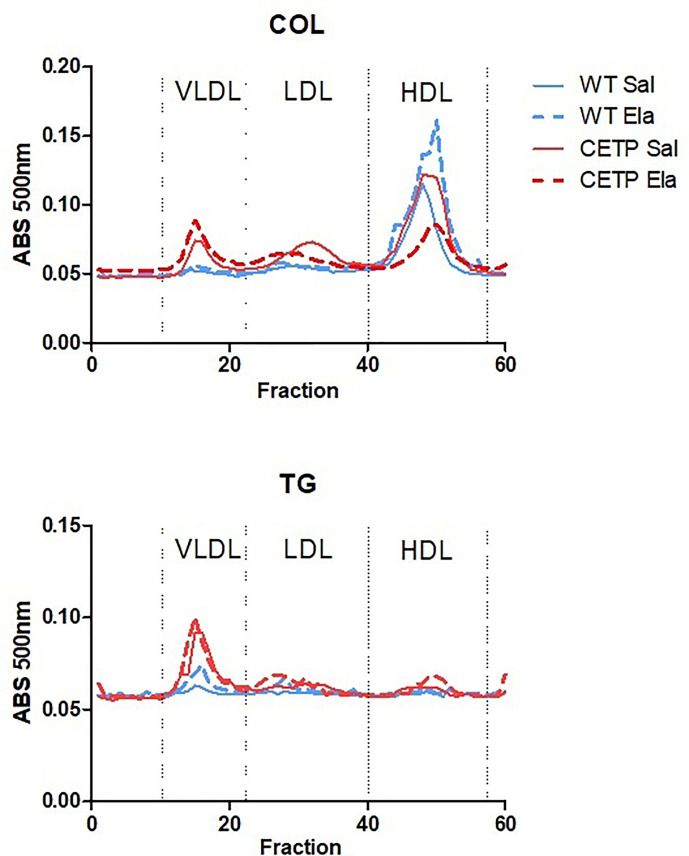
Cholesterol-ester transfer protein (CETP) plays a role in atherosclerosis, the inflammatory response to endotoxemia and in experimental and human sepsis. Functional alterations in lipoprotein (LP) metabolism and immune cell populations, including macrophages, occur during sepsis and may be related to comorbidities such as chronic obstructive pulmonary disease (COPD). Macrophages are significantly associated with pulmonary emphysema, and depending on the microenvironment, might exhibit an M1 or M2 phenotype. Macrophages derived from the peritoneum and bone marrow reveal CETP that contributes to its plasma concentration. Here, we evaluated the role of CETP in macrophage polarization and elastase-induced pulmonary emphysema (ELA) in human CETP-expressing transgenic (huCETP) (line 5203, C57BL6/J background) male mice and compared it to their wild type littermates. We showed that bone marrow-derived macrophages from huCETP mice reduce polarization toward the M1 phenotype, but with increased IL-10. Compared to WT, huCETP mice exposed to elastase showed worsened lung function with an increased mean linear intercept (Lm), reflecting airspace enlargement resulting from parenchymal destruction with increased expression of arginase-1 and IL-10, which are M2 markers. The cytokine profile revealed increased IL-6 in plasma and TNF, and IL-10 in bronchoalveolar lavage (BAL), corroborating with the lung immunohistochemistry in the huCETP-ELA group compared to WT-ELA. Elastase treatment in the huCETP group increased VLDL-C and reduced HDL-C. Elastase-induced pulmonary emphysema in huCETP mice promotes lung M2-like phenotype with a deleterious effect in experimental COPD, corroborating the in vitro result in which CETP promoted M2 macrophage polarization. Our results suggest that CETP is associated with inflammatory response and influences the role of macrophages in COPD.
Keywords: arginase 1; cholesterol ester transfer protein; chronic obstructive pulmonary disease; inflammation; interleukin-10; macrophage—cell; pulmonary emphysema.
Copyright © 2021 Santana, Righetti, Breda, Domínguez-Amorocho, Ramalho, Dantas, Nunes, Tibério, Soriano, Câmara, Quintão and Cazita.
Conflict of interest statement
The authors declare that the research was conducted in the absence of any commercial or financial relationships that could be construed as a potential conflict of interest.
Figures
Similar articles
-
Transcription Factor T-bet Attenuates the Development of Elastase-induced Emphysema in Mice.Am J Respir Cell Mol Biol. 2019 Oct;61(4):525-536. doi: 10.1165/rcmb.2018-0109OC. Am J Respir Cell Mol Biol. 2019. PMID: 30965014
-
Chronic exposure to diesel particles worsened emphysema and increased M2-like phenotype macrophages in a PPE-induced model.PLoS One. 2020 Jan 31;15(1):e0228393. doi: 10.1371/journal.pone.0228393. eCollection 2020. PLoS One. 2020. PMID: 32004356 Free PMC article.
-
Lack of Transcription Factor p53 Exacerbates Elastase-Induced Emphysema in Mice.Am J Respir Cell Mol Biol. 2016 Feb;54(2):188-99. doi: 10.1165/rcmb.2014-0375OC. Am J Respir Cell Mol Biol. 2016. PMID: 26106979
-
Lipid transfer proteins: past, present and perspectives.Atherosclerosis. 2010 Mar;209(1):1-9. doi: 10.1016/j.atherosclerosis.2009.08.002. Epub 2009 Aug 8. Atherosclerosis. 2010. PMID: 19733354 Review.
-
[Traditional Chinese medicine and active ingredients regulate M1/M2 macrophage polarization balance to treat chronic obstructive pulmonary disease: a review].Zhongguo Zhong Yao Za Zhi. 2024 Aug;49(16):4298-4312. doi: 10.19540/j.cnki.cjcmm.20240513.701. Zhongguo Zhong Yao Za Zhi. 2024. PMID: 39307767 Review. Chinese.
Cited by
-
The 'analysis of gene expression and biomarkers for point-of-care decision support in Sepsis' study; temporal clinical parameter analysis and validation of early diagnostic biomarker signatures for severe inflammation andsepsis-SIRS discrimination.Front Immunol. 2024 Jan 25;14:1308530. doi: 10.3389/fimmu.2023.1308530. eCollection 2023. Front Immunol. 2024. PMID: 38332914 Free PMC article.
-
Exploration of the Shared Gene Signatures and Molecular Mechanisms between Chronic Bronchitis and Antineutrophil Cytoplasmic Antibody-associated Glomerulonephritis: Evidence from Transcriptome Data.Curr Pharm Des. 2024;30(25):1966-1984. doi: 10.2174/0113816128297623240521070426. Curr Pharm Des. 2024. PMID: 38847168
-
Genome-scale modeling predicts metabolic differences between macrophage subtypes in colorectal cancer.iScience. 2023 Aug 9;26(9):107569. doi: 10.1016/j.isci.2023.107569. eCollection 2023 Sep 15. iScience. 2023. PMID: 37664588 Free PMC article.
-
Ensemble-based genome-scale modeling predicts metabolic differences between macrophage subtypes in colorectal cancer.bioRxiv [Preprint]. 2023 Mar 11:2023.03.09.532000. doi: 10.1101/2023.03.09.532000. bioRxiv. 2023. Update in: iScience. 2023 Aug 09;26(9):107569. doi: 10.1016/j.isci.2023.107569. PMID: 36993493 Free PMC article. Updated. Preprint.
-
Novel Role of CETP in Macrophages: Reduction of Mitochondrial Oxidants Production and Modulation of Cell Immune-Metabolic Profile.Antioxidants (Basel). 2022 Aug 31;11(9):1734. doi: 10.3390/antiox11091734. Antioxidants (Basel). 2022. PMID: 36139808 Free PMC article.
References
-
- Oliveira HCF, Raposo HF. Cholesteryl Ester Transfer Protein and Lipid Metabolism and Cardiovascular Diseases. In: Jiang XC, editor. Lipid Transfer in Lipoprotein Metabolism and Cardiovascular Disease. Singapore: Springer-Verlag Singapore Pte Ltd; (2020). 10.1007/978-981-15-6082-82 - DOI
Publication types
MeSH terms
Substances
LinkOut - more resources
Full Text Sources
Molecular Biology Databases
Research Materials