. 2021 Jul 22:12:693608.
doi: 10.3389/fimmu.2021.693608. eCollection 2021.

Single-Cell RNA Sequencing Reveals the Immunological Profiles of Renal Allograft Rejection in Mice

Affiliations

Single-Cell RNA Sequencing Reveals the Immunological Profiles of Renal Allograft Rejection in Mice

Qixia Shen et al. Front Immunol. .

Abstract

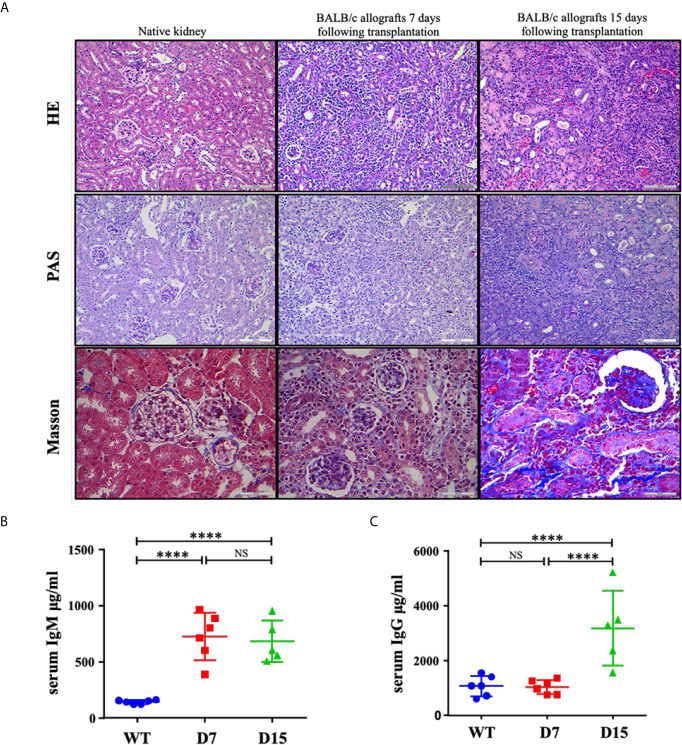
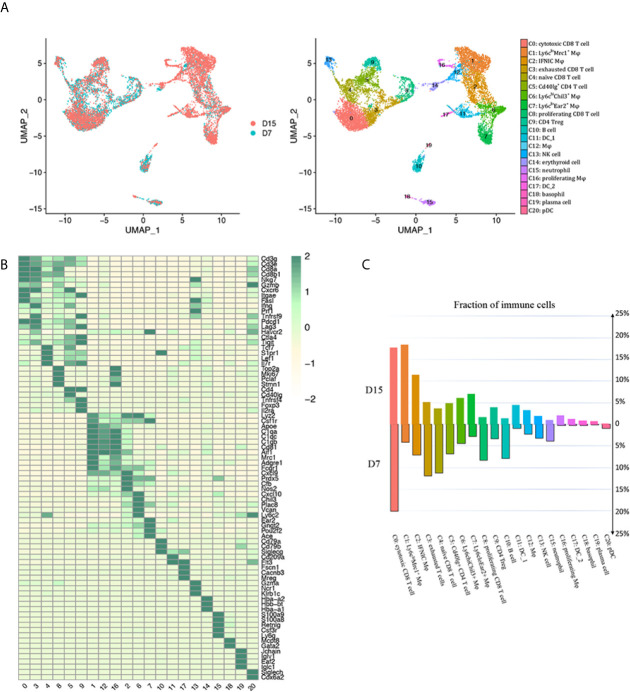
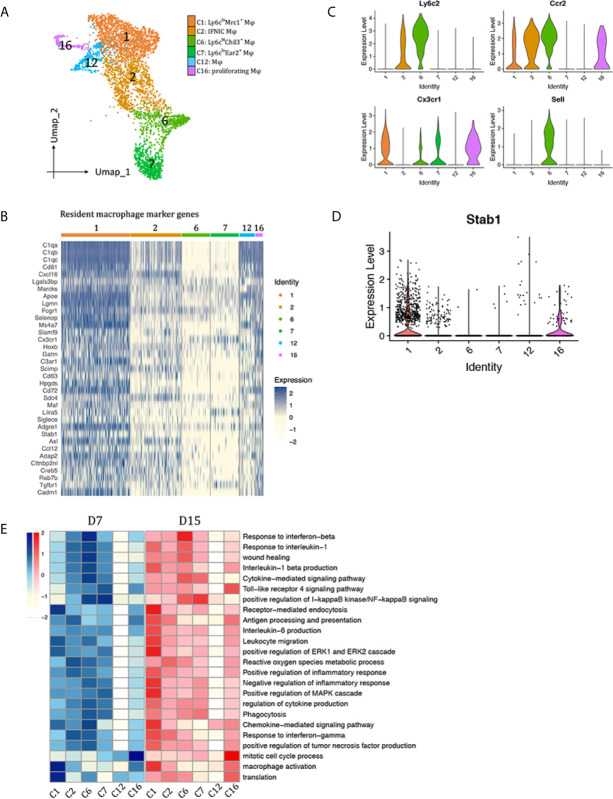
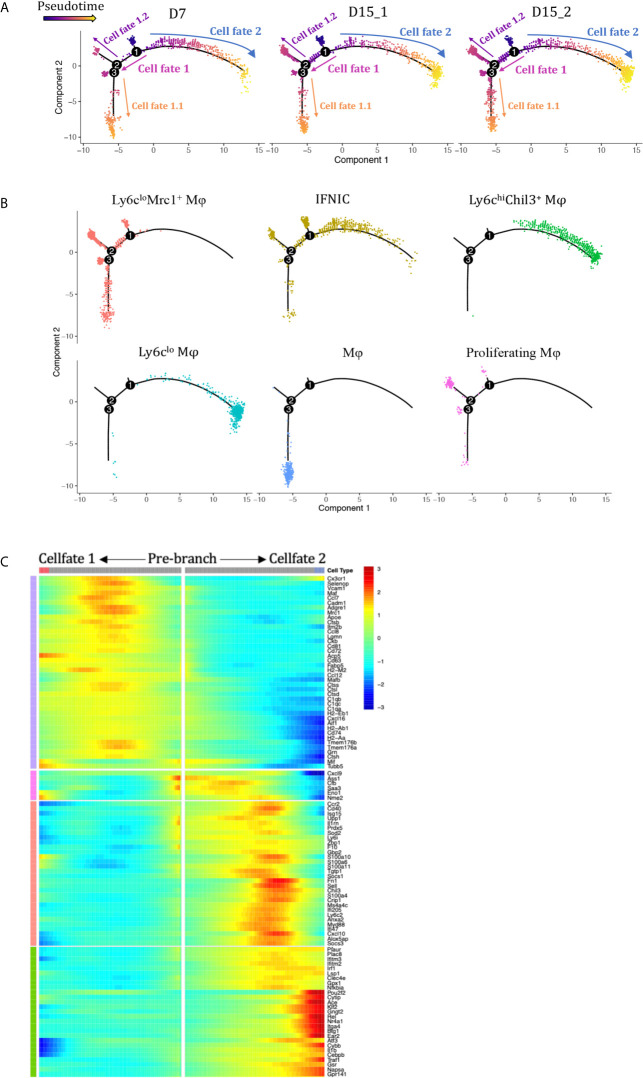
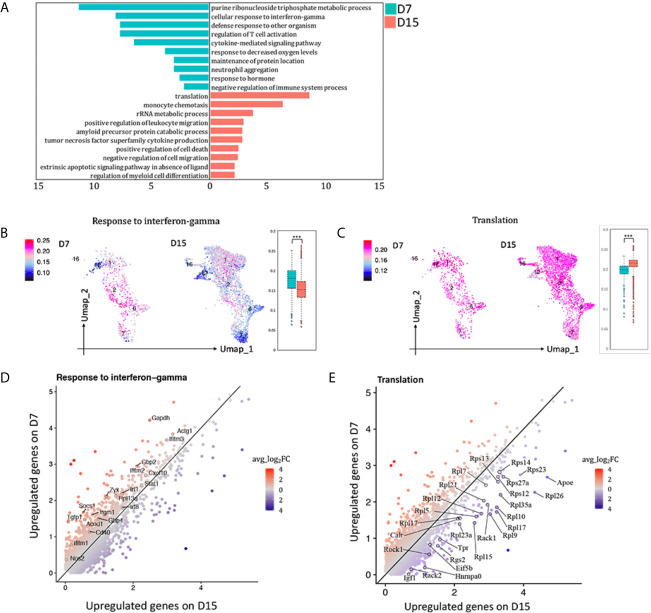
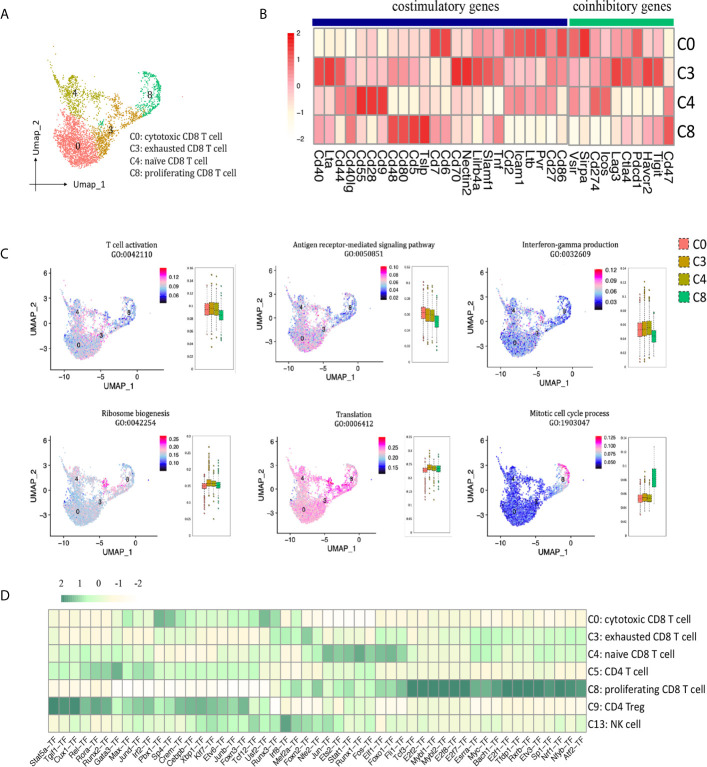
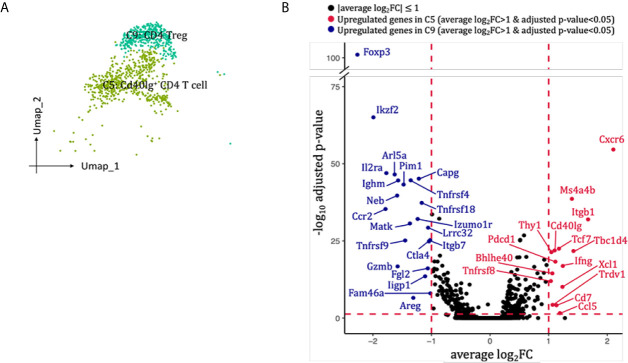
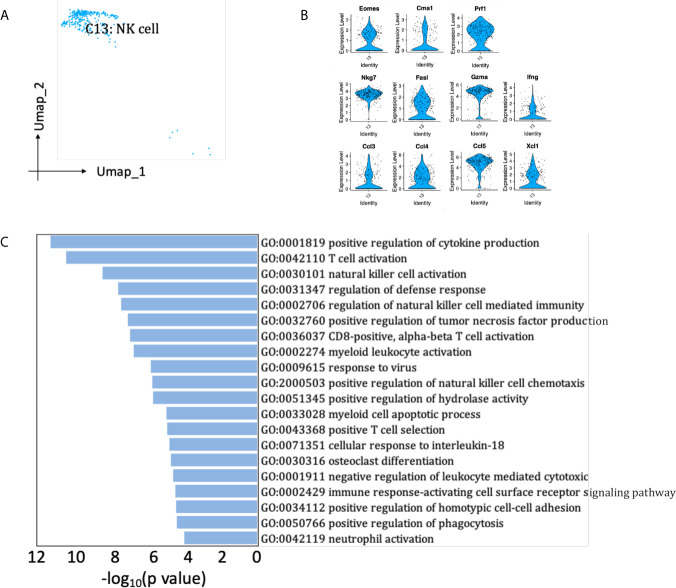
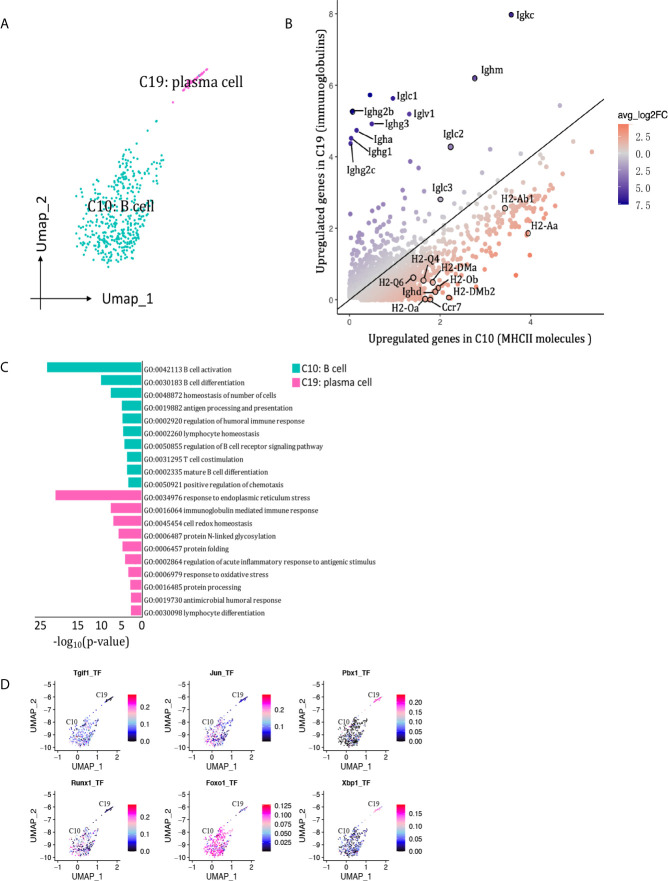
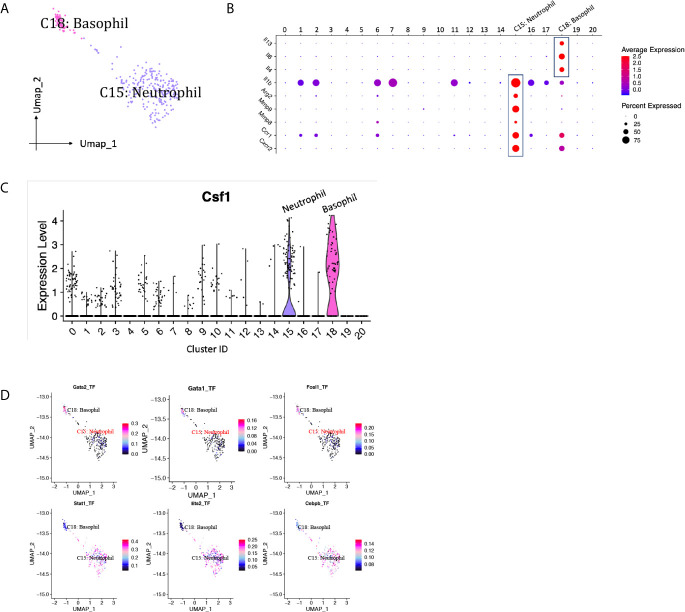
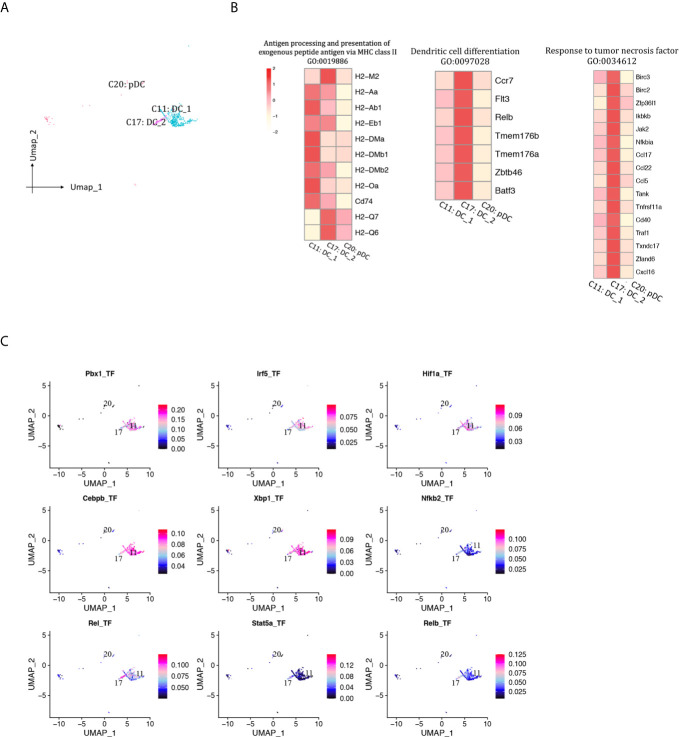
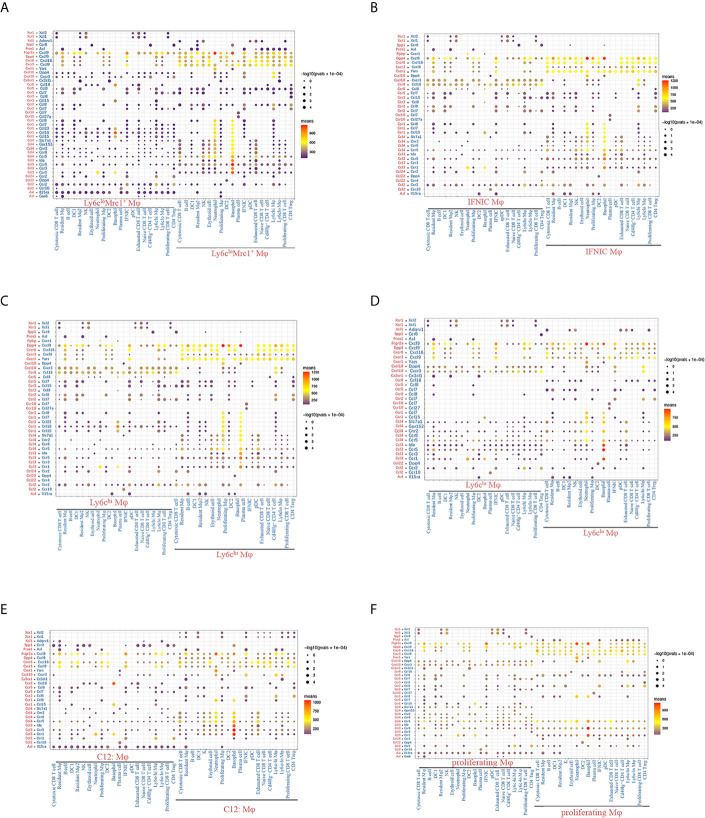
Allograft rejection is a common immunological feature in renal transplantation and is associated with reduced graft survival. A mouse renal allograft rejection model was induced and single-cell RNA sequencing (scRNA-seq) data of CD45+ leukocytes in kidney allografts on days 7 (D7) and 15 (D15) after operation was analyzed to reveal a full immunological profiling. We identified 20 immune cell types among 10,921 leukocytes. Macrophages and CD8+ T cells constituted the main populations on both timepoints. In the process from acute rejection (AR) towards chronic rejection (CR), the proportion of proliferating and naïve CD8+ T cells dropped significantly. Both B cells and neutrophils decreased by about 3 folds. On the contrary, the proportion of macrophages and dendritic cells (DCs) increased significantly, especially by about a 4.5-fold increase in Ly6cloMrc1+ macrophages and 2.6 folds increase in Ly6cloEar2+ macrophages. Moreover, myeloid cells harbored the richest ligand and receptor (LR) pairs with other cells, particularly for chemokine ligands such as Cxcl9, Cxcl10, Cxcl16 and Yars. However, macrophages with weak response to interferon gamma (IFNg) contributed to rejection chronicization. To conclude, reduction in CD8 T cells, B cells and neutrophils while increasing in Ly6cloMrc1+ macrophages and Ly6cloEar2+ macrophages, may contribute significantly to the progress from AR towards CR.

Keywords: ScRNA-seq; acute rejection; chronic rejection; immunological profiles; renal transplantation.


Conflict of interest statement

The authors declare that the research was conducted in the absence of any commercial or financial relationships that could be construed as a potential conflict of interest.

Figures

Figure 1
Figure 1
Representative histological tubular injury in the transplanted kidneys. (A) Representative pictures of HE, PAS and Masson staining of native kidneys and allografted kidneys. Native kidneys do not exhibit tubular injury. Seven and 15 days following transplantation, BALB/c allografts undergo acute rejection with diffuse mononuclear cell infiltrates, perivascular lymphocytic infiltrates, necrotic tubules and tubulitis. Collagen fibers were only noted in some parts of BALB/c allografts collected 15 days following transplantation as Masson staining showed. ELISA measurements of total (B) IgM and (C) IgG concentrations in serum from WT C57Bl6/J mice (n = 6), kidney allograft recipients sacrificed on D7 (n = 6) and D15 (n = 5). WT, wild type; D7, 7 days following transplantation; D15, 15 days following transplantation. Data are presented as mean ± SD, and n represents number of mice. ****p < 0.0001. NS, not significant.
Figure 2
Figure 2
scRNA-seq of mice kidney allograft revealed the presence of 20 CD45+ immune cell clusters. (A) UMAP plot of cell clusters identified based on the expression of highly variable genes. Each dot depicts a single cell, colored according to cluster designation. Cell identities are annotated on the right. (B) Heat map showing the marker genes in each cell cluster identified through unsupervised clustering of kidney graft immune cells. Average expression scale is shown on the right. Cell identities are annotated as in (A). (C) Bar plot showing the proportions of 20 immune cell populations in kidney allografts collected 7 days and 15 days following transplantation, respectively, colored according to cluster designation in (A). UMAP, Uniform Manifold Approximation and Projection; Mφ, macrophage; DC, dendritic cell; NK, natural killer; pDC, Plasmacytoid dendritic cell.
Figure 3
Figure 3
Macrophages subtypes presented in the allografted kidneys. (A) Integrated UMAP projection of the six macrophage clusters identified in the kidney grafts (clusters 1, 2, 6, 7, 12 and 16), colored according to cluster designation. Cell identities are annotated on the right. (B) Heatmap showing normalized expression of resident macrophage marker genes in macrophage clusters. Expression levels from low to high are colored from white to blue. Average expression scale is shown on the right. Violin plot showing normalized expression levels of the (C) Ccr2, Sell, Cx3cr1 and Ly6c2 (D) Stab1 in macrophage clusters. (E) Heatmap showing scaled GSVA score of selected GO terms. Average expression scale is shown on the left. UMAP, Uniform Manifold Approximation and Projection; D7, day 7; D15, day 15; Mφ, macrophage; GO, gene ontology; GSVA, gene set variation analysis.
Figure 4
Figure 4
Analysis of macrophage differentiation trajectories in the transplanted kidney. Pseudotime analysis in Monocle split according to (A) rejection types and (B) seurat clusters. Each dot represents a single cell. (C) Heatmap of pseudotime gene expression variation on branches of the pseudotime tree (as indicated in A, only top 106 variable genes are shown). D7, day 7; D15, day 15; Mφ, macrophage; IFNIC, IFNg induced cells.
Figure 5
Figure 5
Blunted response to interferon gamma contributed to acute rejection chronicization. (A) Differences in hallmark pathways of macrophages from different rejection types as determined by Metascape. Feature plot and bar plot showing gene-set activity scores of GO pathway (B) response to interferon gamma, (C) translation. Each point depicts a single cell, colored according to normalized gene-set activity scores. Average scale is shown on the left. Scatter plot depicting DEGs enriched in pathway (D) response to interferon gamma and (E) translation. Each dot represents a gene, colored according to the avg_log2FC from white to blue or red. Only DEGs with avg_log2FC >0.59 were circled and labeled. D7, day 7; D15, day 15; avg_log2FC, average log2 fold change; adj_p value, adjusted p value. ***p < 0.001.
Figure 6
Figure 6
CD8 T cell presented in the allografted kidneys. (A) Integrated UMAP projection of the four CD8 T cell clusters identified in the kidney grafts (clusters 0, 3, 4 and 8), colored according to cluster designation. Cell identities are annotated on the right. (B) Heatmap showing costimulatory and coinhibitory genes in CD8 T cell clusters. Scale bar is shown on the left. (C) Feature plots showing AUC scores of GO pathways in CD8 T cell. Cell identities are annotated above the cell cluster. Score bar is shown on the right. (D) Heatmap of the area under the curve scores for the expression of gene sets regulated by transcription factors, as estimated with SCENIC, in CD8 T cell, CD4 T cell and NK cell clusters. Scaled AUC score bar is shown above. UMAP, Uniform Manifold Approximation and Projection; AUC, area under the curve; SCENIC, single-cell regulatory network inference and clustering; NK, natural killer.
Figure 7
Figure 7
CD4 T cells presented in the allografted kidneys. (A) Integrated UMAP projection of the two CD4 T cells clusters identified in the kidney grafts (clusters 5 and 9), colored according to cluster designation. Cell identities are annotated on the clusters. (B) Volcano plots of the differentially modulated genes in C5 versus C9. The x axis specifies the average log2FC and the y axis specifies the negative logarithm (base 10) of the adj_p value. Red vertical and horizontal lines reflect the filtering criteria (avg_log2FC = ± 0.59 and adj_p value = 0.05). Red dots indicate genes induced in C5; blue dots indicate genes induced in C9. Genes passing filtering criteria are labeled. UMAP, Uniform Manifold Approximation and Projection; avg_log2FC, average log2 fold change; adj_p value, adjusted p value.
Figure 8
Figure 8
NK cells presented in the allografted kidneys. (A) Integrated UMAP projection of the NK cell cluster identified in the kidney grafts (clusters 13), colored according to cluster designation. Cell identity is annotated on the cluster. (B) Violin plot showing normalized expression levels of markers in NK cell cluster. (C) Pathway enrichment of genes with avg_log2FC ≥0.59 in NK cell cluster. UMAP, Uniform Manifold Approximation and Projection; avg_log2FC, average log2 fold change.
Figure 9
Figure 9
B cells presented in the allografted kidneys. (A) Integrated UMAP projection of the 2 B cell clusters identified in the kidney grafts (clusters 10 and 19), colored according to cluster designation. Cell identities are annotated on the clusters. (B) Scatter plot showing average expression of genes in C5 versus C9. Each dot represents a gene, colored according to the average log2FC from white to blue or red. Genes encoding immunoglobulins and MHCII molecules with |avg_log2FC| ≥0.59 were circle and labeled. (C) Pathway enrichment of genes with avg_log2FC ≥0.59 in clusters 10 and 19. (D) Feature plot showing AUC scores for the expression of gene sets regulated by transcription factors, as estimated with SCENIC, in clusters 10 and 19. UMAP, Uniform Manifold Approximation and Projection; avg_log2FC, average log2 fold change; adj_p value, adjusted p value; AUC, area under the curve; SCENIC, single-cell regulatory network inference and clustering.
Figure 10
Figure 10
Granulocytes presented in the allografted kidneys. (A) Integrated UMAP projection of one neutrophil cluster (cluster 15) and one basophil cluster (cluster 18) identified in the kidney grafts, colored according to cluster designation. Cell identities are annotated above the cell dots. (B) Dot plot showing gene expression levels of Il13, Il4, Il6, Il1b, Arg2, Mmp8, Mmp9, Ccr1 and Cxcr2 in all clusters. (C) Violin plot showing normalized expression levels of Csf1 in all clusters. (D) Feature plot showing the AUC scores for the expression of gene sets regulated by transcription factors, as estimated with SCENIC, in neutrophil and basophil cluster. AUC score bar is shown on the right. UMAP, Uniform Manifold Approximation and Projection; AUC, area under the curve; SCENIC, single-cell regulatory network inference and clustering.
Figure 11
Figure 11
DCs presented in the allografted kidneys. (A) Integrated UMAP projection of three DC cell clusters (11, 17, 20) identified in the kidney grafts, colored according to cluster designation. Cell identities are annotated above the cell dots. (B) Heatmap showing scaled expression of genes enriched in GO pathways. Scale bar is shown on the left top. (C) Feature plot showing the AUC scores for the expression of gene sets regulated by transcription factors, as estimated with SCENIC, in clusters 11 and 17. AUC score bar is shown on the right. DC, dendritic cell; pDC, plasmacytoid dendritic cell; UMAP, Uniform Manifold Approximation and Projection; GO, gene ontology; AUC, area under the curve; SCENIC, single-cell regulatory network inference and clustering.
Figure 12
Figure 12
Chemokine mediated LR interactions between macrophages and other immune cell clusters. (A–F) Overview of chemokine mediated LR interactions between macrophages and other immune cell clusters. P values are indicated by circle size, with the scale to the right (permutation test). The means of the average expression levels of interacting molecule 1 in cluster 1 and interacting molecule 2 in cluster 2 are indicated by color. Assays were carried out at the mRNA level but were used to extrapolate protein interactions. Only LR pairs with means value >100 are shown. Mφ, macrophage; DC, dendritic cells; pDC, plasmacytoid dendritic cell; IFNIC, IFNg induced cells; LR, ligand and receptor.

Similar articles

Cited by

References

    1. Lusco MA, Fogo AB, Najafian B, Alpers CE. Ajkd Atlas of Renal Pathology: Acute T-Cell-Mediated Rejection. Am J Kidney Dis (2016) 67(5):e29–30. 10.1053/j.ajkd.2016.03.004 - DOI - PubMed
    1. Nankivell BJ, Borrows RJ, Fung CL, O’Connell PJ, Allen RD, Chapman JR. The Natural History of Chronic Allograft Nephropathy. N Engl J Med (2003) 349(24):2326–33. 10.1056/NEJMoa020009 - DOI - PubMed
    1. Makalowski W, Zhang J, Boguski MS. Comparative Analysis of 1196 Orthologous Mouse and Human Full-Length mRNA and Protein Sequences. Genome Res (1996) 6(9):846–57. 10.1101/gr.6.9.846 - DOI - PubMed
    1. Winkels H, Ehinger E, Vassallo M, Buscher K, Dinh HQ, Kobiyama K, et al. . Atlas of the Immune Cell Repertoire in Mouse Atherosclerosis Defined by Single-Cell Rna-Sequencing and Mass Cytometry. Circ Res (2018) 122(12):1675–88. 10.1161/CIRCRESAHA.117.312513 - DOI - PMC - PubMed
    1. Hua X, Hu G, Hu Q, Chang Y, Hu Y, Gao L, et al. . Single-Cell RNA Sequencing to Dissect the Immunological Network of Autoimmune Myocarditis. Circulation (2020) 142(4):384–400. 10.1161/CIRCULATIONAHA.119.043545 - DOI - PubMed

Publication types

MeSH terms