Meta-Analysis
. 2021 Jul 23:12:694355.
doi: 10.3389/fimmu.2021.694355. eCollection 2021.

Gene Expression Meta-Analysis Reveals Interferon-Induced Genes Associated With SARS Infection in Lungs

Affiliations
Meta-Analysis

Gene Expression Meta-Analysis Reveals Interferon-Induced Genes Associated With SARS Infection in Lungs

Amber Park et al. Front Immunol. .

Abstract

Background: Severe Acute Respiratory Syndrome (SARS) corona virus (CoV) infections are a serious public health threat because of their pandemic-causing potential. This work is the first to analyze mRNA expression data from SARS infections through meta-analysis of gene signatures, possibly identifying therapeutic targets associated with major SARS infections.

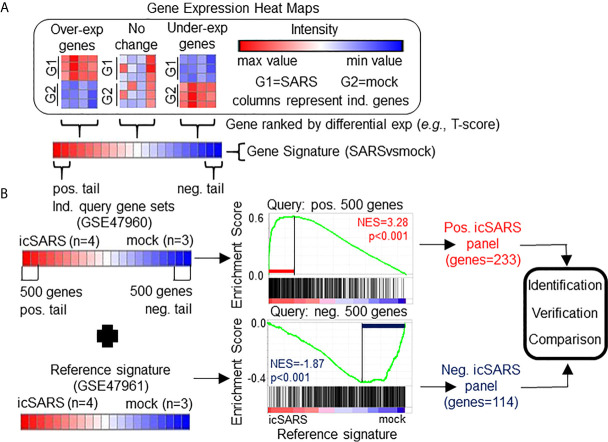
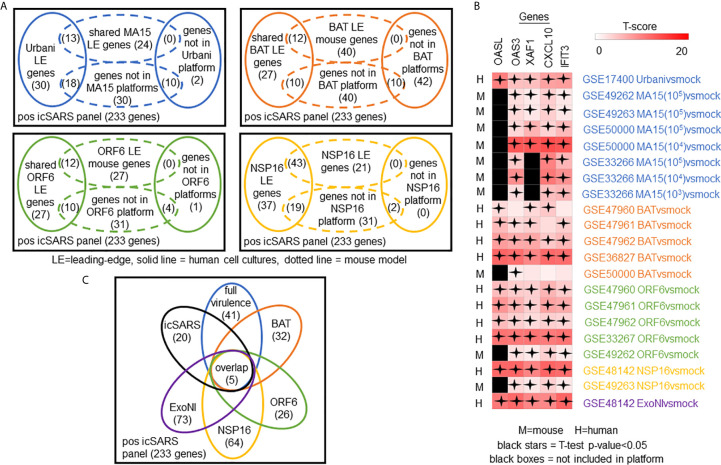
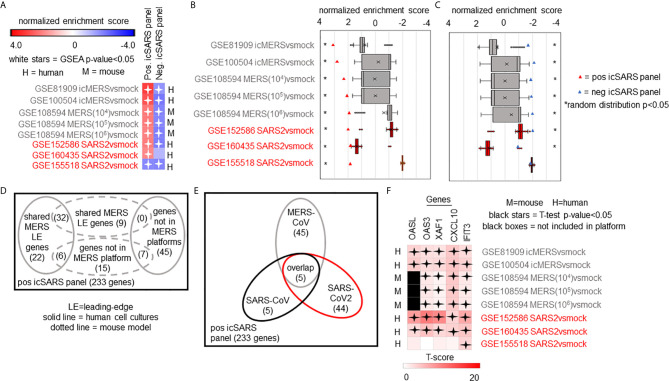
Methods: This work defines 37 gene signatures representing SARS-CoV, Middle East Respiratory Syndrome (MERS)-CoV, and SARS-CoV2 infections in human lung cultures and/or mouse lung cultures or samples and compares them through Gene Set Enrichment Analysis (GSEA). To do this, positive and negative infectious clone SARS (icSARS) gene panels are defined from GSEA-identified leading-edge genes between two icSARS-CoV derived signatures, both from human cultures. GSEA then is used to assess enrichment and identify leading-edge icSARS panel genes between icSARS gene panels and 27 other SARS-CoV gene signatures. The meta-analysis is expanded to include five MERS-CoV and three SARS-CoV2 gene signatures. Genes associated with SARS infection are predicted by examining the intersecting membership of GSEA-identified leading-edges across gene signatures.

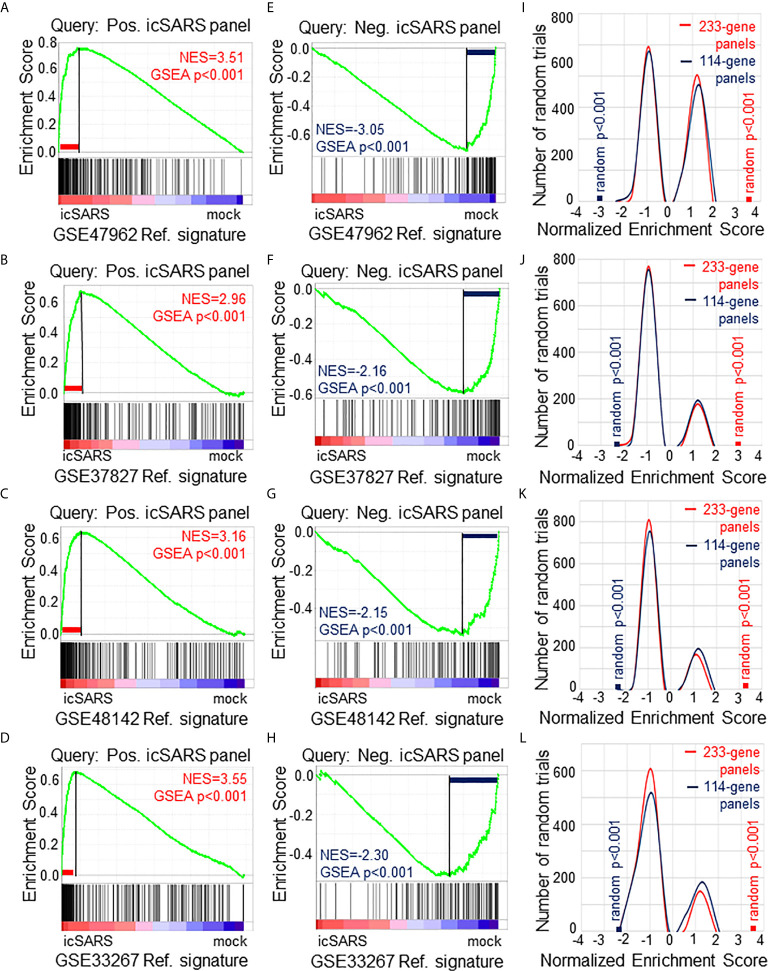
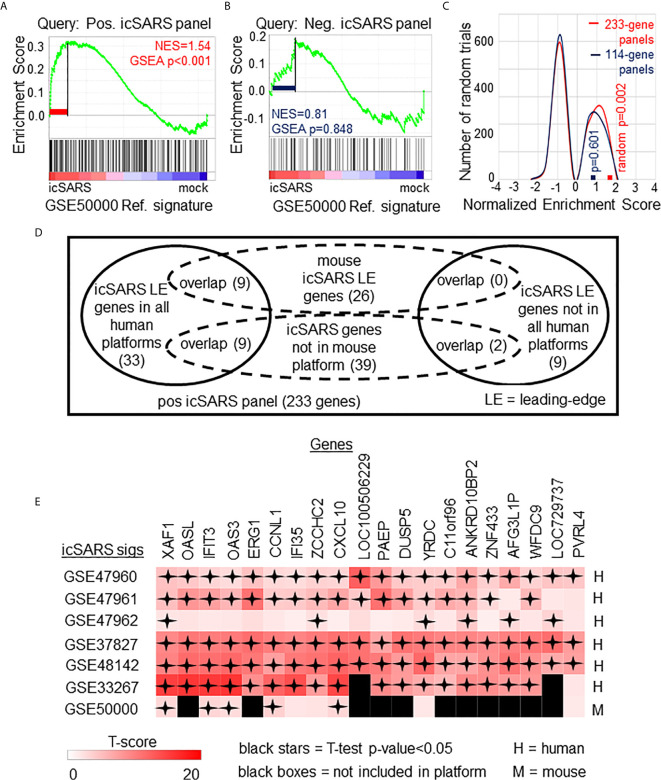
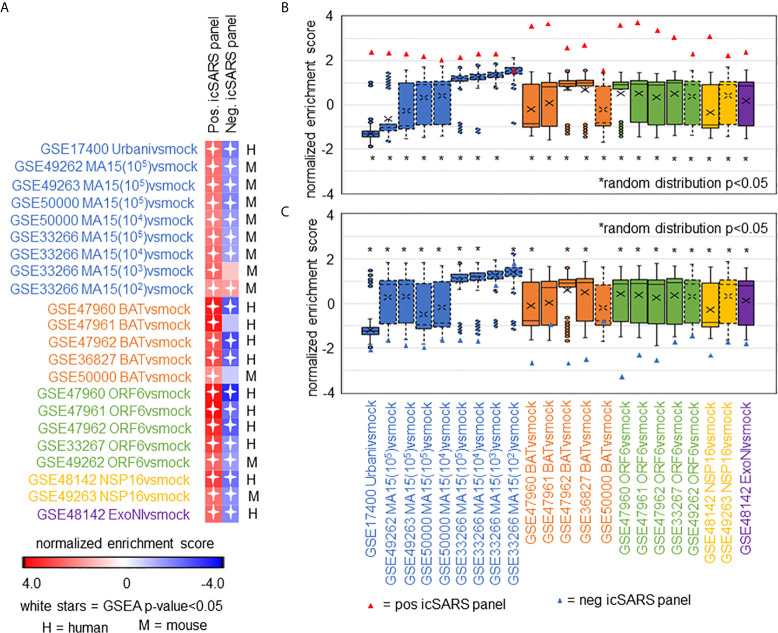
Results: Significant enrichment (GSEA p<0.001) is observed between two icSARS-CoV derived signatures, and those leading-edge genes defined the positive (233 genes) and negative (114 genes) icSARS panels. Non-random significant enrichment (null distribution p<0.001) is observed between icSARS panels and all verification icSARSvsmock signatures derived from human cultures, from which 51 over- and 22 under-expressed genes are shared across leading-edges with 10 over-expressed genes already associated with icSARS infection. For the icSARSvsmock mouse signature, significant, non-random significant enrichment held for only the positive icSARS panel, from which nine genes are shared with icSARS infection in human cultures. Considering other SARS strains, significant, non-random enrichment (p<0.05) is observed across signatures derived from other SARS strains for the positive icSARS panel. Five positive icSARS panel genes, CXCL10, OAS3, OASL, IFIT3, and XAF1, are found across mice and human signatures regardless of SARS strains.

Conclusion: The GSEA-based meta-analysis approach used here identifies genes with and without reported associations with SARS-CoV infections, highlighting this approach's predictability and usefulness in identifying genes that have potential as therapeutic targets to preclude or overcome SARS infections.

Keywords: MERS-CoV; SARS-CoV; SARS-CoV2; coronavirus; gene expression; gene set enrichment analysis; meta-analysis.


Conflict of interest statement

The authors declare that the research was conducted in the absence of any commercial or financial relationships that could be construed as a potential conflict of interest.

Figures

Figure 1
Figure 1
Gene Signature Definition and Generation icSARS Gene Panels. (A) Schematic definition of a gene signature. Differences in gene expression between two groups, such as SARS and mock infected lung cells, are measured by Welch’s two-sample T−test score. Gene signatures are ranked lists of genes from high (red) to low (blue) differential mRNA expression between groups. (B) Generation of icSARS gene panels for use in this study. To identify differentially expressed genes associated with icSARS infection in human airway epithelial cell cultures, query gene sets containing either the 500 most over- or under-expressed genes from positive or negative tails of the gene signature generated from the Gene Expression Omnibus (GEO) accession number GSE47960 mRNA expression dataset. The positive and negative tail query sets were compared individually to the gene signature generated from the GEO GSE47961 dataset, which was used as reference for Gene Set Enrichment Analysis (GSEA). From this GSEA computed two enrichment plots, one for each query set, and their associated normalized enrichment score (NES) and p-value which represent the extent of enrichment between query set and reference signature. GSEA also identified leading-edge genes, which are genes that contribute most to achieving maximum enrichment. Two gene panels were defined from leading-edge genes identified in each query set. These gene panels were used in this study for three purposes: 1) identification of gene expression changes associated with icSARS infection in human airway epithelial cell cultures, 2) verification of identified findings in independent datasets, and 3) comparison to other gene signatures representing changes in gene expression associated with other SARS infections.
Figure 2
Figure 2
Verification of icSARS Gene Panels in Independent Datasets. (A) Gene Set Enrichment Analysis (GSEA) calculated enrichment, as determined by normalized enrichment score (NES), between the positive icSARS gene panel and the GSE47962-derived icSARSvsmock gene signature. (B) GSEA between the positive icSARS gene panel and GSE37827-derived icSARSvsmock gene signature. (C) GSEA between the positive icSARS gene panel and GSE48142-derived icSARSvsmock gene signature. (D) GSEA between the positive icSARS gene panel and GSE33267-derived icSARSvsmock gene signature. (E) GSEA between the negative icSARS panel and the GSE47962-derived icSARSvsmock signature. (F) GSEA between the negative icSARS panel and the GSE37827-derived icSARSvsmock signature. (G) GSEA between the negative icSARS panel and the GSE48142-derived icSARSvsmock signature. (H) GSEA between the negative icSARS panel and the GSE33267-derived icSARSvsmock signature. (I) Distribution plot of NES from 1000 randomly generated gene panels (individual queries) compared to the GSE47962-derived icSARSvsmock signature. (J) Distribution plot of NES from 1000 randomly generated gene panels compared to the GSE37827-derived icSARSvsmock signature. (K) Distribution plot of NES from 1000 randomly generated gene panels compared to the GSE48142-derived icSARSvsmock signature. (L) Distribution plot of NES from 1000 randomly generated gene panels compared to the GSE33267-derived icSARSvsmock signature.
Figure 3
Figure 3
Positive icSARS Panel Enrichment in icSARS Infected Mouse Model Revealed Genes Associated with icSARS Infection. (A) Gene Set Enrichment Analysis (GSEA) calculated enrichment, as determined by normalized enrichment score (NES), between the positive icSARS gene panel and the GSE50000-derived icSARSvsmock gene signature. (B) GSEA between the negative icSARS panel and the GSE50000-derived icSARSvsmock signature. (C) Distribution plot of NES from 1000 randomly generated gene panels (individual queries) compared to the GSE50000-derived icSARSvsmock signature (reference). (D) Venn diagram of the inclusion and overlap of positive icSARS panel genes in identified leading-edges and dataset platforms across icSARS-CoV human and mouse gene signatures. (E) Heat map of T−scores for the 20 positive icSARS panel leading-edge genes identified in (D).
Figure 4
Figure 4
icSARS Panel Enrichment Detected Differential Gene Expression Similarities Across SARS Strains with Varying Virulen. (A) Heat map of Gene Set Enrichment Analysis (GSEA) calculated normalized enrichment scores (NES) of the positive and negative icSARS panels across SARS-CoV strains with varying levels of virulence in both human lung cultures and mouse lung samples. (B) Box and whisker plots of NES from 1000 randomly generated gene panels containing 233 genes (individual queries) compared to gene signatures (individual references) used in (A). (C) Box and whisker plots of NES from 1000 randomly generated gene panels containing 114 genes (individual queries) compared to gene signatures (individual references) used in (A).
Figure 5
Figure 5
Meta-analysis Across 28 Gene Signatures Representing Seven SARS-CoV Strains Varying in Virulence Identified Five Over-Expressed Genes Associated with SARS-CoV Infection. (A) Venn diagrams of the inclusion and overlap of positive icSARS panel genes in identified leading-edges and dataset platforms from human and mouse gene signatures shared in individual strains of SARS-CoV. (B) Venn diagram of the inclusion and overlap of shared positive icSARS panel genes identified in SARS-CoV leading-edges across individual strains of SARS-CoV. (C) Heat map of T−scores for the five positive icSARS panel leading-edge genes identified in (B).
Figure 6
Figure 6
Five Over-Expressed Genes Identified in SARS-CoV Meta-analysis Found in Meta-analysis of MERS-CoV and SARS-CoV2 Signatures. (A) Heat map of Gene Set Enrichment Analysis calculated normalized enrichment scores for positive and negative icSARS panels across gene signatures derived from MERS-CoV and SARS-CoV2 infections in human or mouse lung cultures. (B) Box and whisker plots of normalized enrichment scores from 1000 randomly generated gene panels containing 233 genes (individual queries) compared to MERS-CoV and SARS-CoV2 gene signatures (individual references). (C) Box and whisker plots of normalized enrichment scores from 1000 randomly generated gene panels containing 114 genes (individual queries) compared to MERS-CoV and SARS-CoV2 gene signatures (individual references). (D) Venn diagram of the inclusion and overlap of positive icSARS panel genes in identified leading-edges and dataset platforms across MERS-CoV human and mouse gene signatures. (E) Venn diagram of the inclusion and overlap of shared positive icSARS panel genes in identified in SARS-CoV ( Figure 6 ), MERS-CoV (from D), and SARS-CoV2 gene signatures. (F) Heat map of T−scores for the five positive icSARS panel leading-edge genes identified in (E).

Similar articles

Cited by

References

    1. Li X, Luk HKH, Lau SKP, Woo PCY. Human Coronaviruses: General Features. Reference Module Biomed Sci (2019) 2019:B978–970-912-801238-801233.895704-801230. 10.1016/B978-0-12-801238-3.95704-0 - DOI
    1. Sims AC, Tilton SC, Menachery VD, Gralinski LE, Schafer A, Matzke MM, et al. . Release of Severe Acute Respiratory Syndrome Coronavirus Nuclear Import Block Enhances Host Transcription in Human Lung Cells. J Virol (2013) 87(7):3885–902. 10.1128/JVI.02520-12 - DOI - PMC - PubMed
    1. Yount B, Roberts RS, Sims AC, Deming D, Frieman MB, Sparks J, et al. . Severe Acute Respiratory Syndrome Coronavirus Group-Specific Open Reading Frames Encode Nonessential Functions for Replication in Cell Cultures and Mice. J Virol (2005) 79(23):14909–22. 10.1128/JVI.79.23.14909-14922.2005 - DOI - PMC - PubMed
    1. Boulos MN. Descriptive Review of Geographic Mapping of Severe Acute Respiratory Syndrome (SARS) on the Internet. Int J Health Geogr (2004) 3(1):2. 10.1186/1476-072X-3-2 - DOI - PMC - PubMed
    1. Lai ST. Treatment of Severe Acute Respiratory Syndrome. Eur J Clin Microbiol Infect Dis (2005) 24(9):583–91. 10.1007/s10096-005-0004-z - DOI - PMC - PubMed

MeSH terms