. 2021 Jul 22:12:699633.
doi: 10.3389/fimmu.2021.699633. eCollection 2021.

IRF7-Associated Immunophenotypes Have Dichotomous Responses to Virus/Allergen Coexposure and OM-85-Induced Reprogramming

Affiliations

IRF7-Associated Immunophenotypes Have Dichotomous Responses to Virus/Allergen Coexposure and OM-85-Induced Reprogramming

Emma de Jong et al. Front Immunol. .

Abstract

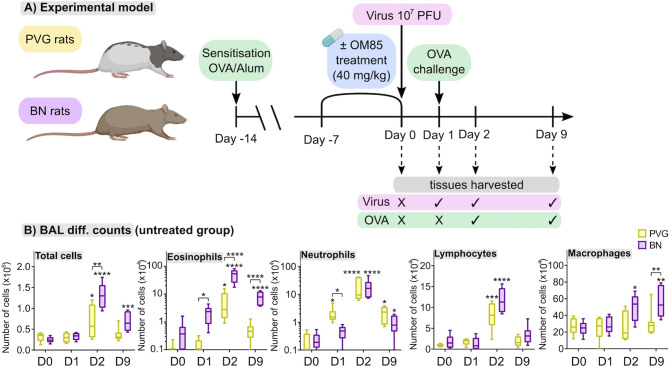
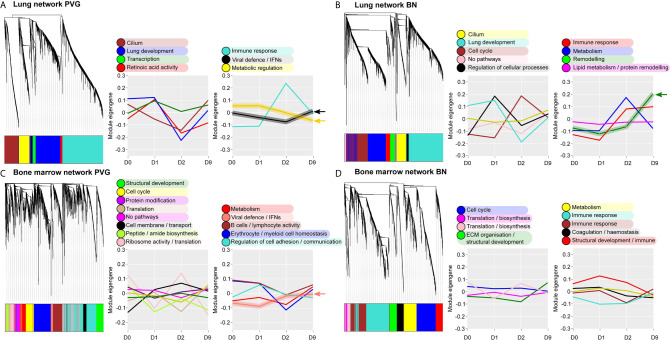
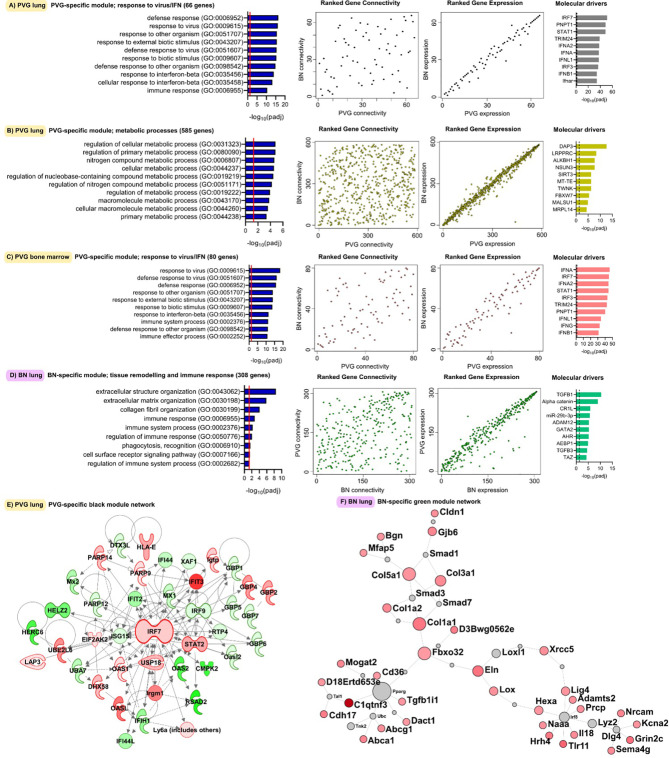
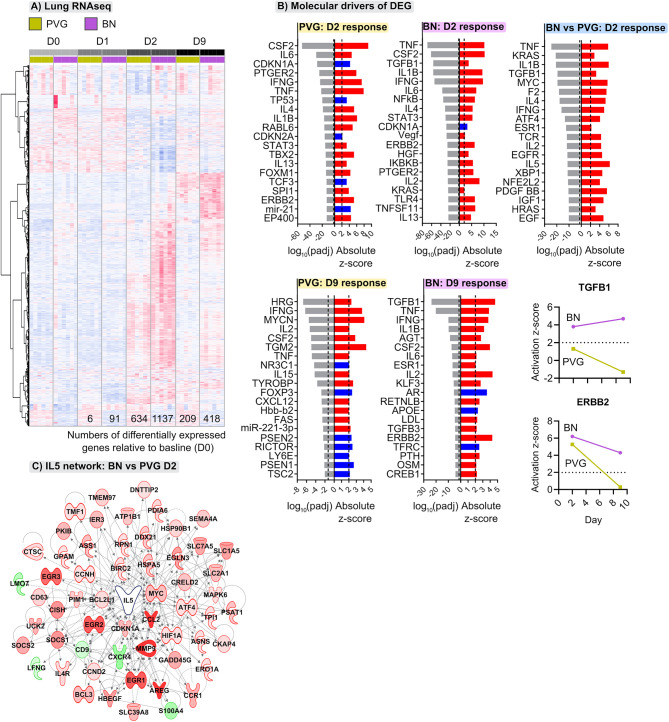
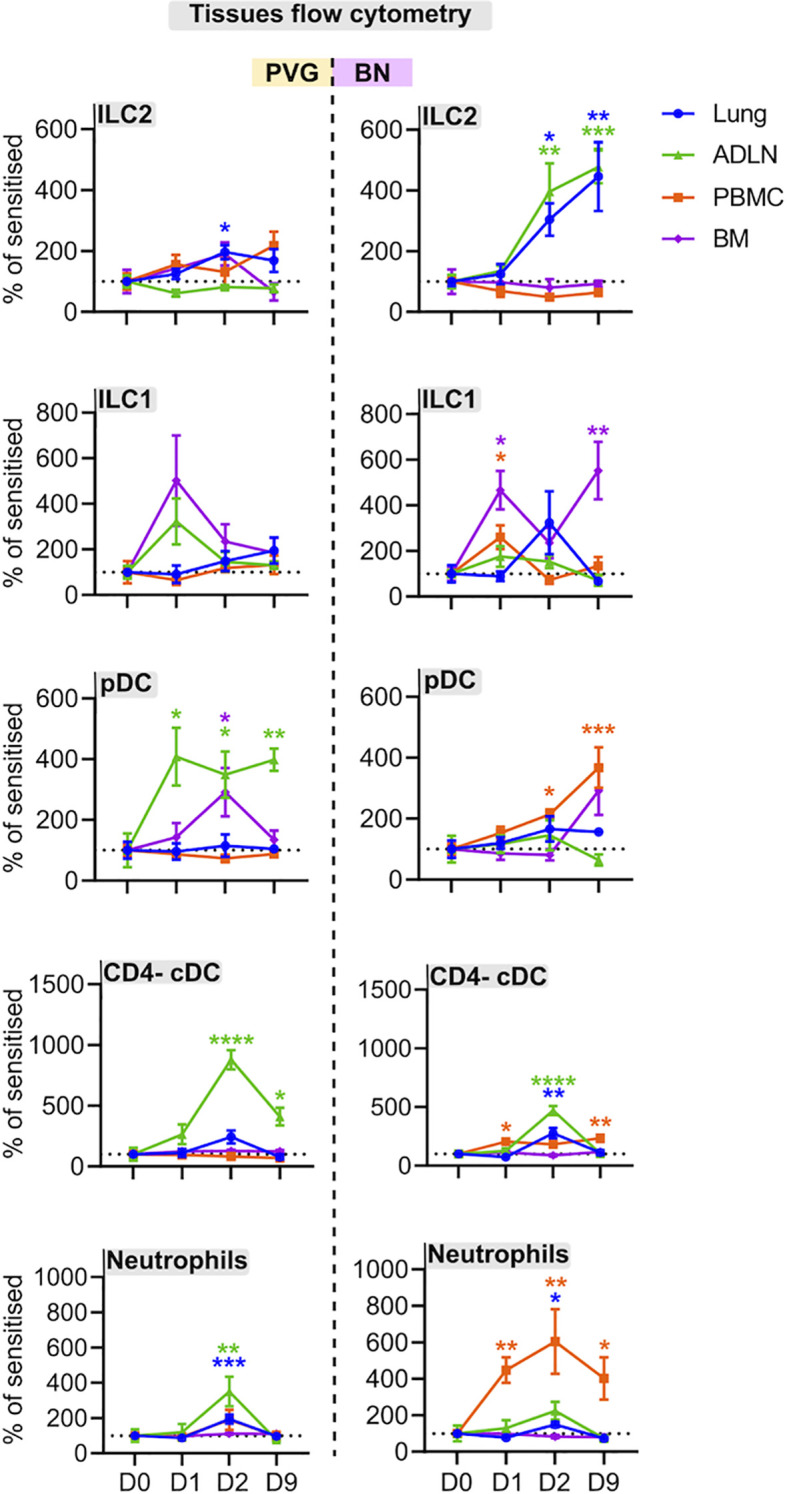
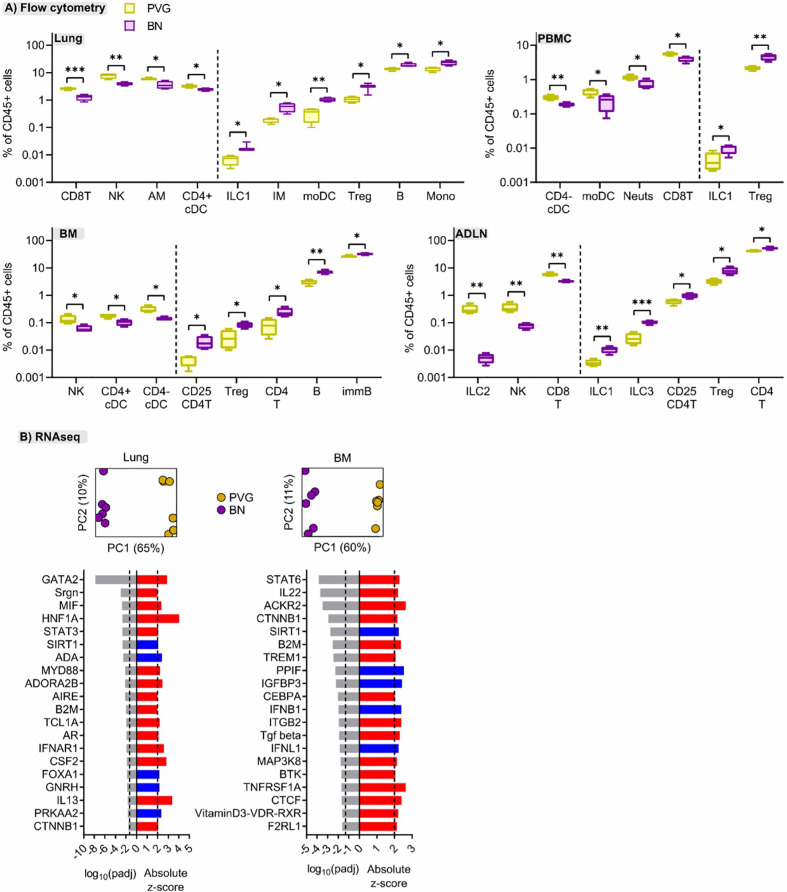
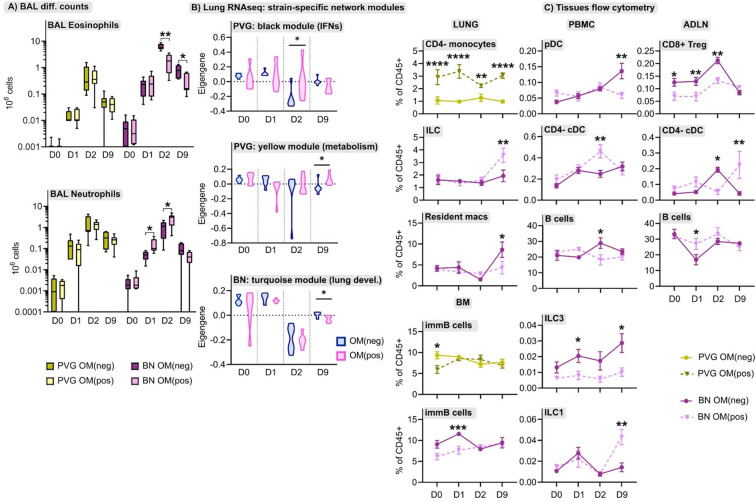
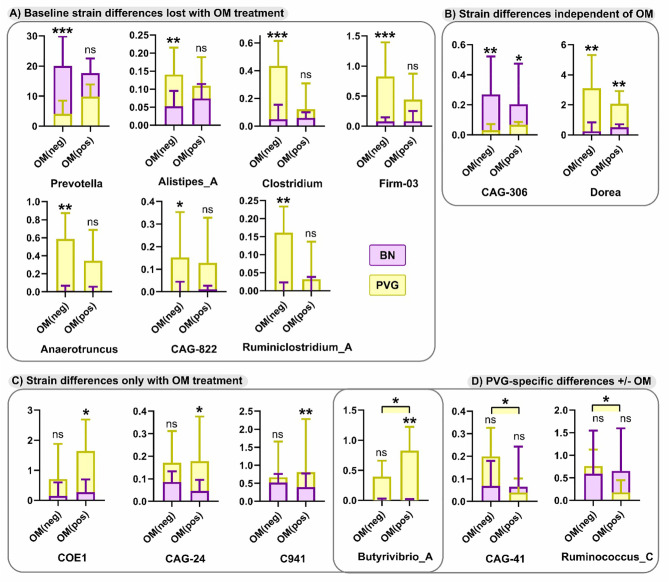
High risk for virus-induced asthma exacerbations in children is associated with an IRF7lo immunophenotype, but the underlying mechanisms are unclear. Here, we applied a Systems Biology approach to an animal model comprising rat strains manifesting high (BN) versus low susceptibility (PVG) to experimental asthma, induced by virus/allergen coexposure, to elucidate the mechanism(s)-of-action of the high-risk asthma immunophenotype. We also investigated potential risk mitigation via pretreatment with the immune training agent OM-85. Virus/allergen coexposure in low-risk PVG rats resulted in rapid and transient airways inflammation alongside IRF7 gene network formation. In contrast, responses in high-risk BN rats were characterized by severe airways eosinophilia and exaggerated proinflammatory responses that failed to resolve, and complete absence of IRF7 gene networks. OM-85 had more profound effects in high-risk BN rats, inducing immune-related gene expression changes in lung at baseline and reducing exaggerated airway inflammatory responses to virus/allergen coexposure. In low-risk PVG rats, OM-85 boosted IRF7 gene networks in the lung but did not alter baseline gene expression or cellular influx. Distinct IRF7-associated asthma risk immunophenotypes have dichotomous responses to virus/allergen coexposure and respond differentially to OM-85 pretreatment. Extrapolating to humans, our findings suggest that the beneficial effects OM-85 pretreatment may preferentially target those in high-risk subgroups.

Keywords: IRF7; allergen; asthma exacerbation; immunomodulation; rhinovirus; systems biology.


Conflict of interest statement

The authors declare that the research was conducted in the absence of any commercial or financial relationships that could be construed as a potential conflict of interest.

Figures

Figure 1
Figure 1
PVG and BN rats exhibit distinct cellular profiles of airways inflammation following virus/allergen coexposure. (A) PVG and BN rats were sensitized with OVA/Alum. Seven days later, rats from each strain were randomly allocated to experimental groups receiving OM-85 for seven consecutive days or nil treatment. All animals apart from a baseline control group (Day 0) were then infected with attenuated mengovirus and challenged with OVA 24hr later. Tissues were harvested at baseline, one day post-infection representing the response to virus alone, and days two and nine post-infection representing the response to virus and allergen co-exposure. The analyses performed included i) differential cell counts on BAL fluid, ii) RNA-Seq on homogenized lung and bone marrow, iii) 14-colour flow cytometry on single-cell suspensions of PBMC, airway draining lymph node, bone marrow and peripheral lung tissue, and iv) assessment of the gut microbiome (prior to virus/allergen coexposure only). Figure created with BioRender.com (B) Enumeration of total cells, eosinophils, neutrophils, lymphocytes, and macrophages in BAL via differential cell counts at baseline and following viral/OVA challenge in PVG and BN rats without OM-85 treatment. Data from more than 3 independent experiments, n = 6–8 per group. Two-way ANOVA with Tukey’s multiple comparisons test were performed to compare data within and between strains. *p < 0.05, **p < 0.01, ***p < 0.001, and ****p < 0.0001. BAL, bronchoalveolar lavage, D0: day 0, D1: day 1, D2: day 2, D9: day 9.
Figure 2
Figure 2
Overview of the global gene networks operating in lung and bone marrow of PVG and BN rats. Separate tissue-specific weighted co-expression gene networks were generated for PVG and BN lung (A, B) and bone marrow (C, D). Dendrograms are shown for each network, where distinct color blocks represent separate functional modules (clusters of correlated or co-expressed genes). Associated module functions are described for each network and the summarized expression of each module (eigengene value) is shown over the course of viral infection and allergen challenge. Modules relating to immune and metabolic pathways are separated (right) from all others (left). Arrows highlight four modules specific to PVG or BN rats. Sample sizes for network construction: BN bone marrow n = 47, PVG bone marrow n = 49, BN lung n = 48, PVG lung n = 47.
Figure 3
Figure 3
Functional gene networks unique to either PVG or BN rats. The four gene network modules unique to either PVG lung (A, B), PVG bone marrow (C) or BN lung (D). Over-represented biological pathways are shown for each module, the red line at 1.3 represents the threshold for significance equivalent to a Bonferroni-corrected p-value <0.05. For each network module, ranks of gene connectivity (reflecting the relative importance of that gene within the network module) and gene expression were calculated for both PVG and BN: correlation plots between rat strains are shown. The top ten predicted molecular drivers are shown for each module, where the dashed line represented the threshold for significance. Prior knowledge network reconstructions are shown for the PVG lung black module (E) and the BN lung green module (F) where red and green coloring indicate increased and decreased expression respectively on day 2 (for E) and day 9 (for F) relative to day 0. Sample sizes for network construction: BN bone marrow n = 47, PVG bone marrow n = 49, BN lung n = 48, PVG lung n = 47.
Figure 4
Figure 4
Distinct transcriptional changes occur in lungs of PVG and BN rats following viral- and allergen-exposure. (A) Heatmap visualizing the union of differentially expressed genes induced following viral infection and OVA challenge within either PVG or BN rats; genes ranked using unsupervised hierarchical clustering. Red and blue coloring indicate relative increased or decreased expression for each gene, respectively. Data from more than 3 independent experiments with n=6 per time point. (B) The top twenty predicted upstream transcriptional regulators of the differentially expressed genes at day two and nine. Red and blue indicate predicted activation (Z-score > 2) and inhibition (Z-score < -2), respectively. P-values were adjusted for multiple comparisons using the Benjamini-Hochberg method; the dashed line at -1.3 represents the threshold for significance. Activation Z-scores for TGFB1 and ERBB2 are compared between strains over the course of infection and allergen challenge. (C) Network wiring diagram for IL5 where nodes are colored based on comparison between BN and PVG day 2 responses; red and green indicate increased and decreased expression in BN relative to PVG on day 2, respectively.
Figure 5
Figure 5
PVG and BN rats display differential cellular recruitment into tissues following challenge with virus and allergen. Flow cytometric analysis of lung, bone marrow, airway draining lymph node (ADLN), and PBMC over the course of viral infection and allergen challenge. Data are presented as the percentage of CD45+ cells (mean ± standard error of the mean) normalized to Day 0, from more than 3 independent experiments with n = 4-6 per strain, tissue, and time point. One-way ANOVA with Dunnett’s multiple comparisons test was performed to determine differences at each time point relative to baseline, within PVG and BN separately. *p < 0.05, **p < 0.01, ***p < 0.001, and ****p < 0.0001.
Figure 6
Figure 6
Cellular and molecular differences are evident between sensitized PVG and BN rats. (A) Flow cytometric analysis of lung, bone marrow (BM), airway draining lymph node (ADLN), and PBMC revealed differences in the proportions of several immune cell types at baseline (day 0, untreated) between strains. Data from more than 2 independent experiments with n = 4 per strain, T-tests comparing PVG (yellow) and BN (purple) rats were performed for each cell type within each tissue; *p < 0.05, **p < 0.01, and ***p < 0.001. (B) Principal component analysis using the top 1000 variable genes across samples revealed distinct separation between PVG and BN rats, in both tissues (Data from more than 2 independent experiments with n = 6 each). The top twenty predicted upstream transcriptional regulators of the differentially expressed genes between PVG and BN rats are presented. Red and blue indicate predicted activation (Z-score > 2) and inhibition (Z-score < -2), respectively. P-values were adjusted for multiple comparisons using the Benjamini-Hochberg method. The dashed line at -1.3 represents the threshold for significance.
Figure 7
Figure 7
The effect of OM-85 on responses to virus and allergen. (A) Enumeration of eosinophils and neutrophils in BAL via differential cell counts at baseline, and following the course of viral infection and allergen challenge in PVG and BN rats with and without OM-85 pretreatment. Data from more than 3 independent experiments with n = 5-6 per strain, treatment group and time point. (B) The effect of OM-85 pretreatment on gene networks within lung tissue, presented as violin plots of summarized gene expression (eigengene values). Data from more than 3 independent experiments with n = 6 per strain and treatment group. (C) Flow cytometric analysis of lung, PBMC, airway draining lymph node (ADLN) and bone marrow over the course of viral infection and allergen challenge with and without OM-85 treatment. Data are presented as mean ± standard error of the mean, from more than 3 independent experiments with n = 3-7. Statistical comparisons between OM(pos) and OM(neg) samples were performed using one-way ANOVA with Sidak’s multiple comparisons tests in (A) and (C), and Mann-Whitney tests in (B). *p < 0.05, **p < 0.01, ***p < 0.001, and ****p < 0.0001.
Figure 8
Figure 8
Differences in the microbiome between PVG and BN rats at with and without OM-85 treatment. The effect of OM-85-pretreatment on the microbiome at genus-level. Observed differences were either; evident at baseline (Day 0) without treatment, but no longer different between strains with OM-85 treatment (A), evident between strains independent of OM-85 treatment (B), only evident between BN and PVG rats with OM-85 treatment (C), or evident within PVG rats when comparing treatment groups (D). Results are presented as relative abundance; bars show median and upper quartile from more than 3 independent experiments with n = 12 per group. NS, not significant; *p < 0.05, **p < 0.01 and ***p < 0.001.

Similar articles

Cited by

References

    1. Bizzintino J, Lee WM, Laing IA, Vang F, Pappas T, Zhang G, et al. . Association Between Human Rhinovirus C and Severity of Acute Asthma in Children. Eur Respir J (2011) 37(5):1037–42. 10.1183/09031936.00092410 - DOI - PMC - PubMed
    1. Gern JE. Immune Responses to Rhinoviruses and Asthma: Are We Three Steps Closer to the Door? J Allergy Clin Immunol (2020) 146(3):513–4. 10.1016/j.jaci.2020.06.031 - DOI - PubMed
    1. Sly PD, Boner AL, Björksten B, Bush A, Custovic A, Eigenmann PA, et al. . Early Identification of Atopy in the Prediction of Persistent Asthma in Children. Lancet (2008) 372(9643):1100–6. 10.1016/S0140-6736(08)61451-8 - DOI - PMC - PubMed
    1. Khoo SK, Read J, Franks K, Zhang G, Bizzintino J, Coleman L, et al. . Upper Airway Cell Transcriptomics Identify a Major New Immunological Phenotype With Strong Clinical Correlates in Young Children With Acute Wheezing. J Immunol (2019) 202(6):1845–58. 10.4049/jimmunol.1800178 - DOI - PubMed
    1. Lauzon-Joset JF, Jones AC, Mincham KT, Thomas JA, Rosenthal LA, Bosco A, et al. . Atopy-Dependent and Independent Immune Responses in the Heightened Severity of Atopics to Respiratory Viral Infections: Rat Model Studies. Front Immunol (2018) 9:1805. 10.3389/fimmu.2018.01805 - DOI - PMC - PubMed

Publication types