Comparative Study
. 2021 Jul 21:12:705197.
doi: 10.3389/fimmu.2021.705197. eCollection 2021.

Sex Matters: Physiological Abundance of Immuno-Regulatory CD71+ Erythroid Cells Impair Immunity in Females

Affiliations
Comparative Study

Sex Matters: Physiological Abundance of Immuno-Regulatory CD71+ Erythroid Cells Impair Immunity in Females

Siavash Mashhouri et al. Front Immunol. .

Abstract

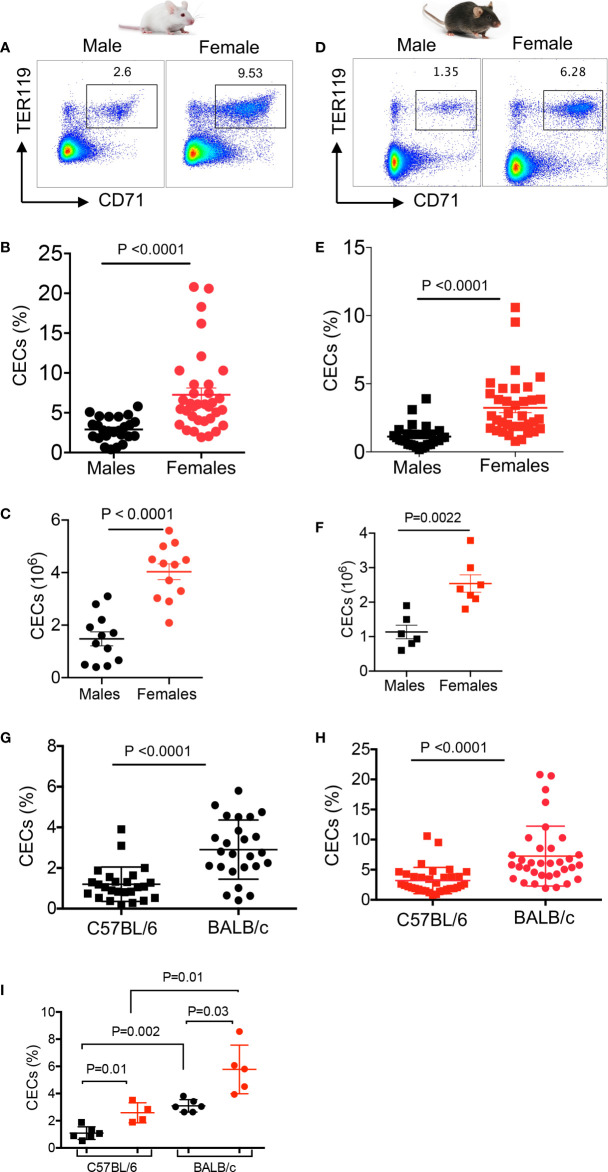
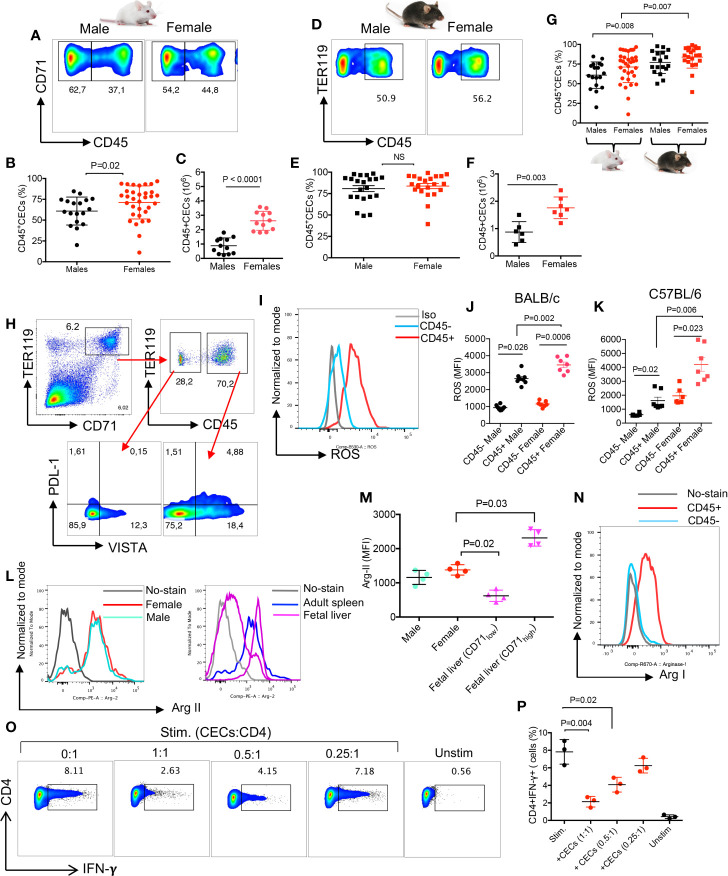
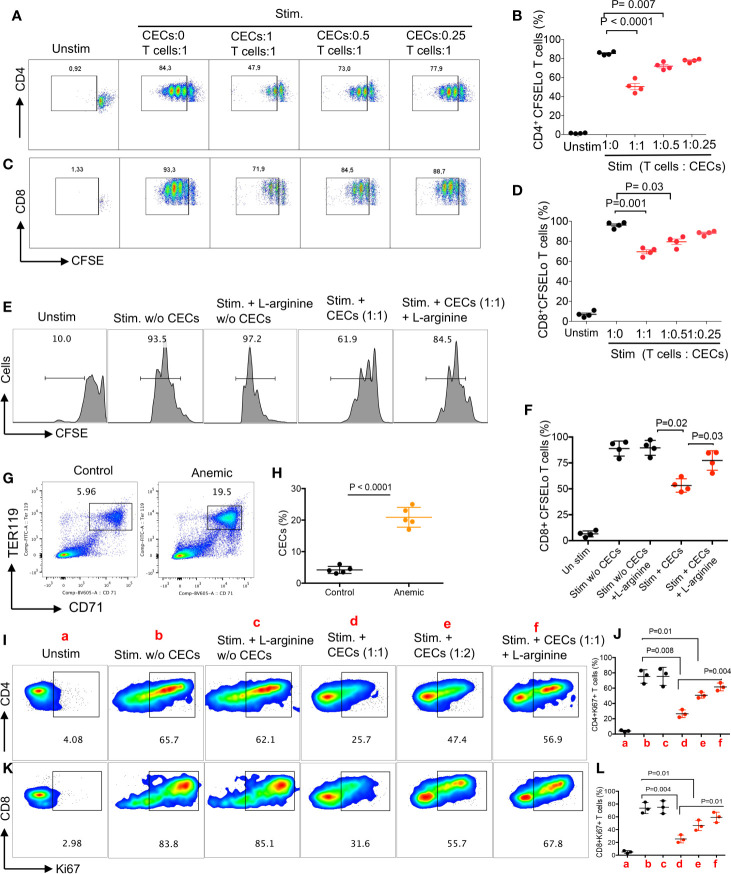
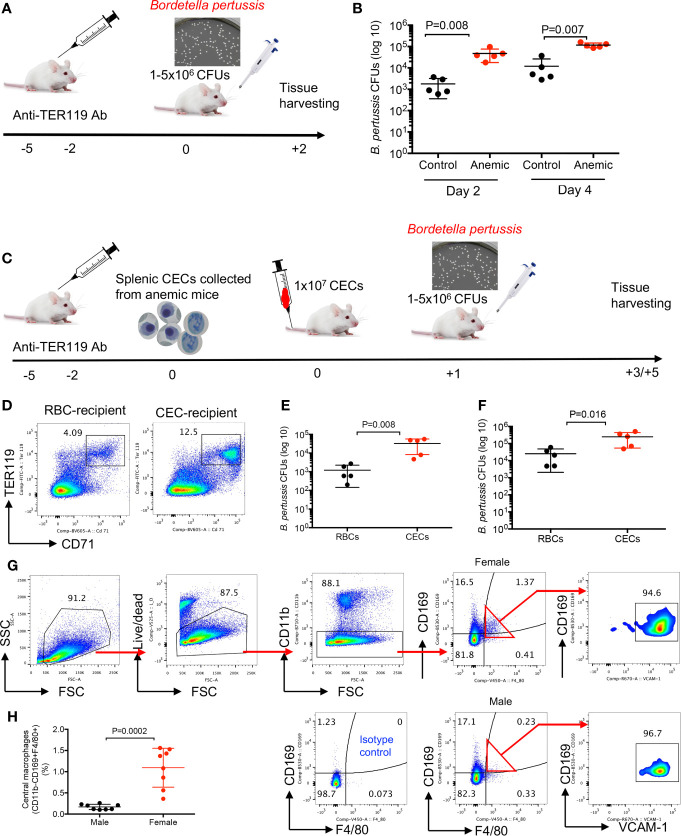
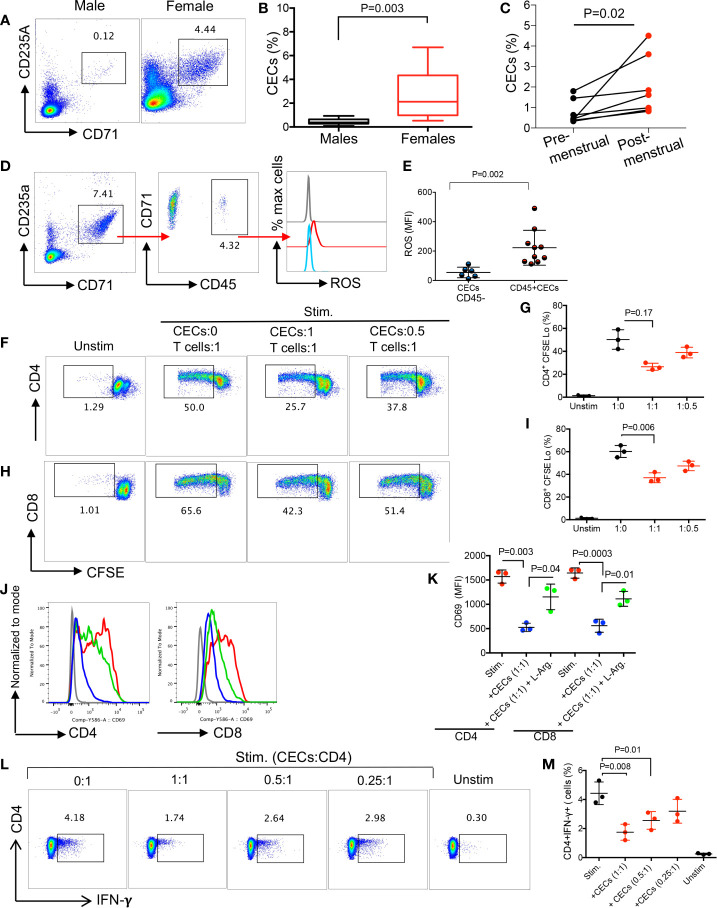
Mature erythrocytes are the major metabolic regulators by transporting oxygen throughout the body. However, their precursors and progenitors defined as CD71+ Erythroid Cells (CECs) exhibit a wide range of immunomodulatory properties. Here, we uncover pronounced sexual dimorphism in CECs. We found female but not male mice, both BALB/c and C57BL/6, and human females were enriched with CECs. CECs, mainly their progenitors defined as CD45+CECs expressed higher levels of reactive oxygen species (ROS), PDL-1, VISTA, Arginase II and Arginase I compared to their CD45- counterparts. Consequently, CECs by the depletion of L-arginine suppress T cell activation and proliferation. Expansion of CECs in anemic mice and also post-menstrual cycle in women can result in L-arginine depletion in different microenvironments in vivo (e.g. spleen) resulting in T cell suppression. As proof of concept, we found that anemic female mice and mice adoptively transferred with CECs from anemic mice became more susceptible to Bordetella pertussis infection. These observations highlight the role of sex and anemia-mediated immune suppression in females. Notably, enriched CD45+CECs may explain their higher immunosuppressive properties in female BALB/c mice. Finally, we observed significantly more splenic central macrophages in female mice, which can explain greater extramedullary erythropoiesis and subsequently abundance of CECs in the periphery. Thus, sex-specific differences frequency in the frequency of CECs might be imprinted by differential erythropoiesis niches and hormone-dependent manner.

Keywords: CD71+ erythroid cells; anemia and immunity; anemia and infection; females; immune system and sex.


Conflict of interest statement

The authors declare that the research was conducted in the absence of any commercial or financial relationships that could be construed as a potential conflict of interest.

Figures

Figure 1
Figure 1
Higher frequency of CECs in female versus male mice. (A) Representative flow cytometry plots, (B) cumulative data of percentages, and (C) absolute numbers of CECs in spleens of BALB/c male and female mice. (D) Representative flow cytometry plots, (E) cumulative data of percentages, and (F) absolute numbers of CECs in spleens of C57BL/6 male and female mice. (G) Cumulative data comparing percentages of CECs in spleens of C57BL/6 and BALB/c male mice. (H) Cumulative data comparing percentages of CECs in spleens of C57BL/6 and BALB/c female mice. (I) Cumulative data comparing percentages of CECs in spleens of C57BL/6 male and female, and BALB/c male and female littermates at 8 weeks old. Each point represents data from an individual mouse, representative of at least three independent experiments. Bar, mean ± standard error.
Figure 2
Figure 2
CECs in adult mice express Arg II and ROS and suppress IFN-γ production by T cell. (A) Representative flow cytometry plots, (B) cumulative data of percentages, and (C) absolute numbers of CD45+/CD45-CECs in the spleen of BALB/c male and female mice. (D) Representative flow cytometry plots, (E) cumulative data of percentages, and (F) absolute numbers of CD45+/CD45−CECs in the spleen of C57BL/6 male and female mice. (G) Cumulative data comparing percentages of CD45+CECs in spleens of BALB/c and C57BL/6 male and female mice. (H) Representative flow cytometry plot of PDL-1 and VISTA expression in CD45− and CD45+ CECs from a female BALB/c mouse. (I) Histogram plots, and (J) cumulative data of the mean fluorescence intensity (MFI) for ROS expression in CD45− and CD45+CECs in male and female BALB/c mice. (K) Cumulative data of MFI for ROS expression in CD45+ BALB/c male and female C57BL/6 mice. (L) Histogram plots, and (M) cumulative data of Arg II expression (MFI) in total CECs in male versus female mice compared to fetal liver CD71low and CD71high CECs. (N) Representative histogram plot of Arg I expression in splenic CD45+ and CD45−CECs of a female BALB/c mouse. (O) Representative flow plots, and (P) cumulative data of IFN-γ production by CD4+ T cells in the absence or presence of CECs at different ratios (CECs : CD4) after stimulation with anti-CD3/CD28 antibodies for 6 h. Unstimulated (Unstim), stimulated with anti-CD3/CD28 (stim). Each point represents data from an individual mouse, representative of at least three independent experiments. Bar, mean ± standard error.
Figure 3
Figure 3
CECs from female mice suppress T cell activation and proliferation. (A) Representative flow cytometry plots, and (B) cumulative data of CD4+ T cell proliferation as measured by CFSE dilution in the absence or presence of CECs at indicated ratios following stimulation with anti-CD3/CD28 for 3 days. (C) Representative flow cytometry plots, and (D) cumulative data of CD8+ T cell proliferation in the absence or presence of CECs at indicated ratios following stimulation with anti-CD3/CD28 for 3 days. (E) Representative flow cytometry plots, and (F) cumulative data of CD8+ T cell proliferation in the absence or presence of CECs at indicated ratios following stimulation with anti-CD3/CD28 for 3 days with or without (w/o) L-arginine supplementation (2 mM). (G) Representative flow cytometry plots, and (H) cumulative data of CECs in untreated (control) versus treated female mice with the anti-TER-119 antibody. (I) Representative flow cytometry plots, and (J) cumulative data for Ki67 expression in CD4+ T cells following stimulation for 24 h with anti-CD3/CD28, in the absence or presence of CECs (different indicated ratios) and with or without (w/o) supplementation with L-arginine (2 mM). (K) Representative flow cytometry plots, and (L) cumulative data for Ki67 expression in CD8+ T cells following stimulation for 24 h with anti-CD3/CD28, in the absence or presence of CECs (different indicated ratios) and with or without (w/o) supplementation with L-arginine (2 mM). Each point represents data from an individual mouse, representative of at least three independent experiments. Bar, mean ± standard error.
Figure 4
Figure 4
Anemia and anemic-induced CECs enhance susceptibility to infection in female mice. (A) A schematic representation of the anti-TER119 antibody treatment and intranasal infection of mice with B. pertussis bacteria. (B) Cumulative data of number of isolated B. pertussis shown as colony forming units (CFUs) from the lung homogenates of control (IgG2b-treated) and anemic (anti-TER119-treated) mice 2 and 4 days’ post-infection. (C) A schematic representation of the anti-TER119 antibody treatment, isolation of splenic CECs, tail vein injection of CECs and intranasal infection of mice with B. pertussis. (D) Representative flow cytometry plots of percentages of CECs in the spleen of control versus CEC-treated female mouse. (E) Cumulative data of number of isolated B. pertussis from the lung homogenates of control (RBC-injected) and CEC-injected mice 2, and (F) 4 days’ post-infection. (G) Representative flow cytometry plots, and (H) cumulative data of central macrophages in female versus male mice. Each point represents data from an individual mouse, representative of at least two independent experiments. Bar, mean ± standard error.
Figure 5
Figure 5
CECs are more abundant in human females and suppress T cell activation and IFN-γ production. (A) Representative flow cytometry plots, and (B) cumulative data of percentages of CECs in males versus females (>15 subjects/group). (C) Cumulative data of % CECs in females pre-and post-menstrual cycle. (D) Representative flow cytometry plots of percent CD45+ subpopulation and ROS expression in CECs. (E) Cumulative data of MFI for ROS expression in CD45− and CD45+ CECs in women. (F) Representative flow cytometry plots, and (G) cumulative data of CD4+ T cell proliferation as measured by CFSE dilution in the absence or presence of CECs at indicated ratios following stimulation with anti-CD3/CD28 for 3 days. (H) Representative flow cytometry plots, and (I) cumulative data of CD8+ T cell proliferation in the absence or presence of CECs at indicated ratios following stimulation with anti-CD3/CD28 for 3 days. (J) Histogram plots, and (K) cumulative data of CD69 expression on CD4+ and CD8+ T cells in the absence or presence (1:1 ratio) of CECs following stimulation with anti-CD3/CD28 for 24 h with or without supplementation with L-arginine (2 mM) in females. (L) Representative flow plots, and (M) cumulative data of IFN-γ production by CD4+ T cells in the absence or presence of CECs at different ratios (CECs : CD4) after stimulation with anti-CD3/CD28 for 6 h. Unstimulated (Unstim), stimulated with anti-CD3/CD28 (stim). Each point represents data from an individual woman, data are from three different study subjects. Bar, mean ± standard error.

Similar articles

Cited by

References

    1. Vogenberg FR, Isaacson Barash C, Pursel M. Personalized Medicine: Part 1: Evolution and Development Into Theranostics. P T (2010) 35(10):560–76. 10.1161/JAHA.117.006245 - DOI - PMC - PubMed
    1. Brown MA, Su MA. An Inconvenient Variable: Sex Hormones and Their Impact on T Cell Responses. J Immunol (2019) 202(7):1927–33. 10.4049/jimmunol.1801403 - DOI - PMC - PubMed
    1. Klein SL, Flanagan KL. Sex Differences in Immune Responses. Nat Rev Immunol (2016) 16(10):626–38. 10.1038/nri.2016.90 - DOI - PubMed
    1. Berghofer B, Frommer T, Haley G, Fink L, Bein G, Hackstein H. TLR7 Ligands Induce Higher IFN-Alpha Production in Females. J Immunol (2006) 177(4):2088–96. 10.4049/jimmunol.177.4.2088 - DOI - PubMed
    1. Griesbeck M, Ziegler S, Laffont S, Smith N, Chauveau L, Tomezsko P, et al. . Sex Differences in Plasmacytoid Dendritic Cell Levels of IRF5 Drive Higher IFN-Alpha Production in Women. J Immunol (2015) 195(11):5327–36. 10.4049/jimmunol.1501684 - DOI - PMC - PubMed

Publication types

MeSH terms

Grants and funding