. 2021 Jul 23:12:706517.
doi: 10.3389/fimmu.2021.706517. eCollection 2021.

Adenovirus Armed With TNFa and IL2 Added to aPD-1 Regimen Mediates Antitumor Efficacy in Tumors Refractory to aPD-1

Affiliations

Adenovirus Armed With TNFa and IL2 Added to aPD-1 Regimen Mediates Antitumor Efficacy in Tumors Refractory to aPD-1

Victor Cervera-Carrascon et al. Front Immunol. .

Abstract

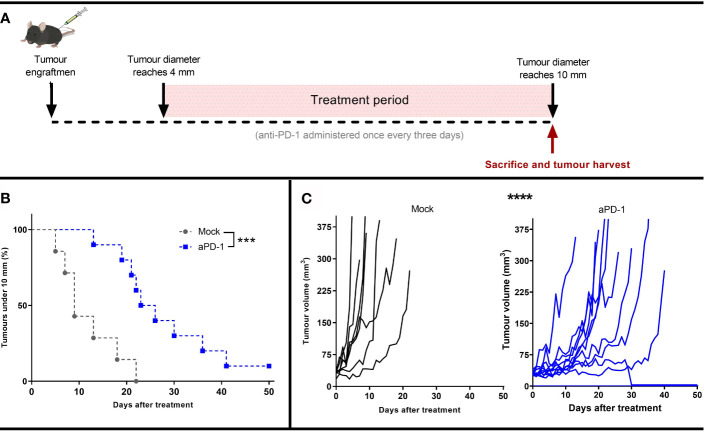
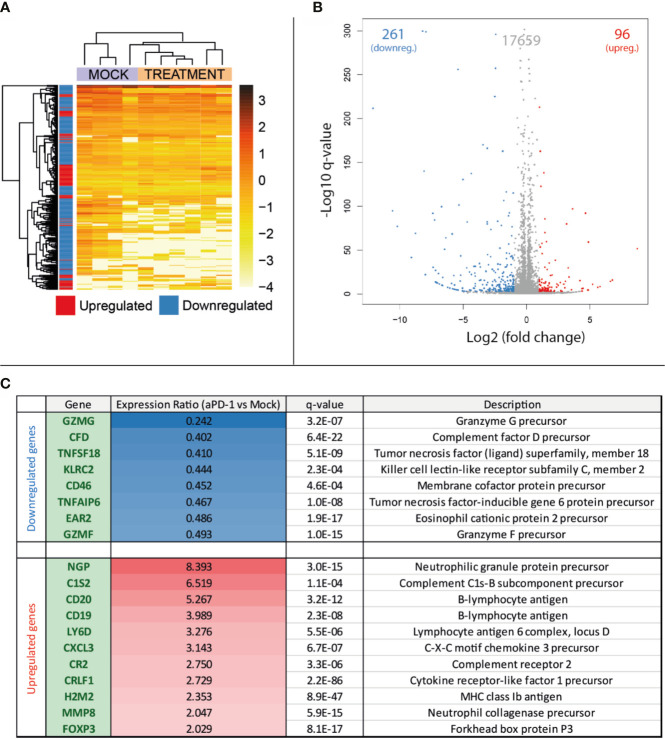
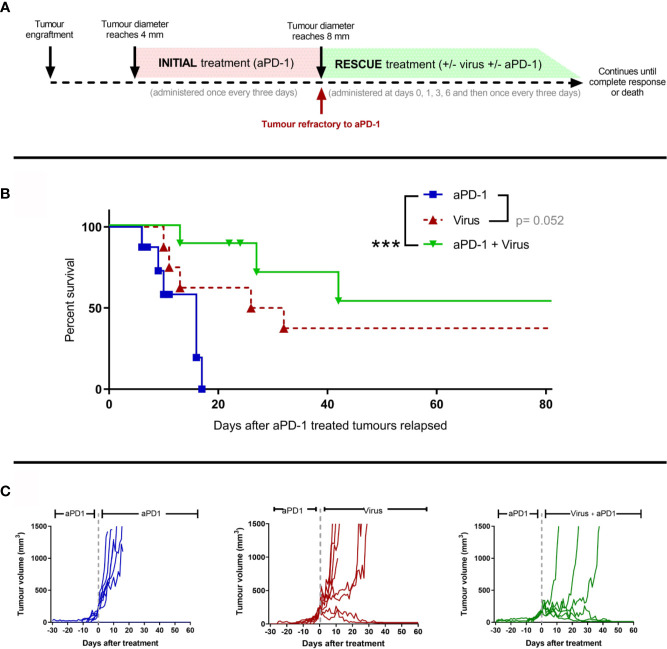
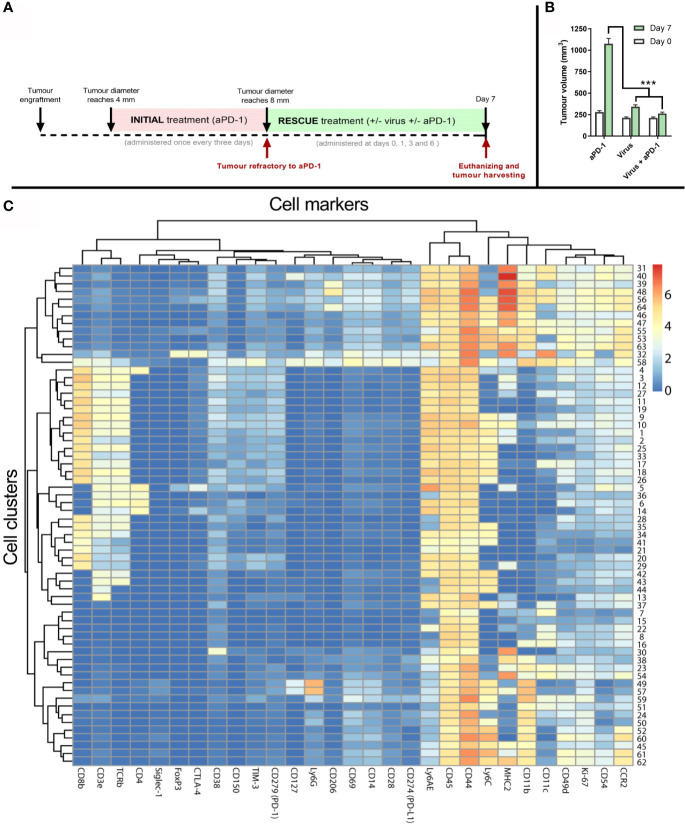
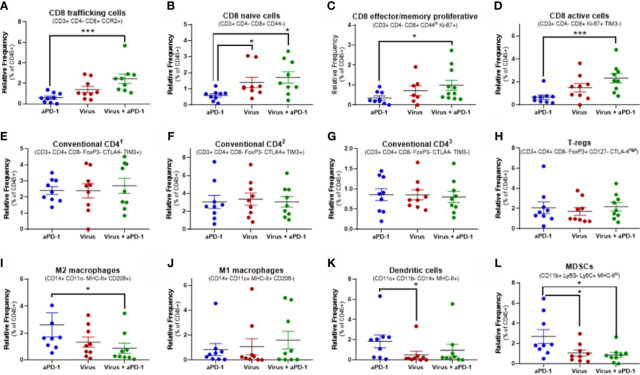
Immune checkpoint inhibitors such as anti-PD-1 have revolutionized the field of oncology over the past decade. Nevertheless, the majority of patients do not benefit from them. Virotherapy is a flexible tool that can be used to stimulate and/or recruit different immune populations. T-cell enabling virotherapy could enhance the efficacy of immune checkpoint inhibitors, even in tumors resistant to these inhibitors. The T-cell potentiating virotherapy used here consisted of adenoviruses engineered to express tumor necrosis factor alpha and interleukin-2 in the tumor microenvironment. To study virus efficacy in checkpoint-inhibitor resistant tumors, we developed an anti-PD-1 resistant melanoma model in vivo. In resistant tumors, adding virotherapy to an anti-PD-1 regimen resulted in increased survival (p=0.0009), when compared to anti-PD-1 monotherapy. Some of the animals receiving virotherapy displayed complete responses, which did not occur in the immune checkpoint-inhibitor monotherapy group. When adenoviruses were delivered into resistant tumors, there were signs of increased CD8 T-cell infiltration and activation, which - together with a reduced presence of M2 macrophages and myeloid-derived suppressor cells - could explain those results. T-cell enabling virotherapy appeared as a valuable tool to counter resistance to immune checkpoint inhibitors. The clinical translation of this approach could increase the number of cancer patients benefiting from immunotherapies.

Keywords: adenovirus; cancer immunotherapy; checkpoint inhibitor resistance; oncolytic virus; tumor microenvironment.


Conflict of interest statement

AH is shareholder in Targovax ASA (Oslo, Norway) and in TILT Biotherapeutics Ltd. (Helsinki, Finland). AH, RH, SS, JS, and VC-C are employees of TILT Biotherapeutics Ltd. IM is employed by Orca Therapeutics, Ltd. The remaining authors declare that the research was conducted in the absence of any commercial or financial relationships that could be construed as a potential conflict of interest.

Figures

Figure 1
Figure 1
Development of an in vivo model refractory to aPD-1. (A) Experimental design: 17 mice were engrafted with subcutaneous B16.OVA tumors (2.5 x 10⁵ cells/animal). When those tumors reached 4 mm in maximum diameter, the animals were assigned to Mock (n=7) or to aPD-1 group (n=10). 0.1 mg of aPD-1 (or PBS) was given intraperitoneally every three days. When tumors progressed over 10 mm, animals were sacrificed. (B) Percentage of animals with a tumor under 10 mm after they started treatment. (C) Individual tumor growth curves for both groups. (Kaplan-Meier, Log rank Mantel-Cox test; ***p < 0.001, ****p < 0.0001).
Figure 2
Figure 2
Comparison at the gene expression level of treatment naïve progressing tumors and tumors progressing after aPD-1 therapy. Animals treated as described in Figure 1A were sacrificed and tumors harvested when they were considered refractory to aPD-1. RNA was extracted and expression profiles from both groups were compared. (A) Heatmap and unsupervised clustering of samples. (B) Volcano plot for the expression level comparison between treatment naïve and aPD-1 treated tumors. (C) Immune related significantly regulated genes. (Differences in gene regulations were taken into account if fold change was ≤-2 or ≥2, with a q-value ≤ 0.001).
Figure 3
Figure 3
The use of an engineered adenovirus is able to trigger tumor growth control in aPD-1 refractory tumors. (A) Experimental design: 29 mice were engrafted subcutaneously with 2.5 x 10⁵ B16.OVA tumor cells. When those tumors reached 4 mm in maximum diameter, they started receiving 0.1 mg of aPD-1 every three days intraperitoneally. When tumors progressed over 8 mm, animals were assigned to a group where they were treated with the same aPD-1 regimen (n=8), with 1x10⁸ VP intratumorally once every three days (n=8), or both (n= 8). Treatments continued until complete responses were observed or sacrifice criteria was reached. (B) Cancer-specific survival. (C) Individual tumor growth curves for the groups. (Kaplan-Meier, Log rank Mantel-Cox test; ***p < 0.001).
Figure 4
Figure 4
Tumor samples and analysis to study mechanism of action of the treatments. (A) Experimental design: 27 mice carrying B16.OVA tumors were treated with aPD-1 until they became refractory to the drug as described previously. Subsequently, those animals were assigned to groups where animals were treated with the same aPD-1 regimen (n=9), with 1x10⁸ VP intratumorally once every three days (n=9), or both (n= 9). Four rounds of treatments were given at days 0, 1, 3 and 6 after they were considered refractory and sacrificed at day 7 for tumor collection. (B) Average tumor volumes (and SEM) at day 0 (when they qualified as refractory) and day 7 (when tumors were harvested). (C) Heatmap after the analysis of tumors by CyTOF and subsequent processing of the data by FLOWSOM providing 64 different cell clusters for immune (CD45+) cells. (Mann Whitney test; ***p < 0.001).
Figure 5
Figure 5
Changes in key immune populations after virotherapy assessed by mass cytometry and cluster analysis. Unbiased cell cluster generation from CD45+ fraction rendered multiple clusters that were associated to a cell type or phenotype. Relative percentage of those clusters among experimental groups were compared using Mann-Whitney test (average value and SEM included). Key markers to identify the cluster identity are indicated. (A) cluster 25. (B) cluster 41. (C) cluster 10. (D) cluster 17. (E) cluster 6. (F) cluster 14. (G) cluster 36. (H) cluster 5. (I) cluster 39. (J) cluster 58. (K) cluster 32. (L) cluster 55. *p < 0.05; ***p < 0.001.

Similar articles

Cited by

References

    1. Ledford H, Else H, Warren M. Cancer Immunologists Scoop Medicine Nobel Prize. Nature (2018) 562(7725):20–1. 10.1038/d41586-018-06751-0 - DOI - PubMed
    1. Mazzarella L, Duso BA, Trapani D, Belli C, D’Amico P, Ferraro E, et al. . The Evolving Landscape of ‘Next-Generation’ Immune Checkpoint Inhibitors: A Review. Eur J Cancer (2019) 117:14–31. 10.1016/j.ejca.2019.04.035 - DOI - PubMed
    1. Haslam A, Prasad V. Estimation of the Percentage of US Patients With Cancer Who Are Eligible for and Respond to Checkpoint Inhibitor Immunotherapy Drugs. JAMA Netw Open (2019) 2(5):e192535. 10.1001/jamanetworkopen.2019.2535 - DOI - PMC - PubMed
    1. Pacheco JM, Camidge DR, Doebele RC. Schenk E. A Changing of the Guard: Immune Checkpoint Inhibitors With and Without Chemotherapy as First Line Treatment for Metastatic Non-Small Cell Lung Cancer. Front Oncol (2019) 9:195. 10.3389/fonc.2019.00195 - DOI - PMC - PubMed
    1. Hu-Lieskovan S, Ribas A. New Combination Strategies Using Programmed Cell Death 1/Programmed Cell Death Ligand 1 Checkpoint Inhibitors as a Backbone. Cancer J (2017) 23(1):10–22. 10.1097/PPO.0000000000000246 - DOI - PMC - PubMed

Publication types

MeSH terms

Substances