. 2021 Jul 23:12:677728.
doi: 10.3389/fpls.2021.677728. eCollection 2021.

Ultra-High-Density QTL Marker Mapping for Seedling Photomorphogenesis Mediating Arabidopsis Establishment in Southern Patagonia

Affiliations

Ultra-High-Density QTL Marker Mapping for Seedling Photomorphogenesis Mediating Arabidopsis Establishment in Southern Patagonia

Daniel Matsusaka et al. Front Plant Sci. .

Abstract

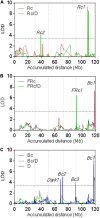
Arabidopsis thaliana shows a wide range of genetic and trait variation among wild accessions. Because of its unparalleled biological and genomic resources, Arabidopsis has a high potential for the identification of genes underlying ecologically important complex traits, thus providing new insights on genome evolution. Previous research suggested that distinct light responses were crucial for Arabidopsis establishment in a peculiar ecological niche of southern Patagonia. The aim of this study was to explore the genetic basis of contrasting light-associated physiological traits that may have mediated the rapid adaptation to this new environment. From a biparental cross between the photomorphogenic contrasting accessions Patagonia (Pat) and Columbia (Col-0), we generated a novel recombinant inbred line (RIL) population, which was entirely next-generation sequenced to achieve ultra-high-density saturating molecular markers resulting in supreme mapping sensitivity. We validated the quality of the RIL population by quantitative trait loci (QTL) mapping for seedling de-etiolation, finding seven QTLs for hypocotyl length in the dark and continuous blue light (Bc), continuous red light (Rc), and continuous far-red light (FRc). The most relevant QTLs, Rc1 and Bc1, were mapped close together to chromosome V; the former for Rc and Rc/dark, and the latter for Bc, FRc, and dark treatments. The additive effects of both QTLs were confirmed by independent heterogeneous inbred families (HIFs), and we explored TZP and ABA1 as potential candidate genes for Rc1 and Bc1QTLs, respectively. We conclude that the Pat × Col-0 RIL population is a valuable novel genetic resource to explore other adaptive traits in Arabidopsis.

Keywords: Arabidopsis; HIFs; Patagonia; QTL; RILs; seedling de-etiolation.


Conflict of interest statement

The authors declare that the research was conducted in the absence of any commercial or financial relationships that could be construed as a potential conflict of interest.

Figures

FIGURE 1
FIGURE 1
Hypocotyl length for seedling de-etiolation in Col-0 and Pat. Hypocotyl length as (A) absolute or (B) relative to dark for Col-0 and Pat accessions in R, FR, and B continuous light (Rc = 30 μmol m-2 s-1, FRc = 0.5 μmol m-2 s-1, and Bc = 1 μmol m-2 s-1, respectively). Data are shown as means and SE and significant differences between means are indicated with different letters (LSD test, p-value < 0.05). (C) Photo shows representative seedlings in each light treatment.
FIGURE 2
FIGURE 2
Genetic characterization of Col-0 × Pat RIL population. (A) Frequency of allele occurrence for each genotyped marker across the population in each Arabidopsis chromosome. Figures show the distribution of markers as Col-0 or Pat segregation (green and red color, respectively), between 0 (no occurrence) and 1 (100% occurrence in the population). In all chromosomes, the markers ranked for Col-0 or Pat alleles between 35 and 65% occurrence, with the exception for the upper arm of chromosome IV (data not shown). (B) Pairwise recombination fractions and LOD scores for all pairs of markers are shown in the upper-left and in the lower-right triangles, respectively, for the five chromosomes. High correlation between markers indicates marker linkage shown in yellow color, while low correlation values indicating unlinked markers is shown in the blue color. The 920 available markers are numerically assigned and placed in physical genetic order, while each chromosome is limited by vertical and horizontal lines.
FIGURE 3
FIGURE 3
Quantitative trait loci mapping for seedling de-etiolation. QTL mapping for (A) Rc and Rc/dark, (B) FRc and FRc/dark, and (C) Bc, Bc/dark, and dark. LOD score is shown for the accumulated distance of the five chromosomes separated by vertical dashed lines. The horizontal dashed line indicates the significance threshold value.
FIGURE 4
FIGURE 4
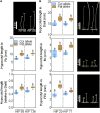
Rc1 and Bc1 QTL confirmation by two independent HIFs. (A) Hypocotyl length for seedlings grown in Rc and Rc/dark of two independent HIF88 and HIF136 segregating as Col-0 and Pat alleles at the Rc1 QTL. (B) Hypocotyl length for seedlings grown in dark, Bc, and FRc in two independent HIF20 and HIF71 segregating as Col-0 and Pat alleles at the Bc1 QTL. Box and whisker diagrams depict data around the median, while distinct letters indicate significant differences between means analyzed by LSD test (p-value < 0.05). Photos show representative seedlings in each light trait for HIFs segregating as Col-0 (left) and Pat (right).
FIGURE 5
FIGURE 5
TZP1 and ABA1 as candidate genes for Rc1 and Bc1 QTLs, respectively. (A) Seedling hypocotyl length was measured under Rc and Rc/dark conditions for accessions Ting-1 (CS76612), Tamm-2 (CS76610), Tamm-27 (CS77341), Sq-1 (CS77266), Got-22 (CS76884), Chat-1 (CS76463), and Ts-1 (CS76615) that shared some or all TZP-Pat polymorphisms; and in parallel tzp-1 and tzp-2 with corresponding Col-0 as a control. (B) Seedling hypocotyl length was measured under dark, Bc, and FRc conditions for accessions RRS-10 (CS76592), Ag-0 (CS76430), Pna-17 (CS76575), Dem-4 (CS76794), and Ts-1 (CS76615) that shared all ABA1-Pat polymorphisms; and in parallel aba1-1 and aba1-6 with the corresponding Ler and Col-0 controls, respectively. Box and whisker diagrams depict data around the median, while distinct letters indicate significant differences between means analyzed by LSD test (p-value < 0.05).

Similar articles

Cited by

References

    1. Alonso-Blanco C., Aarts M. G. M., Bentsink L., Keurentjes J. J. B., Reymond M., Vreugdenhil D., et al. (2009). What has natural variation taught us about plant development, physiology, and adaptation? Plant Cell 21 1877–1896. 10.1105/tpc.109.068114 - DOI - PMC - PubMed
    1. Alonso-Blanco C., Peeters A. J. M., Koornneef M., Lister C., Dean C., Van Bosch N., et al. (1998). Development of an AFLP based linkage Map of Ler, Col and Cvi Arabidopsis thaliana ecotypes and construction of a Ler/Cvi recombinant inbred line population. Plant J. 14 259–271. - PubMed
    1. Arends D., Prins P., Jansen R. C., Broman K. W. (2010). R/qtl: high-throughput multiple QTL mapping. Bioinformatics 26 2990–2992. 10.1093/bioinformatics/btq565 - DOI - PMC - PubMed
    1. Aukerman M. J., Hirschfeld M., Wester L., Weaver M., Clack T., Amasino R. M., et al. (1997). A deletion in the PHYD gene of the Arabidopsis wassilewskija ecotype defines a role for phytochrome D in red/far-red light sensing. Plant Cell 9 1317–1326. 10.1105/tpc.9.8.1317 - DOI - PMC - PubMed
    1. Bae G., Choi G. (2008). Decoding of light signals by plant phytochromes and their interacting proteins. Ann. Rev. Plant Biol. 59 281–311. 10.1146/annurev.arplant.59.032607.092859 - DOI - PubMed

LinkOut - more resources